

The digital divide is frequently associated with inequalities in Internet access. However, high internet penetration does not guarantee equality and effective connectivity. Territories may differ not only in the availability of Internet access, but also in the performance of the connections available to users.
As a consequence, this study examines the inequalities in fixed-Internet access, using the Dominican Republic as a case study. For this study, we also examine differences in network performance.
The results show a mixed picture. Fixed-Internet penetration has increased, and territorial inequality has declined, yet substantial differences remain. Moreover, some provinces with greater penetration also tend to experience better network performance. This highlights that high aggregate penetration can coexist with substantial territorial inequalities.
The digital divide is more than being connected
Historically, people have often discussed Internet connectivity in terms of who is connected and who is not. However, this perspective does not capture the whole picture. As noted by the ITU and the Office of the UN Secretary-General’s Envoy on Technology, other dimensions must also be considered, including equality in access and effective connectivity. Moreover, a relatively high level of economy-level Internet penetration may conceal substantial inequalities within an economy.
For instance, according to the World Bank Development Indicators, in the Dominican Republic, fixed-broadband penetration reached approximately 11.73 subscriptions per 100 inhabitants in 2024, calculated as the ratio between the total number of fixed-broadband subscriptions and the total population. This value is lower than that observed in Europe according to the Economic Commission for Latin America and the Caribbean (ECLAC), at approximately 19.7 subscriptions per 100 inhabitants, but relatively higher than in neighbouring Caribbean economies such as Cuba, with approximately 3.0, and Haiti, with approximately 0.3 subscriptions per 100 inhabitants
This figure of 11.73 subscriptions per 100 inhabitants represents the aggregate ratio, which is equivalent to a population-weighted mean of provincial penetration levels. As such, it primarily provides a population-based perspective of fixed-Internet penetration. However, an unweighted mean across the economy’s 32 provinces provides a territorial perspective.
Using provincial fixed-Internet subscription counts and provincial population estimates from the National Statistics Office in the Dominican Republic, we calculated fixed-Internet penetration as the number of subscriptions per 100 inhabitants. Under this perspective, the average (unweighted) fixed-Internet penetration across the economy’s 32 provinces is 8.34 subscriptions per 100 inhabitants in 2024.
The resulting gap of 3.39 subscriptions per 100 inhabitants between the aggregate and territorial means suggests Internet density inequalities among the economy’s provinces that may be concealed by the aggregate penetration mean. This gap also provides an early indication that connectivity is unevenly distributed across territories.
A territorial view of Internet connectivity
A broader view of connectivity motivates a territorial analysis that considers not only who is connected, but also how well the network performs.
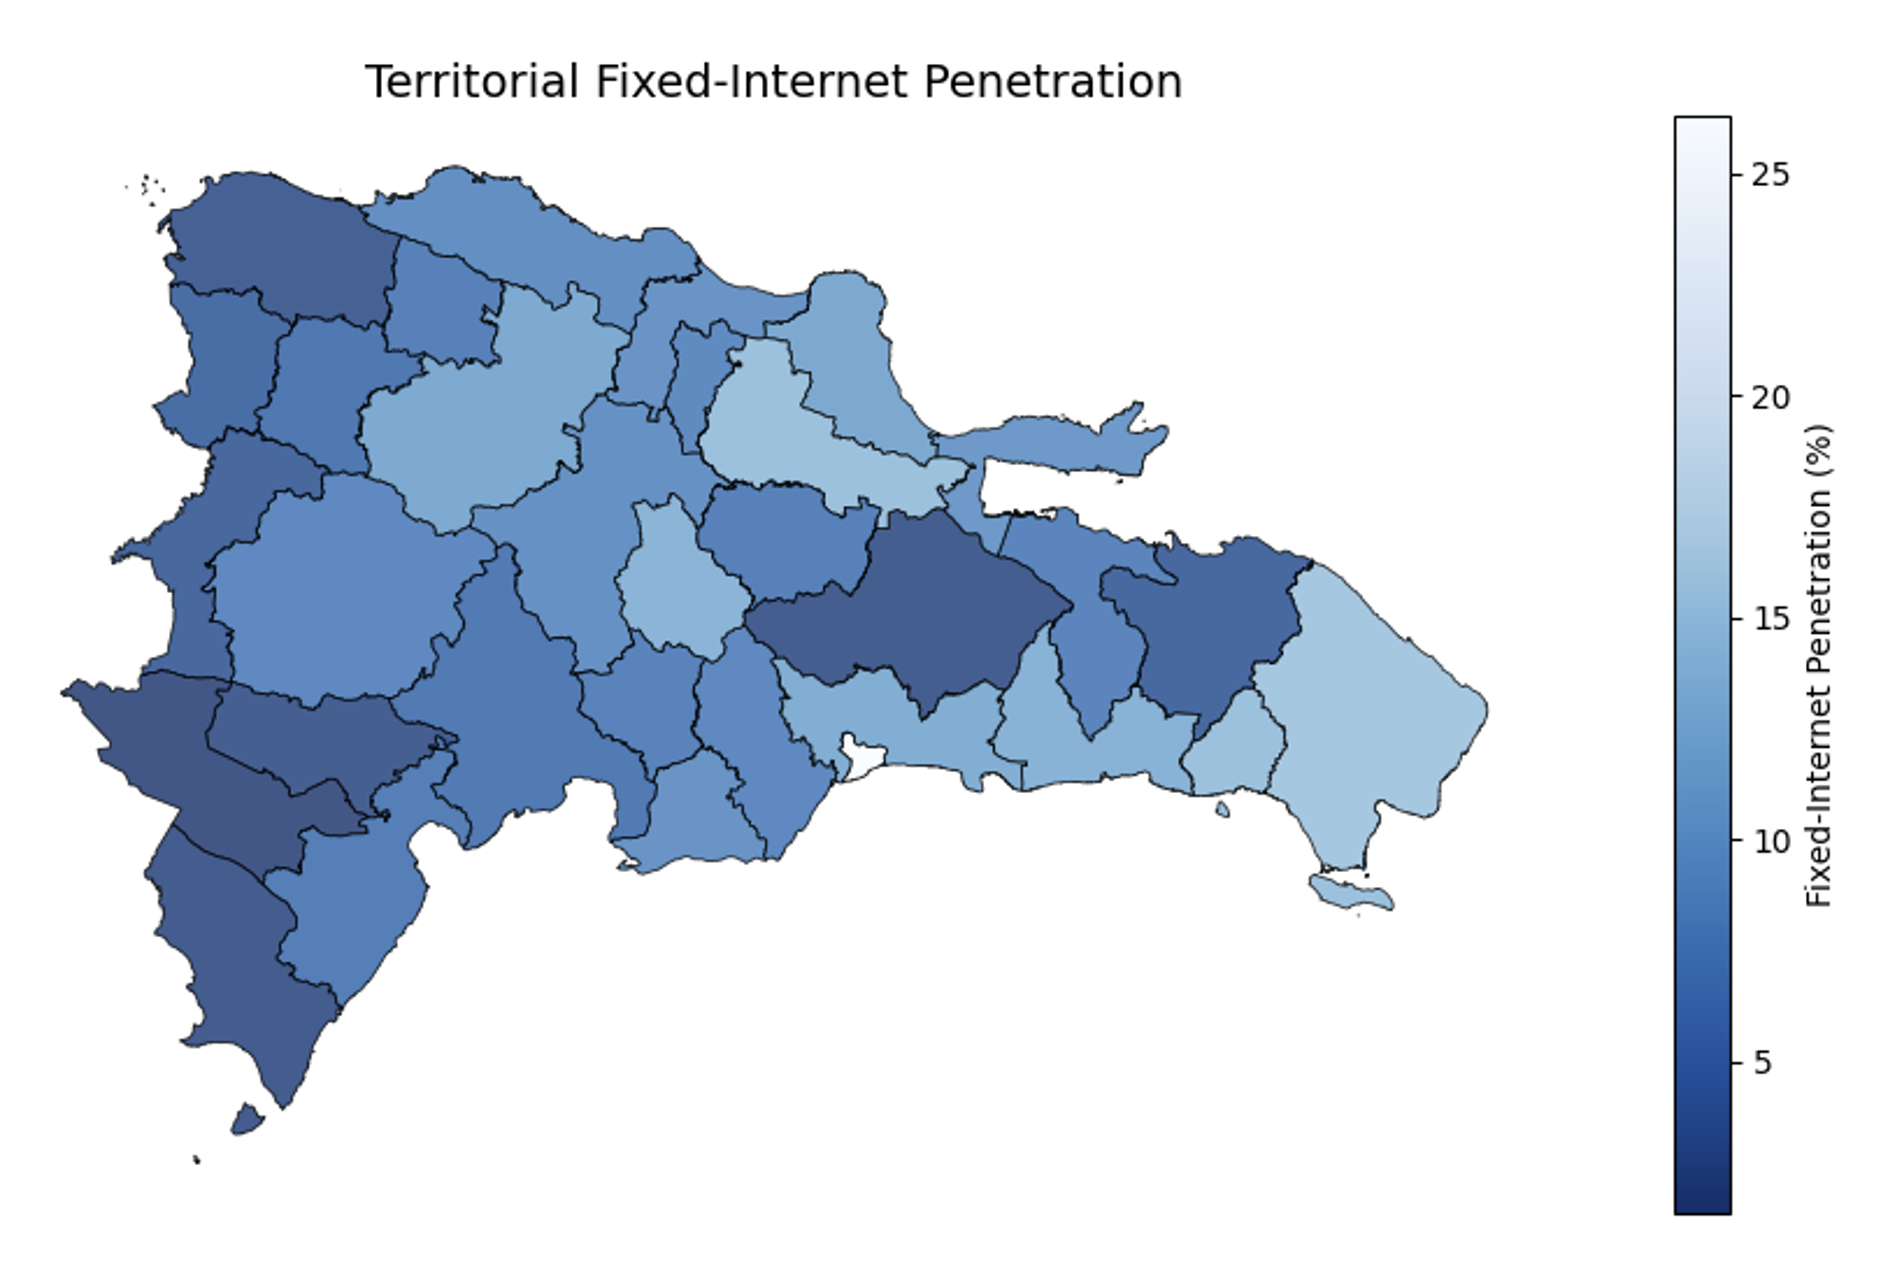
For instance, a deeper look at penetration inequalities shows that the max/min ratio between the provinces with the highest and lowest Internet density is 16.37, ranging from Distrito Nacional (26.2%) to Independencia (1.6%). In other words, fixed-Internet penetration in Distrito Nacional was approximately 16.4 times that observed in Independencia. This magnitude provides strong evidence that territorial inequalities in fixed-Internet access cannot be overlooked.
To illustrate this, Figure 1 shows a snapshot of the distribution of Internet density across the Dominican Republic in 2024. As can be seen, Internet density is not evenly distributed among provinces. A clear territorial pattern emerges, particularly in the southwestern part of the economy, while the highest levels of Internet access are concentrated in Distrito Nacional, the economy’s capital and main economic centre, and La Altagracia, a province widely known for its tourism activity.
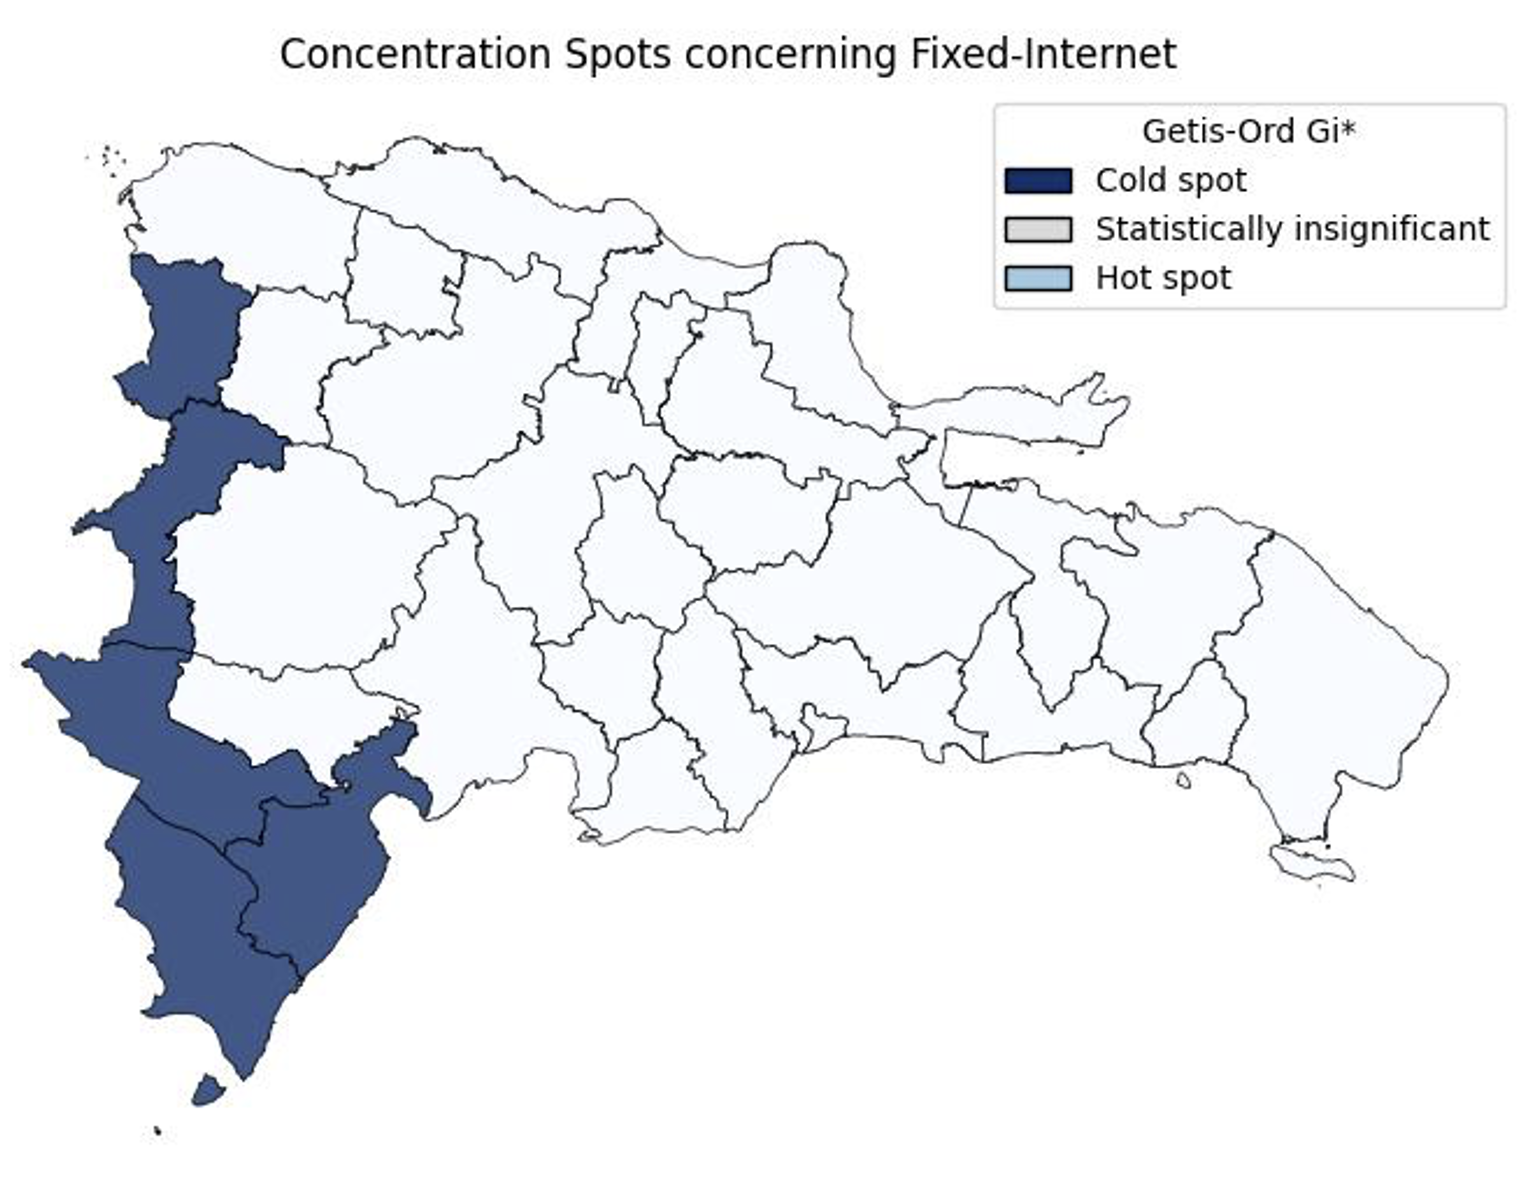
Indeed, these patterns can be appreciated by means of a Getis-Ord Gi*, which moves the analysis from visual patterns to statistical evidence. Take a look at Figure 2, where a hot-spot map is shown that illustrates territorial clusters of high and low fixed-Internet penetration in 2024. In this case, it shows statistical evidence of a cluster of low Internet density along the southwestern part of the economy, where penetration is lower than 5%.
However, no statistically significant cluster is shown near Distrito Nacional or La Altagracia. This suggests that the Internet penetration levels in these two provinces are relatively localized. Moreover, provinces with relatively high penetration and large populations can increase the aggregate penetration, potentially concealing the statistically significant patterns of low connectivity observed in the southwestern part of the economy.
The territorial differences shown provide a snapshot of where connectivity is concentrated. However, understanding territorial connectivity also requires looking at how these inequalities evolve over time.
Are territorial inequalities declining?
The previous section provides a snapshot of the territorial distribution of fixed-Internet access. However, a snapshot does not tell us the whole picture concerning these inequalities. It is also useful to look at how the distribution of connectivity changes over time.
One straightforward way of doing this is by means of the Gini coefficient. The Gini coefficient summarizes how equally or unequally a resource is distributed. In our case, the resource is fixed-Internet density across the economy’s provinces.
Inequality, however, is not the same as polarization. A distribution can become less unequal and, at the same time, be more concentrated in two distinct clusters, such as territories with relatively low- and high-connectivity. The Wolfson index provides a simple way to capture this effect.
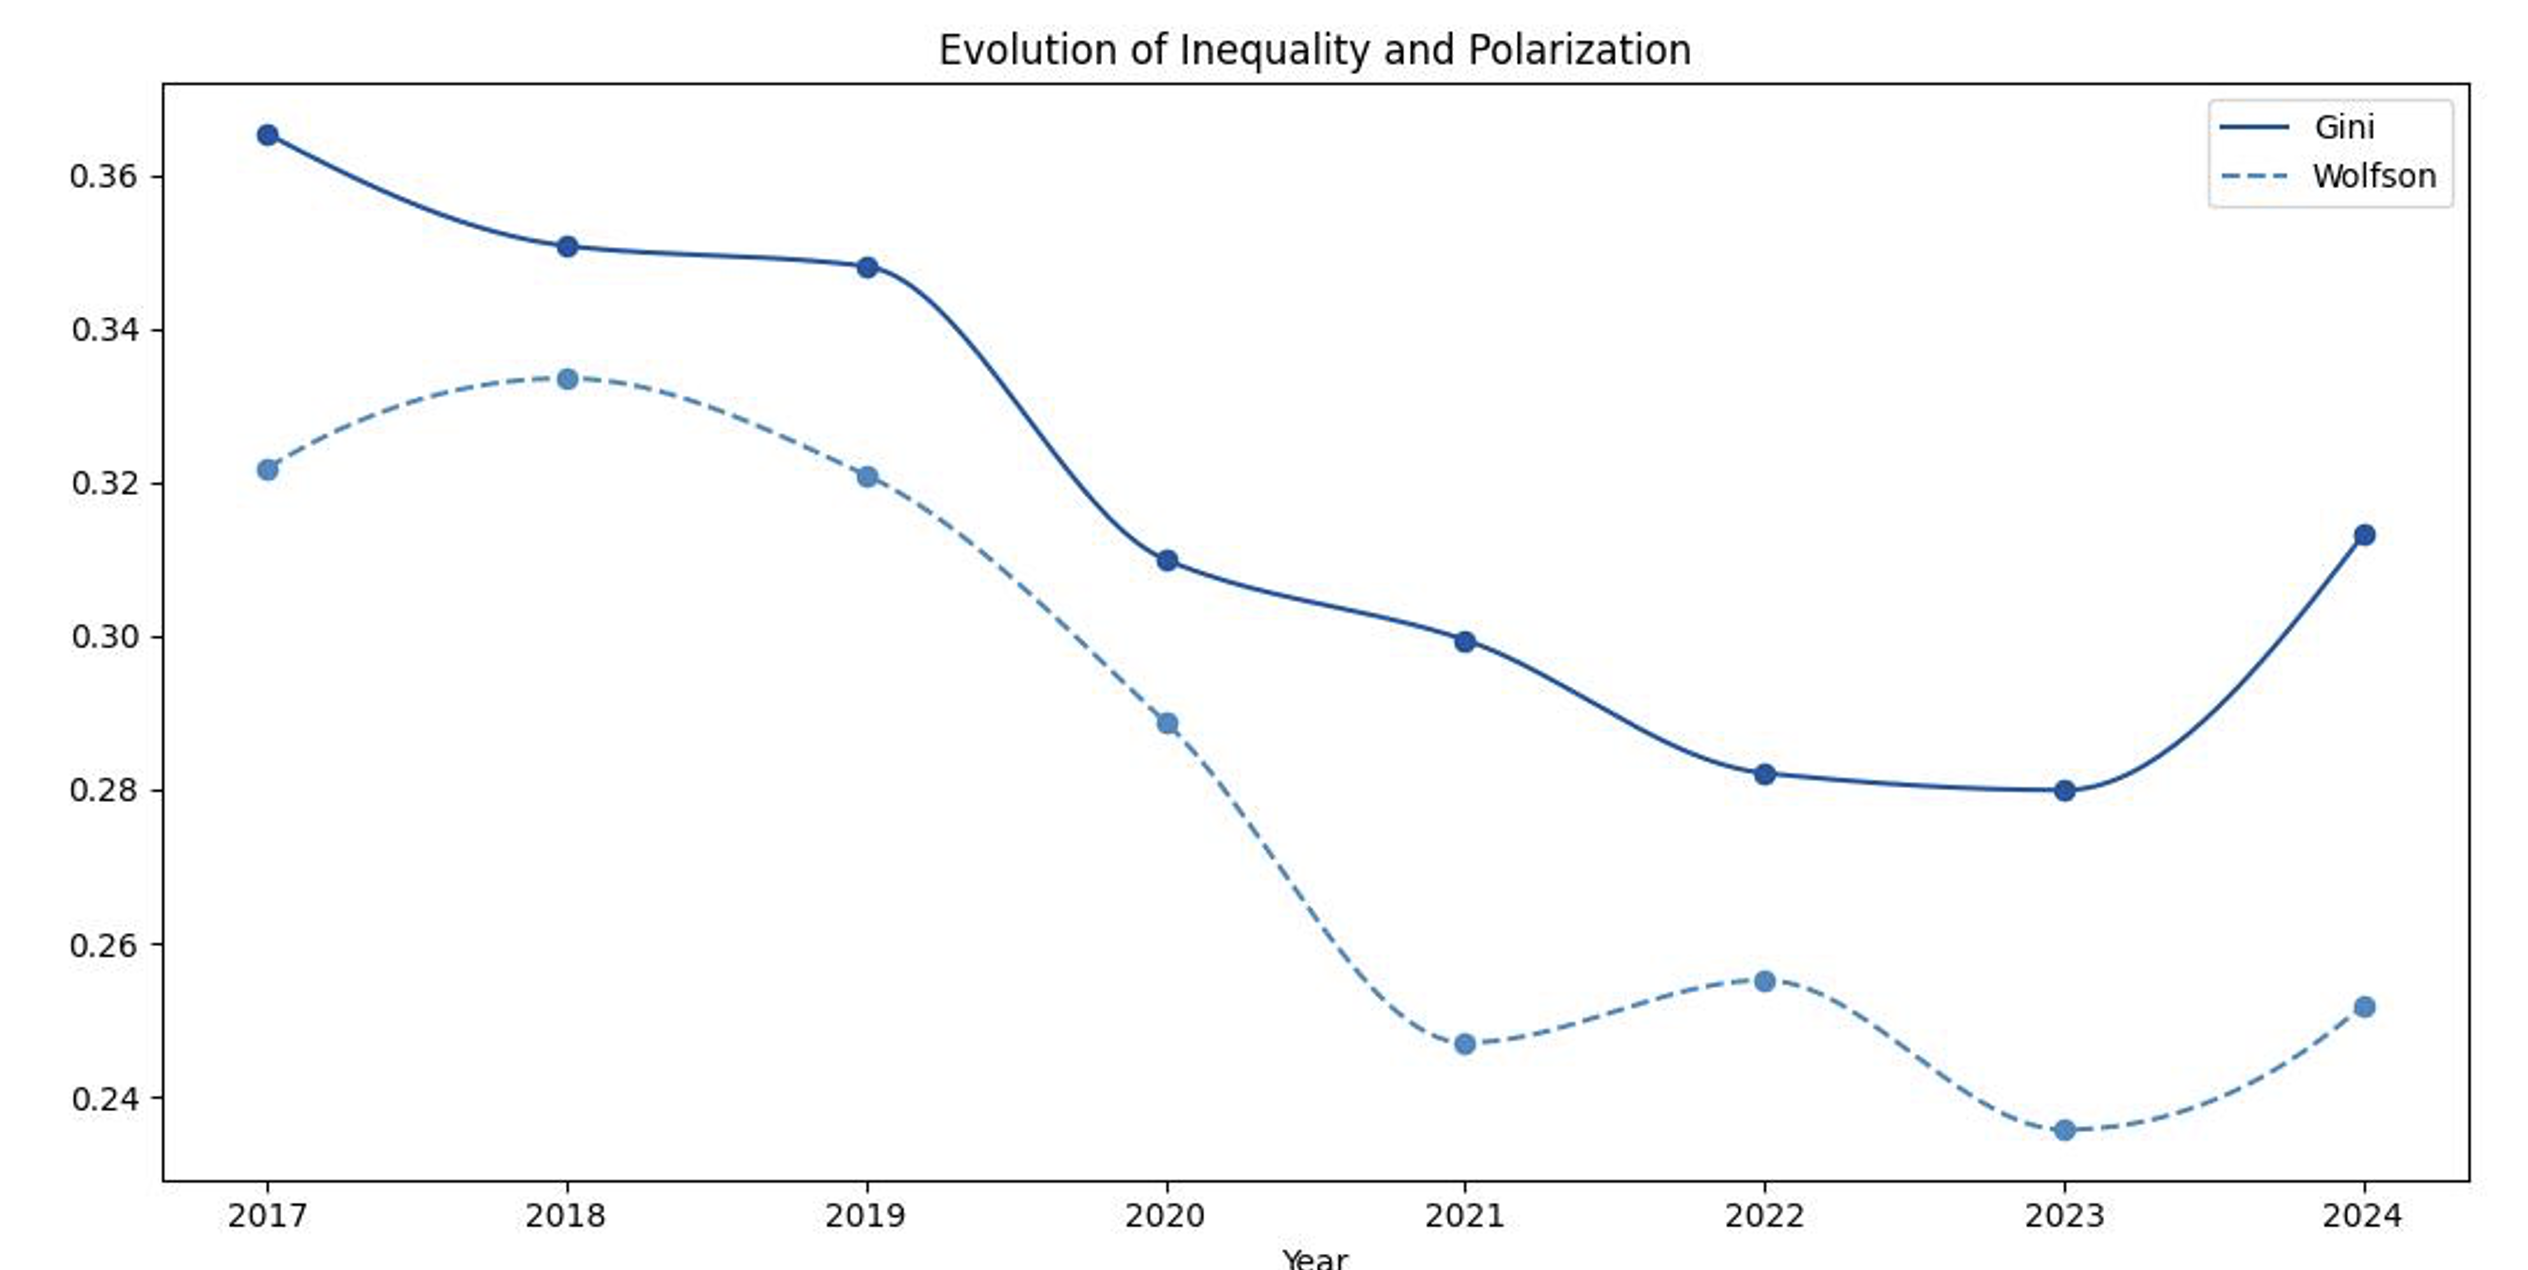
Figure 3 shows the evolution of inequality and polarization for fixed-Internet in the Dominican Republic. Between 2017 and 2024, the Gini coefficient for fixed-Internet density decreased from 0.365 to 0.313. On the other hand, the Wolfson index decreased from 0.321 in 2017 to 0.252 in 2024. Taken together, the Gini and Wolfson indicators show that fixed-Internet access remains territorially unequal, but both inequality and polarization have decreased during the period analysed. The slight increase observed in 2024 also shows that this improvement has not followed a perfectly continuous path.
Being connected is not enough
In the previous sections, we discussed Internet access from different dimensions, such as penetration levels and territorial distribution. However, they do not tell us how connectivity performs. As discussed in Measuring IP Network Performance, increasing access speed also increases users’ expectations about the quality of the Internet service they receive.
To address effective connectivity, it is useful to look at several performance indicators, such as download/upload speed and transmission latency.
These metrics describe different properties of connectivity and do not necessarily move together. For example, a connection can provide relatively high download speed while still experiencing high latency, which may affect interactive applications.
To explore this dimension of the digital divide, we used Ookla fixed-network measurements for download speed, upload speed, and latency, aggregated at the provincial level. The 2024 data show considerable differences across the economy. Provincial average download speeds ranged from 25.53 to 84.46Mbps, upload speeds from 5.83 to 32.36Mbps, while latency ranged from 9.27 to 67.28ms. These values show that territorial inequalities are also present in network performance.
Having established these inequalities, an interesting question is whether provinces with higher fixed-Internet penetration also experience better network performance. To this end, we correlated, by means of the Pearson correlation, the provincial Internet density with the three network performance indicators for 2024. Internet density shows a strong positive correlation with download speed (r = 0.83) and upload speed (r = 0.82).
In other words, provinces with higher levels of fixed-Internet penetration also tend to have higher connection speeds. Latency shows the opposite relationship, with a correlation of r = −0.70, meaning that provinces with higher penetration tend to experience lower network delay.
However, these relationships are not one-to-one. High penetration does not automatically imply the highest download or upload speed, nor the lowest latency. The three network performance indicators also capture different characteristics of the network. Therefore, looking only at the number of subscriptions provides an incomplete picture of territorial connectivity.
| Metric | Mean | Standard deviation | Minimum | Maximum |
| Download speed (Mbps) | 37.09 | 10.83 | 25.53 | 84.46 |
| Upload speed (Mbps) | 16.11 | 5.22 | 5.83 | 32.36 |
| Latency (ms) | 29.47 | 15.37 | 9.27 | 67.28 |
Final thoughts on the digital divide: Looking beyond penetration
Aggregate penetration figures alone do not provide a complete picture of connectivity. Access, territorial distribution and network performance describe different perspectives of the same phenomenon.
This distinction suggests a simple lesson for measuring the digital divide. Who is connected tells us about access; network connection performance tells us something about the quality of that Internet access. Measuring these dimensions together provides a more complete picture of who gets connected —and of the connectivity they actually receive.
Dr Wilson Ramírez is a researcher and lecturer specializing in telecommunications, Internet infrastructure, and data analytics. His work combines econometric analysis and network measurement to examine issues such as digital inclusion, Internet routing, cybersecurity, and connectivity development across the Dominican Republic and the Caribbean.
The views expressed by the authors of this blog are their own and do not necessarily reflect the views of APNIC. Please note a Code of Conduct applies to this blog.