

The first part of this series examined the commonalities and disparities in incorrect domain name queries between China and the global DNS system, delving into the underlying reasons for these variations. The second part was a thorough analysis of the origins and consequences of incorrect domain names conducted from the domain names’ standpoint.
In this final part, we’ll take a regional approach and compare the variations in error responses among various provinces in China and their root causes. The overarching objective is to gain a more precise understanding of the domestic DNS system’s operational efficiency and security, with the ultimate aim of improvement.
NXDOMAIN response situations in various provinces
Due to the variance in the volume of DNS query requests collected from different provinces, directly comparing the absolute number of NXDOMAIN queries does not accurately reflect the real situation. To fairly compare the proportion of NXDOMAIN queries across provinces, we use ‘the percentage of NXDOMAIN queries in each province to the total number of queries in that province’ as an indicator.
By calculating the proportion of NXDOMAIN queries in each province, the impact of different data volumes of DNS queries across provinces can be eliminated, more accurately reflecting the actual situation of DNS resolution quality in each province.
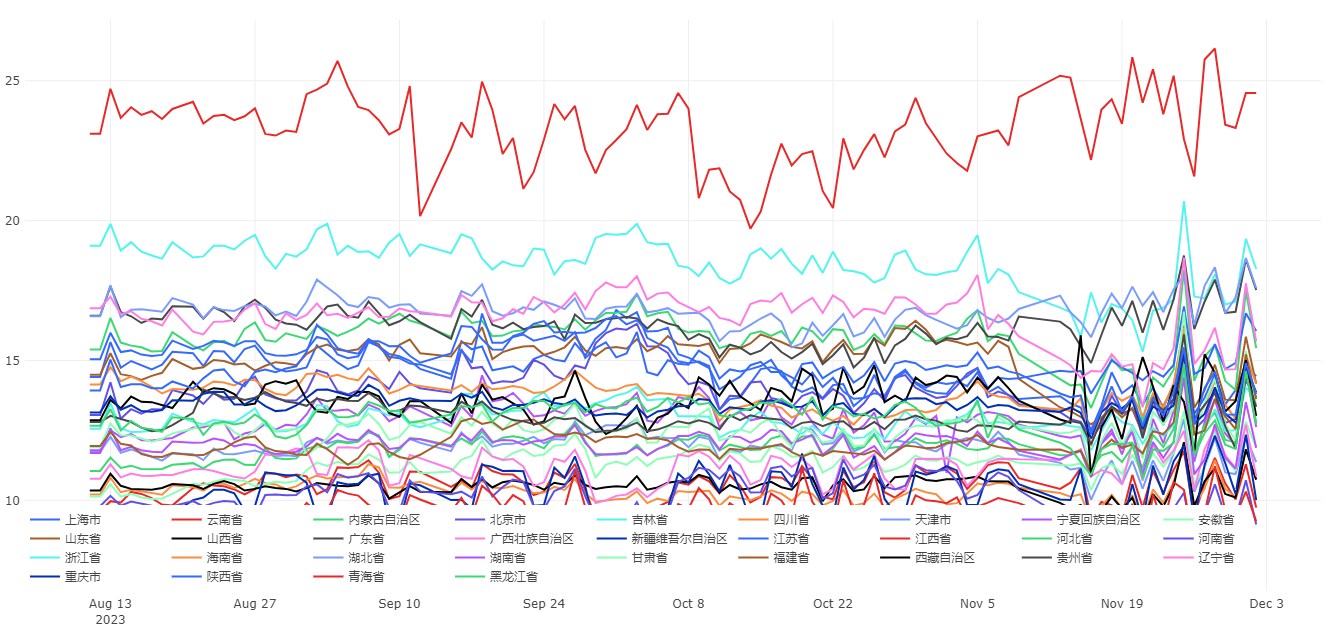
Figure 1 shows a time series graph of the proportion of NXDOMAIN queries in different provinces from August to December 2023. Different coloured lines represent different provinces. As can be seen from Graph 1, the proportion of NXDOMAIN queries in most provinces remains within a fluctuation range of (14±5)%. However, it is noteworthy that the Jiangxi Province has the highest proportion of NXDOMAIN queries, about 24%, which is significantly different compared to other provinces.
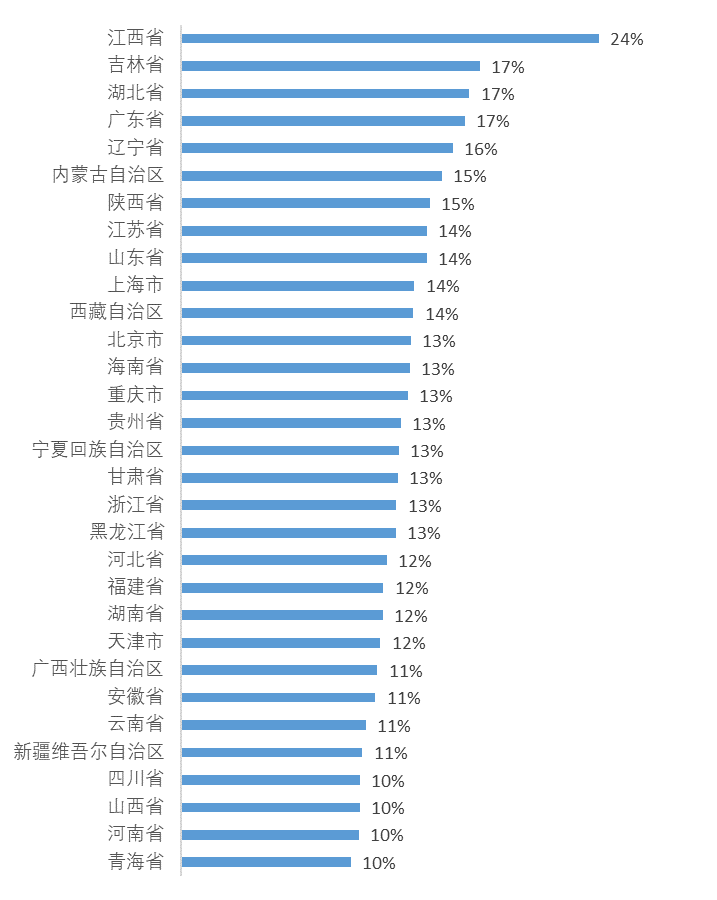
The detailed proportions for a day selected from the range in Figure 1 are shown in Figure 2.
NXDOMAIN analysis in Jiangxi Province
Using the domain name analysis method from Section 2, we classified the NXDOMAIN query domain names originating from Jiangxi Province. It was found that the number of reverse queries, similar to IPV4.in-addr.arpa, is exceptionally high, accounting for over 60% of all NXDOMAIN queries in the Jiangxi Province.
Reverse querying domain names
We reversed the prefixes of reverse query domain names for all NXDOMAIN data originating from the Jiangxi Province, extracting the associated IP addresses, which we term query IPs.
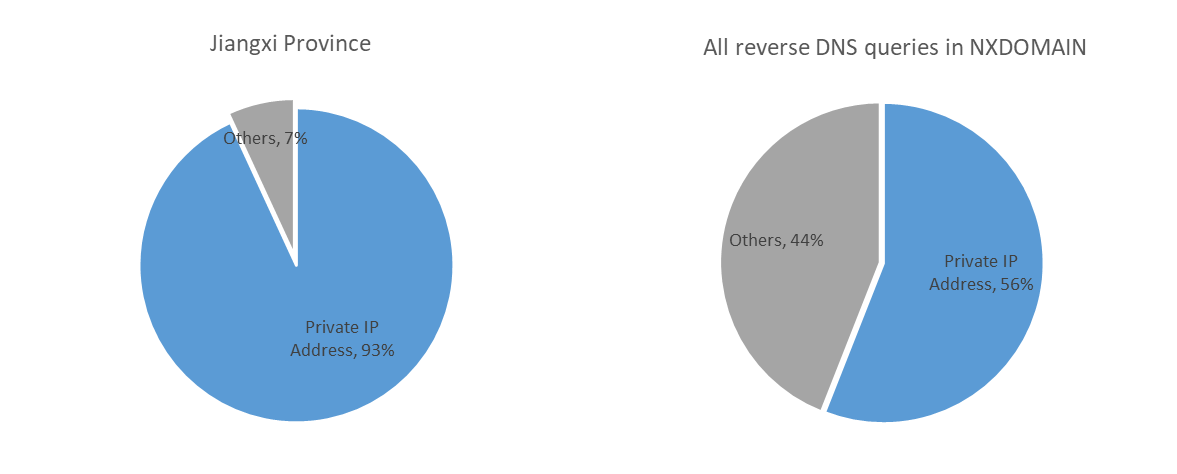
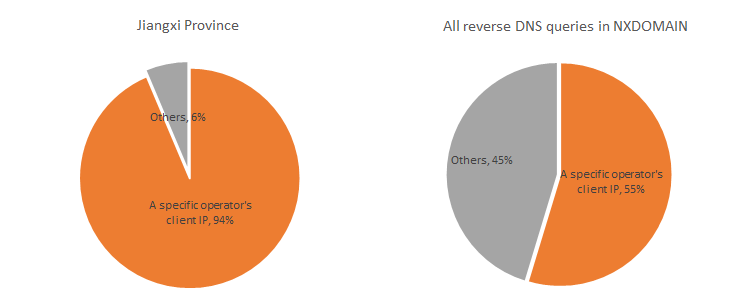
Upon analysing these query IPs, it was found that they are predominantly private network addresses like 192.168, accounting for 93% of the total reverse queries. This indicates that these reverse queries mainly originate from internal or local area network requests. When we applied the same method to analyse national data, the proportion of reverse queries for private network addresses also reached 56%, indicating that this situation is not unique to Jiangxi Province.
From an analysis of the client sources initiating these query requests, it was observed that 92% of the requests originated from IPs belonging to a specific telecommunications operator. Further analysis revealed that the majority of these IPs were associated with the operator’s home broadband services, amounting to hundreds of thousands in number.
From the above analysis, it is clear that the high proportion of NXDOMAIN in the Jiangxi Province is primarily due to a large number of reverse DNS queries initiated by internal network IPs, with the querying clients predominantly being home broadband IPs from a specific telecommunications operator. Extending the timeline, we should investigate when this phenomenon began.
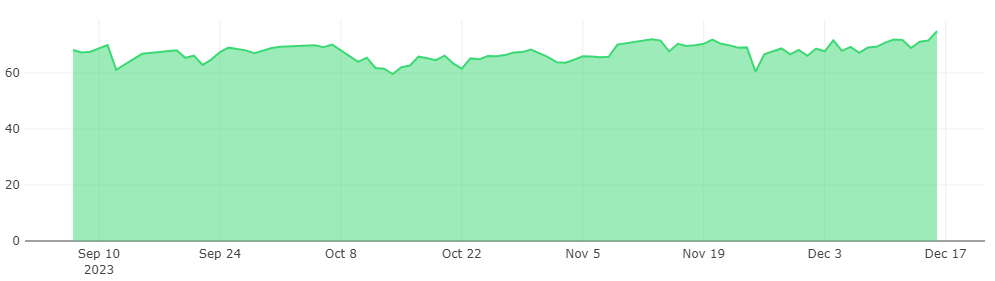
Figure 6 shows the DNS query statistics on the first day of each month in Jiangxi Province for the years 2022 and 2023.
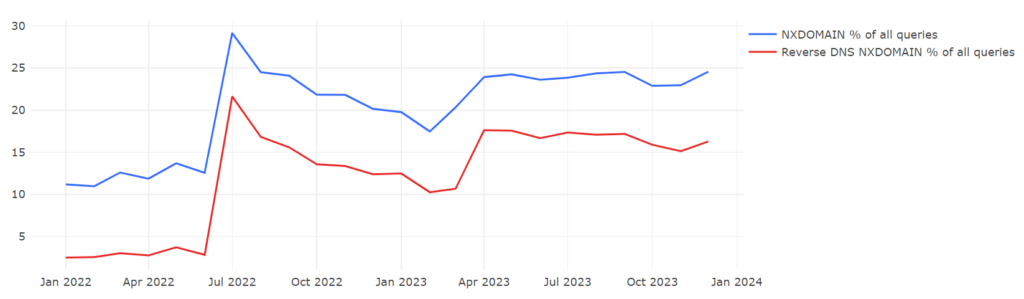
Figure 6 presents two time-series curves. The blue line represents the percentage of NXDOMAIN DNS queries in the province as a proportion of all DNS queries within the province; the red line represents the percentage of reverse DNS queries that received an NXDOMAIN response as a proportion of all DNS queries in the province.
By examining the fluctuations in the red line, it becomes apparent that before June 2022, the percentage of reverse DNS queries remained notably low, consistently staying below 5%. In July 2022, there was a sharp rise to 21%, followed by a slight decrease but maintaining around 10% (as of 1 March 2023). From February 2023 onwards, the proportion of reverse queries stabilized at around 16%. This indicates that around July 2022, there was a significant change in reverse DNS queries, with the proportion substantially increasing and continuing to remain at a higher level.
Based on the temporal changes in the NXDOMAIN response ratio and previous cases (1, 2), it can be speculated that the unusually high percentage of NXDOMAIN response requests in the Jiangxi Province may be due to improper configuration of certain network equipment (such as routers or wireless devices) provided by the telecom operator in that region.
Latest update: Monitoring has revealed that after 27 December 2023, the proportion of NXDOMAIN responses in Jiangxi Province has decreased to around 14%, returning to normal levels.
Wrapping up
On our recursive resolution server, the proportion of NXDOMAIN responses is around 14%, of which 81% of the NXDOMAIN responses are from domain name queries within the ICANN system, primarily in the .arpa and .com domains. Queries outside the ICANN system account for 19%, with .ctc having the highest proportion.
By comparing the most frequently queried non-ICANN Top-Level Domains (invalid TLDs) on both recursive resolvers and root servers, it was found that there are many overlaps. However, the rankings of these TLDs in terms of query volume show significant differences, primarily because the geographical area from which we collect data is relatively concentrated.
The reasons for DNS queries resulting in NXDOMAIN responses can be divided into two main categories — those caused by software applications and those caused by system configurations. Application-related issues include blacklist services, dark grey industries, Chromoid, user tracking, advertising tracking, and so on, while configuration-related issues include device ID queries, private IP reverse queries, and so on.
In the public DNS, reserved domain names like .local primarily appear in the pattern of UUID.local. Analysis reveals that UUID.local domain names are used to conceal internal network IP addresses when employing WebRTC technology, and they are broadcast only in multicast DNS environments. The leakage of these domain names to public DNS may be associated with a bug in a specific open-source library.
Geographically, the proportion of NXDOMAIN responses in the Jiangxi Province is 23%, significantly higher than in other provinces. Analysis indicates that over 60% of the erroneous queries come from PTR queries for private IPs by clients of a certain telecommunications operator, which may be due to the configuration of local network devices.
We have developed an automated monitoring system that enables timely detection of anomalies in error responses from various perspectives, including response ratio, TLD distribution, pattern analysis, and regional clients. Implementing such monitoring on a dataset with such a wide user coverage helps us better understand the state of DNS network operations. This is significant, not only for individuals, businesses, and operators but also for government regulatory agencies.
Jinghua Bai, a Senior Security Analysis Engineer at Qi An Xin, specializes in DNS data analysis and big data mining.
Zaifeng Zhang contributed to this work.
This series is adapted from the original at Qi An Xin blog.
The views expressed by the authors of this blog are their own and do not necessarily reflect the views of APNIC. Please note a Code of Conduct applies to this blog.