

The last 12 months have flown by! Travel is back on and IPv6 training seems to be at the forefront of everyone’s mind. For those that follow me on Twitter, you will have seen a lot more interaction with myself and many other IPv6 advocates. That’s because the clock is really ticking.
Predicting the end of IPv4 has been happening for some time, and there has been a concerted push in certain parts of the world over the last 12 to 18 months to get IPv6 deployed in ISP and telco networks.
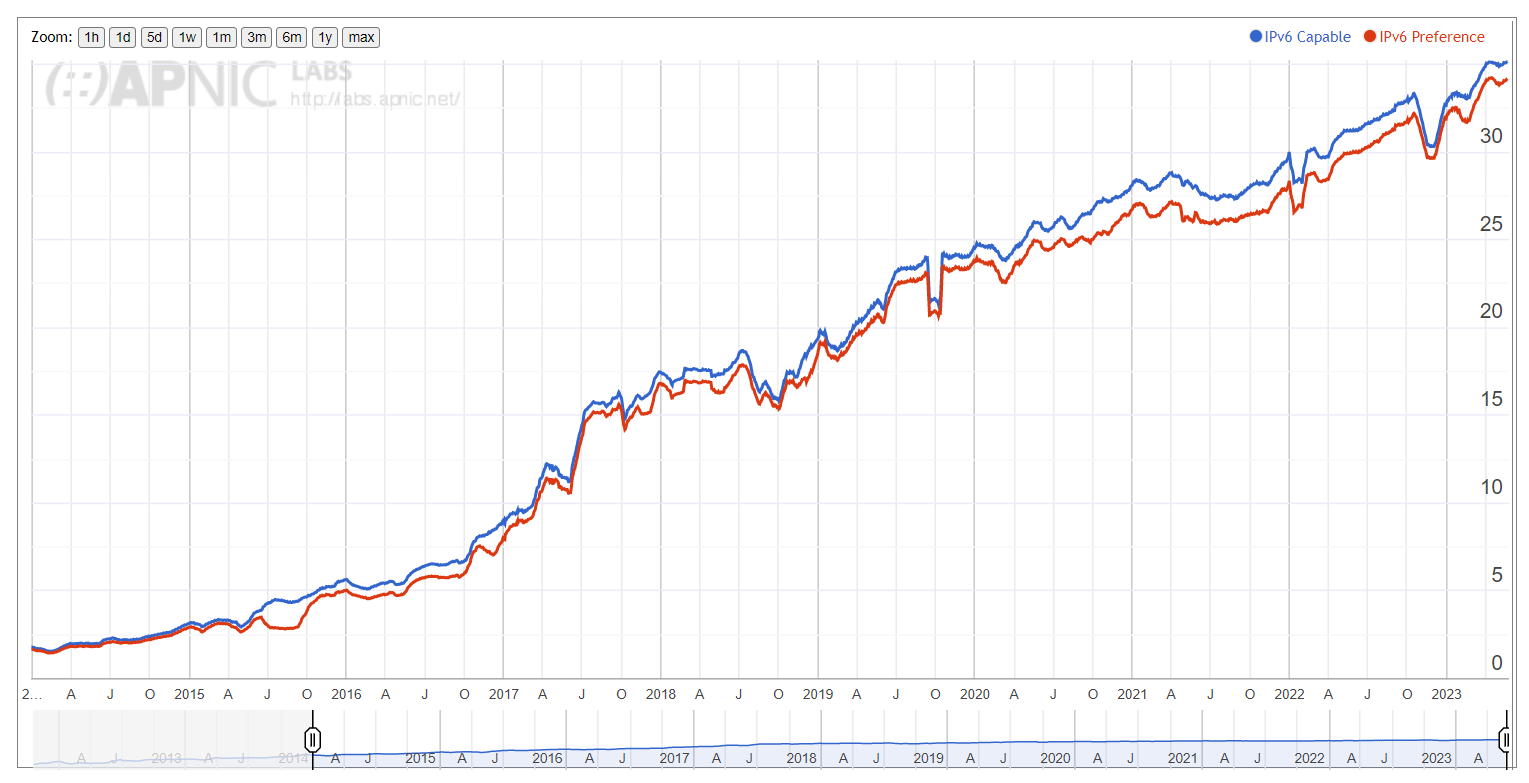
Looking at the numbers over the last couple of years, there has been some steady growth globally. In January 2020 IPv6 sat at ~23.28% preferred, increasing to 34.44% preferred on 31 May 2023.
Looking at my ‘Over 40% preferred’ global leader board, there were seven economies from the Asia Pacific region (Table 1) in the top 30 when measured in May 2023.
| CC | Economy, subregion, region | IPv6 preferred |
| IN | India, Southern Asia, Asia | 78.80% |
| BE | Belgium, Western Europe, Europe | 66.49% |
| FR | France, Western Europe, Europe | 64.97% |
| MY | Malaysia, South-Eastern Asia, Asia | 64.74% |
| BL | Saint Barthelemy, Caribbean, Americas | 63.22% |
| DE | Germany, Western Europe, Europe | 60.97% |
| UY | Uruguay, South America, Americas | 58.91% |
| SA | Saudi Arabia, Western Asia, Asia | 58.31% |
| GR | Greece, Southern Europe, Europe | 57.75% |
| VN | Vietnam, South-Eastern Asia, Asia | 56.41% |
| IL | Israel, Western Asia, Asia | 53.65% |
| MS | Montserrat, Caribbean, Americas | 53.24% |
| US | United States of America, Northern America, Americas | 53.17% |
| LK | Sri Lanka, Southern Asia, Asia | 52.26% |
| AX | Aland Islands, Northern Europe, Europe | 50.26% |
| AE | United Arab Emirates, Western Asia, Asia | 50.00% |
| TW | Taiwan, Eastern Asia, Asia | 49.57% |
| JP | Japan, Eastern Asia, Asia | 49.38% |
| MX | Mexico, Central America, Americas | 49.31% |
| HU | Hungary, Eastern Europe, Europe | 49.25% |
| LU | Luxembourg, Western Europe, Europe | 48.71% |
| FI | Finland, Northern Europe, Europe | 48.57% |
| TH | Thailand, South-Eastern Asia, Asia | 47.60% |
| NL | Netherlands, Western Europe, Europe | 44.96% |
| BR | Brazil, South America, Americas | 44.95% |
| GB | United Kingdom of Great Britain and Northern Ireland, Northern Europe, Europe | 44.07% |
| PT | Portugal, Southern Europe, Europe | 42.58% |
| PR | Puerto Rico, Caribbean, Americas | 42.13% |
| CH | Switzerland, Western Europe, Europe | 41.65% |
At the same time, many ‘developing’ economies are beginning to embrace and deploy IPv6 as IPv4 resources become scarcer. Within the Asia Pacific region, there is an interesting spread of IPv6 stories throughout the subregions. Let’s examine the subregions more closely.
Explaining capable vs preferred
When measuring IPv6 usage, if APNIC Labs can fetch a URL using IPv6 then the host system is labelled ‘IPv6 capable’. However, if it uses IPv6 to fetch the dual-stack URL, it’s labelled IPv6 preferred’. More detail is available at APNIC Labs.
South East Asia
In South East Asia (SEA) there are 11 separate economies with a total population of around 685M. Generally speaking, these economies have good international connectivity and good competition within the markets.
In May 2023, the SEA subregion was sitting at 30.36% preferred IPv6, with three of the 11 economies over 40% preferred, and the remaining seven economies with more than 10%. The subregion has seen steady growth since 2020 when it was sitting at around 14% preferred (Table 2).
| CC | Economy, subregion, region | IPv6 capable | IPv6 Preferred |
| MY | Malaysia, South-Eastern Asia, Asia | 66.11% | 64.95% |
| VN | Vietnam, South-Eastern Asia, Asia | 57.46% | 56.28% |
| TH | Thailand, South-Eastern Asia, Asia | 48.24% | 47.68% |
| MM | Myanmar, South-Eastern Asia, Asia | 27.52% | 26.48% |
| PH | Philippines, South-Eastern Asia, Asia | 17.47% | 17.15% |
| ID | Indonesia, South-Eastern Asia, Asia | 16.16% | 15.83% |
| SG | Singapore, South-Eastern Asia, Asia | 15.63% | 13.63% |
| LA | Lao People’s Democratic Republic, South-Eastern Asia, Asia | 0.24% | 0.23% |
| BN | Brunei Darussalam, South-Eastern Asia, Asia | 0.14% | 0.13% |
| TL | Timor-Leste, South-Eastern Asia, Asia | 0.06% | 0.06% |
| KH | Cambodia, South-Eastern Asia, Asia | 0.06% | 0.05% |
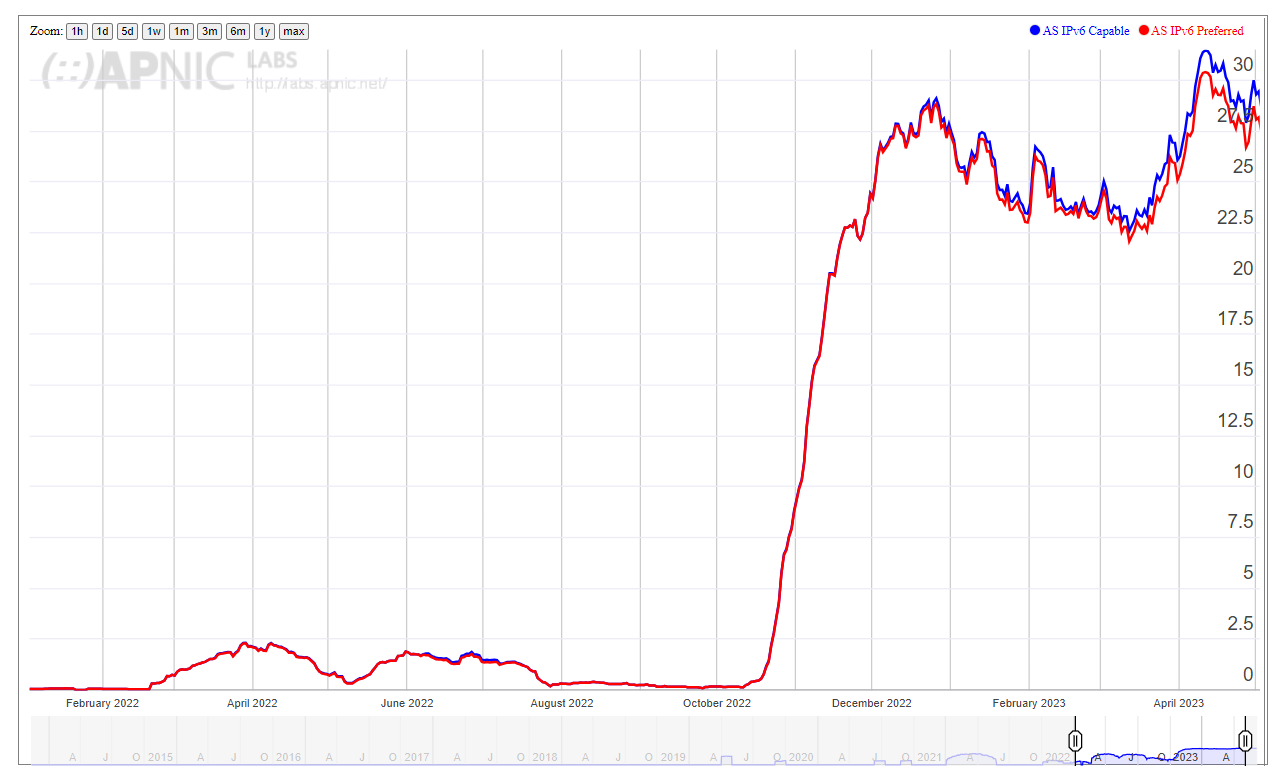
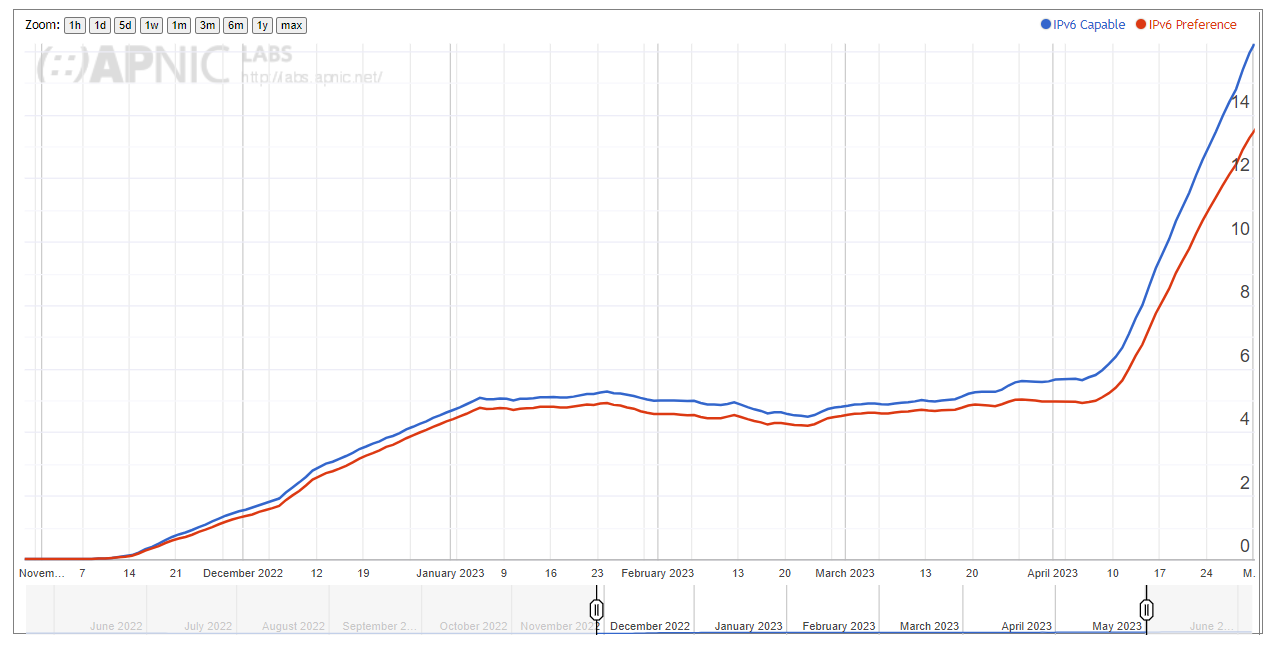
Myanmar is one of the interesting data points here. Within Myanmar, there are 102 different origin Autonomous System Numbers (ASNs) but one ASN was a standout — Mytel’s AS136255 (Figure 1).
Looking at the time scale, it can be quickly deduced what was happening with the region, with Internet shutdowns and damage to telecommunications infrastructure.
South Asia
This subregion with a population of just over two billion has eight separate economies and reasonable international connectivity. In some of these economies, there is good domestic competition but others are lacking, either due to regulatory factors or market sizes.
By May 2023, the subregion was at 63.84% IPv6 preferred. Two of the eight economies were over 40% and four of the eight were over 10%. The subregion is driven by India’s staggering numbers (Table 3).
| CC | Economy, subregion, region | IPv6 capable | IPv6 preferred |
| IN | India, Southern Asia, Asia | 79.16% | 78.75% |
| LK | Sri Lanka, Southern Asia, Asia | 53.81% | 52.97% |
| NP | Nepal, Southern Asia, Asia | 37.49% | 37.30% |
| BT | Bhutan, Southern Asia, Asia | 26.05% | 25.58% |
| BD | Bangladesh, Southern Asia, Asia | 8.87% | 8.15% |
| PK | Pakistan, Southern Asia, Asia | 8.12% | 7.79% |
| IR | Iran (Islamic Republic of), Southern Asia, Asia | 0.65% | 0.63% |
| AF | Afghanistan, Southern Asia, Asia | 0.44% | 0.42% |
| MV | Maldives, Southern Asia, Asia | 0.12% | 0.12% |
Outside of the top three, there has been a noticeable push from Bangladesh and Pakistan. While both economies have shown moderate growth, they’re steadily deploying. For instance, Bangladesh has gone from sub 1% to 8.43% since the start of 2022.
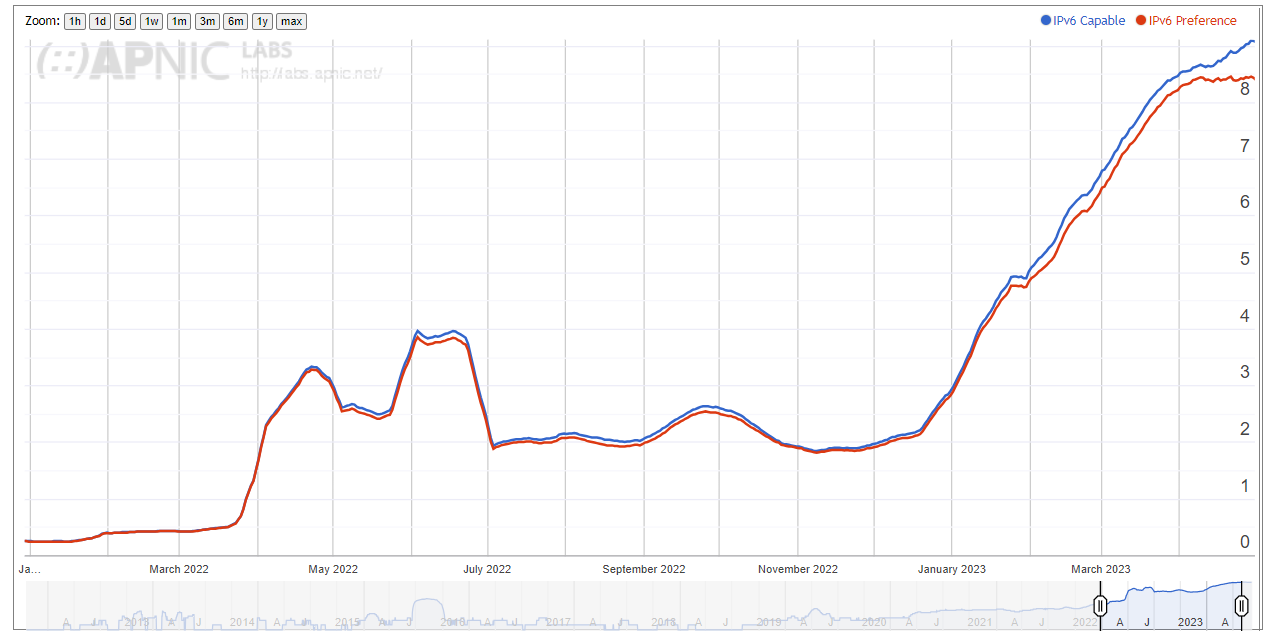
The growth in Bangladesh has been predominantly by two operators — Grameenphone’s AS24389 (Figure 4) and Velocity Internet’s AS134595 (Figure 5).
East Asia
Moving on to East Asia where there are eight economies with a total population of ~1.6B. Generally, East Asia has good international connectivity and good competition within their respective markets. East Asia differs from most of the other subregions discussed here due to the high number of National Internet Registries (NIRs) — CNNIC, JPNIC, TWNIC, and KRNIC.
The subregion was sitting at 31.75% preferred IPv6 usage with two of the eight economies over 40% and four over 10% (Table 4).
| CC | Economy, subregion, region | IPv6 capable | IPv6 preferred |
| TW | Taiwan, Eastern Asia, Asia | 52.70% | 49.23% |
| JP | Japan, Eastern Asia, Asia | 51.55% | 49.33% |
| CN | China, Eastern Asia, Asia | 31.96% | 29.95% |
| MO | Macao Special Administrative Region of China, Eastern Asia, Asia | 31.93% | 31.63% |
| MN | Mongolia, Eastern Asia, Asia | 26.54% | 21.48% |
| KR | Republic of Korea, Eastern Asia, Asia | 21.14% | 20.69% |
| HK | Hong Kong Special Administrative Region of China, Eastern Asia, Asia | 4.76% | 2.32% |
| KP | Democratic People’s Republic of Korea, Eastern Asia, Asia | 0 | 0 |
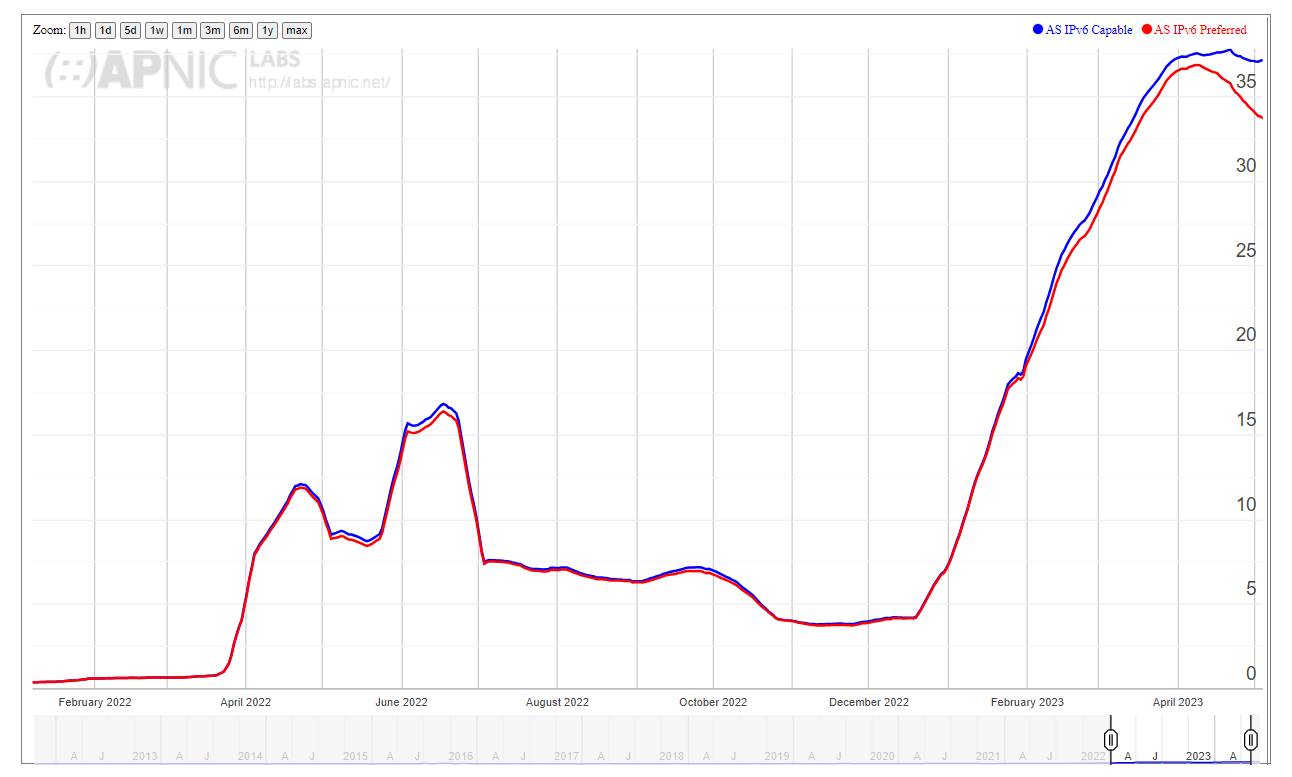
Although it has been well documented now, Mongolia saw a surprise leap in late 2022. Up from having almost no IPv6 traffic before November 2022, Mongolia was at 20.69% preferred and 25.29% capable (Figure 7) in May 2023. This surge is driven by the operator Univision (AS17882), which has a large Gigabit Passive Optical Network (GPON) footprint in major Mongolian population centres.
As the song goes, the only way is up as AS17882 continues to deploy and other Mongolian operators begin deploying their own IPv6-enabled networks.
Oceania
Now to the most geographically dispersed subregion — Oceania. There are 24 different economies in Oceania with a comparatively low total population of around 44M. Many economies in the subregion have small populations and aside from a select few developed economies, many have limited access to international connectivity, with some still exclusively relying on satellite uplinks. Due to the size of these markets, there is limited competition for consumers, which equates to fewer networks (Table 5).
| CC | Economy, subregion, region | IPv6 capable | IPv6 preferred |
| AU | Australia, Australia and New Zealand, Oceania | 38.89% | 37.55% |
| NZ | New Zealand, Australia and New Zealand, Oceania | 28.95% | 26.49% |
| PF | French Polynesia, Polynesia, Oceania | 10.44% | 9.96% |
| PG | Papua New Guinea, Melanesia, Oceania | 7.56% | 7.42% |
| NC | New Caledonia, Melanesia, Oceania | 2.98% | 2.73% |
| NR | Nauru, Micronesia, Oceania | 1.46% | 1.46% |
| TO | Tonga, Polynesia, Oceania | 1.05% | 0.99% |
| MH | Marshall Islands, Micronesia, Oceania | 0.61% | 0.61% |
| FJ | Fiji, Melanesia, Oceania | 0.34% | 0.34% |
| KI | Kiribati, Micronesia, Oceania | 0.30% | 0.30% |
| GU | Guam, Micronesia, Oceania | 0.20% | 0.19% |
| WF | Wallis and Futuna Islands, Polynesia, Oceania | 0.13% | 0.13% |
| AS | American Samoa, Polynesia, Oceania | 0.09% | 0.09% |
| MP | Northern Mariana Islands, Micronesia, Oceania | 0.06% | 0.05% |
| FM | Micronesia (Federated States of), Micronesia, Oceania | 0.06% | 0.06% |
| WS | Samoa, Polynesia, Oceania | 0.05% | 0.05% |
| VU | Vanuatu, Melanesia, Oceania | 0.04% | 0.04% |
| PW | Palau, Micronesia, Oceania | 0.03% | 0.03% |
| SB | Solomon Islands, Melanesia, Oceania | 0.03% | 0.03% |
| CK | Cook Islands, Polynesia, Oceania | 0.02% | 0.02% |
| NF | Norfolk Island, Australia and New Zealand, Oceania | 0.00% | 0.00% |
| TV | Tuvalu, Polynesia, Oceania | 0.00% | 0.00% |
| NU | Niue, Polynesia, Oceania | 0 | 0 |
However, there have been several interesting highlights in the last couple of years. Papua New Guinea saw a new market entrant in Vodafone (Digitec AS139898), which brought some IPv6 benefits to users in Papua New Guinea. AS139898 has single-handedly brought the economy’s IPv6 usage up from nearly 0% to 6.92% preferred with their own IPv6 preferred hovering around the 30% mark.
For both the network and the economy, this is quite an achievement! Being a greenfield deployment certainly has its advantages.
While we’re in Melanesia, let’s have a look at an interesting case I came across while preparing for a webinar on IPv6 at the end of 2022.
Fiji – USP
I presented on the state of IPv6 in the Pacific region at PacNOG 30 in August last year. The only notable network with a sizeable IPv6 deployment was The University of the South Pacific (USP), headquartered in Suva, Fiji. Their statistics at the time looked quite healthy with around 62% preferred IPv6 traffic.
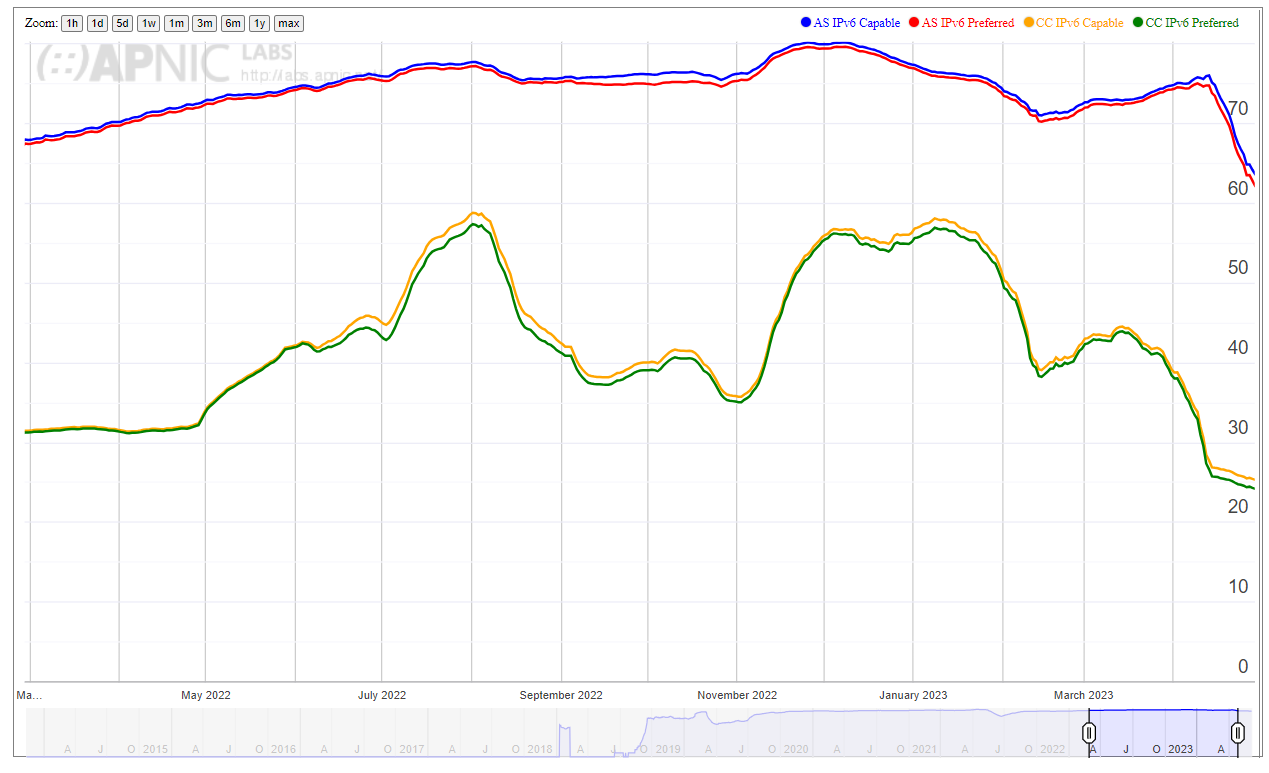
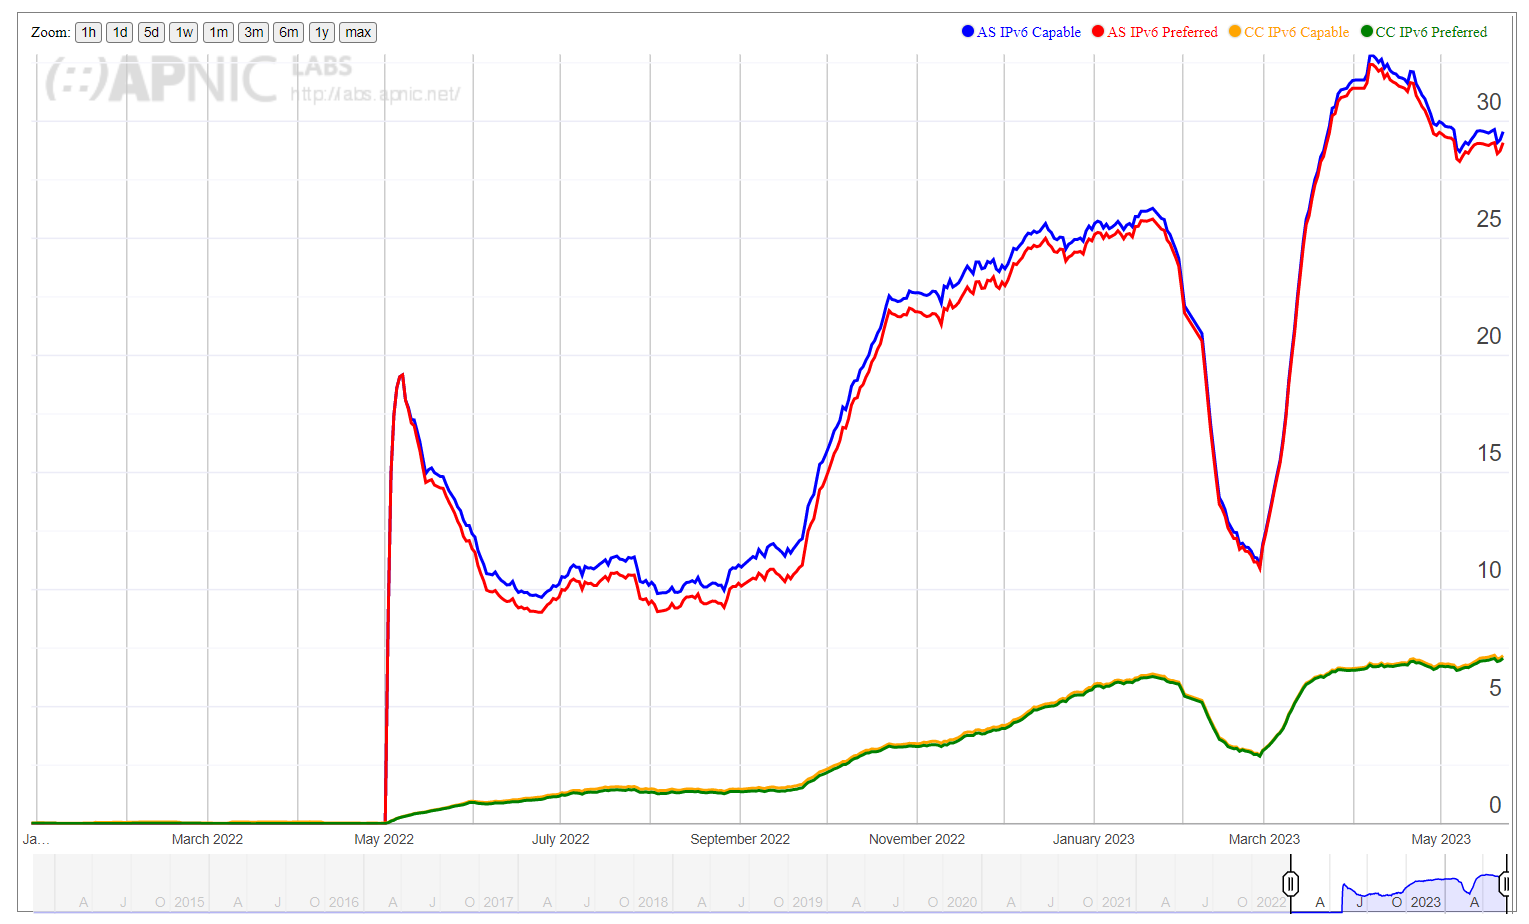
Fast forward to May 2023, and I noticed something strange (Figure 9) with USP’s AS24390.
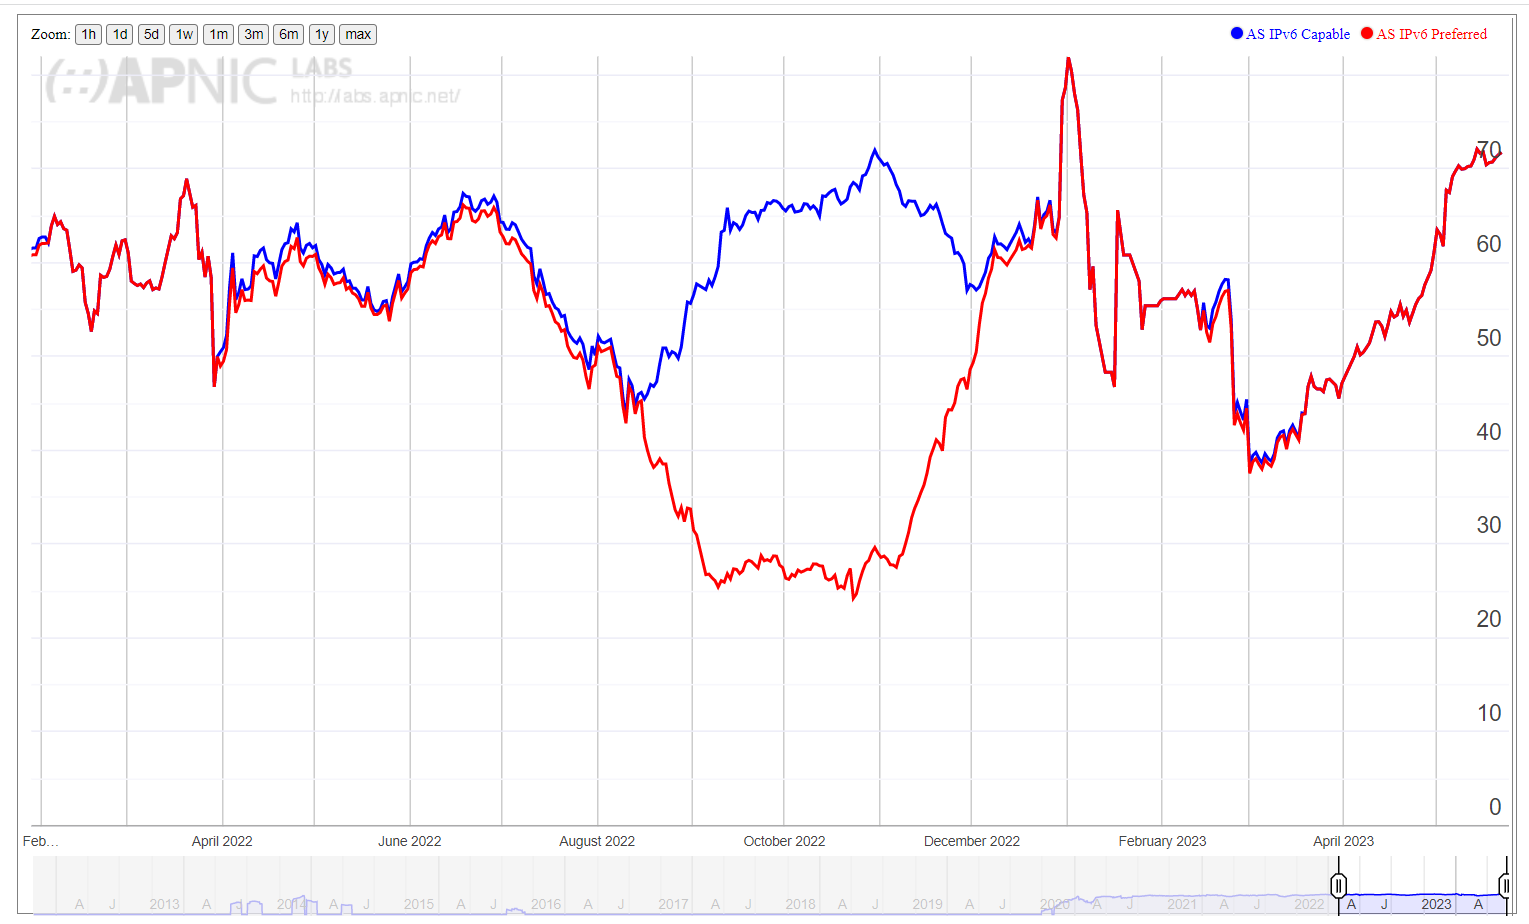
USP’s IPv6 preferred and capable statistics took a drastic departure from each other. This is quite unusual so I reached out to USP and asked if anything had changed in their network. They advised that nothing significant had happened, so I then spoke to the person who collects the data, APNIC’s Chief Scientist Geoff Huston.
Some emails and traceroutes later, it looks as though something had changed from a routing perspective with their upstream provider. I reached out to one of the network people at their upstream, and sure enough, there was a misconfiguration at a Point of Presence (PoP) in Australia that was sending their IPv6 down a non-preferred path and adding over 200ms of latency to the traffic. This is more than enough difference on the paths to break the Happy Eyeballs (RFC 6555) algorithm.
As shown in Figure 9, once their upstream had corrected the routing, USP’s routing appeared ‘normal’ again.
New Zealand
The other oddity I found within the region was while preparing for NZNOG 2023. The graph for Mercury (AS55850) shows a strange pattern (Figure 10).
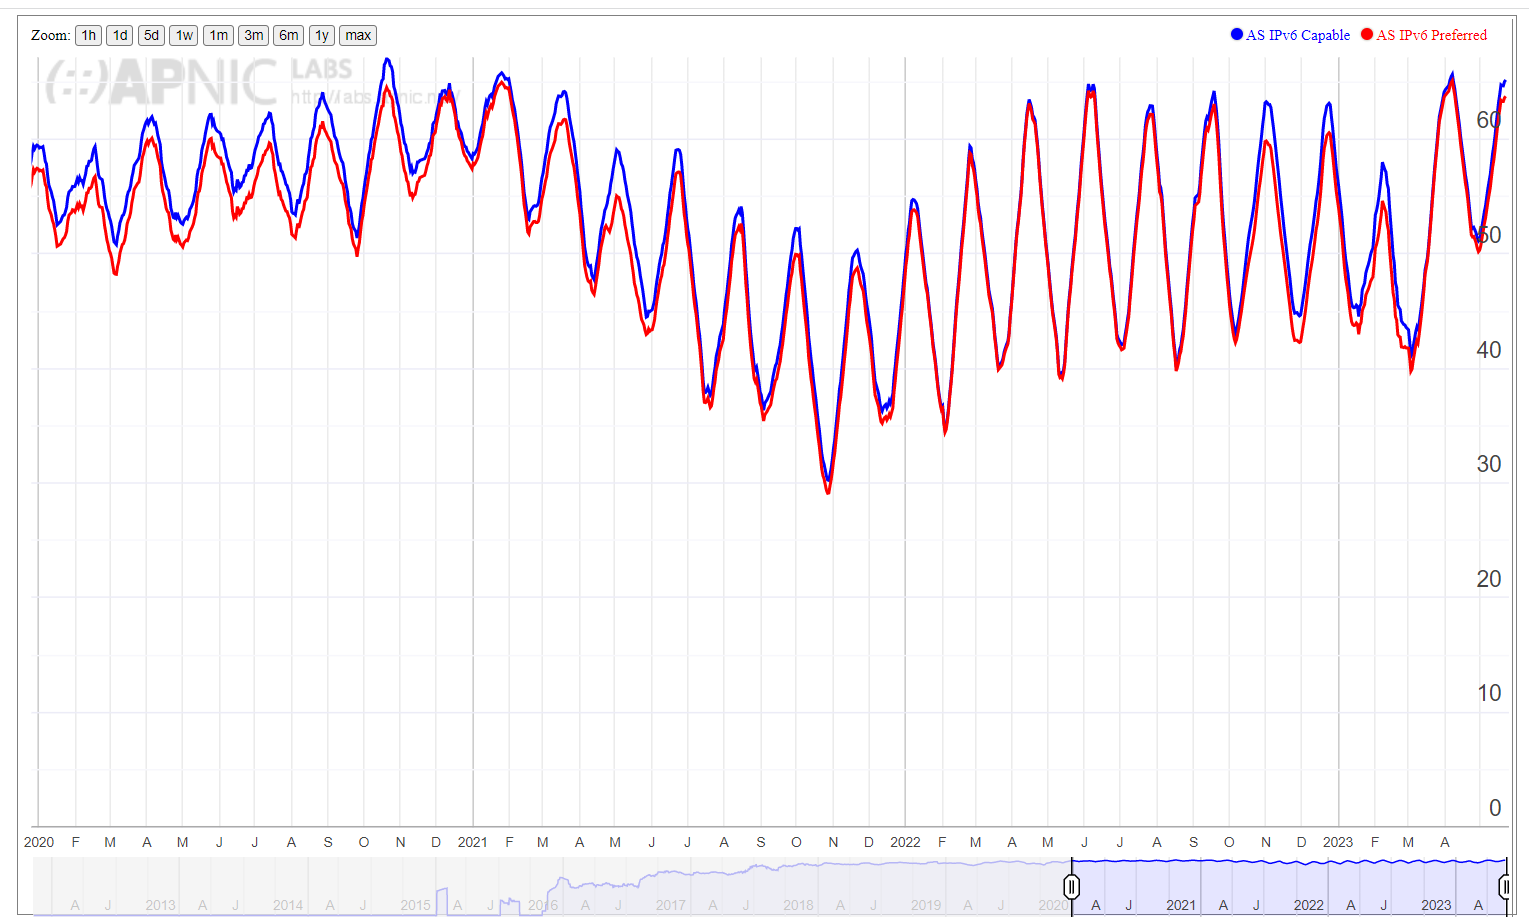
APNIC Labs shows a six-week cyclic variation of around 20% in their IPv6 traffic. The global routing table held no insight into these 20% fluctuations.
In discussions at NZNOG, other carriers noted they’d seen similar problems that could be linked back to Customer Premises Equipment (CPE) that could be deployed in Trustpower’s network (if you’ve seen similar in your network, let us know below in the comments). End users would not notice these fluctuations as Trustpower are dual-stacked, but it was an interesting find, which will hopefully have a resolution soon 😊.
Challenges to IPv6 deployment in the region
There are several perspectives affecting IPv6 deployment in the region.
From a user perspective, if you have mobile and residential users, they generally don’t care about the protocol in use. As long as they can get to their content, website, and other things they care about, then all is fine.
Enterprises (specifically, the admins) are a different story. Most of them are already running Network Address Translation (NAT) and are busy plugging gaps, so IPv6 deployment is low on their ever-growing list of priorities. They also have more to deal with in terms of application compatibility and stacks than the average home user, so getting it right requires planning and education, and usually involves securing a budget to deploy, which can be difficult to justify in a corporate setting.
For service providers, there can be a great deal of additional expense in deploying IPv6, especially for mobile providers, as they will more than likely have additional licence fees associated with their deployment, so many are waiting until their next technology upgrade to 5G.
What about the network operators? Having now run many IPv6 training sessions at APNIC, there can be some misconceptions about the use of IPv6 addressing. Some are still thinking in terms of per-host addressing rather than per-subnet addressing, so a shift in perspective is needed.
Why deploy IPv6?
Put simply, cost and inevitability.
A service provider who needs more IPv4 addresses will be paying somewhere in the order of USD 40-50 per IP address currently on the transfer market — that’s roughly around USD 12k for a /24 delegation. That may well buy some time, but as a finite resource now bound to market forces, it’s not infinitely sustainable for most networks.
Likewise, when stacking more users behind CGNAT appliances, the bigger, better, and generally more expensive those appliances have to be. So, the savings in CGNAT offload for a residential/mobile user base can be significant.
The world is changing. IPv6 has seen a three-fold increase in uptake in the last five years. Content providers are already IPv6 ready, and the hyperscalers are catching up with their IPv6 readiness.
It’s time to stop saying ‘I will do it tomorrow’. Networks aren’t going to get any simpler, so delaying is just making things harder the longer it goes on. Practical assistance is on hand. If you need assistance or a second set of eyeballs (happy or not) to look at your deployment plan or assist with an address plan, APNIC assistance is just a help ticket away or can be requested at the Technical Assistance Platform on the APNIC Academy.


The views expressed by the authors of this blog are their own and do not necessarily reflect the views of APNIC. Please note a Code of Conduct applies to this blog.