

It seems that some things just never die, and this includes DNS queries.
In a five-month experiment, encompassing the detailed analysis of some 44 billion DNS queries, we find that one-quarter of these DNS queries are zombies – queries that have no current user awaiting the response, and instead are echoes of previous queries.
What is causing these zombies? Are we seeing deranged DNS resolvers that maniacally re-query the same questions and never accept the answer? Or is this something slightly more sinister and are we seeing evidence of widespread DNS stalking and shadowing? Let’s find out.
As part of our Internet measurement work, we use a technique of embedding a small set of ‘sentinel blots’ within an online ad. When the ad is delivered to a user’s browser, the script in the ad causes the user’s browser to fetch these blots. To measure IPv6, for example, one blot is accessible in both IPv4 and IPv6, while another blot is only accessible using IPv6. Those systems who can fetch this second blot fall into the category of “IPv6-capable” end systems, and we can extrapolate from the sample measurements to estimate the extent to which IPv6 is deployed across the entire Internet.
Of course, this simple description of the measurement system glosses over a number of subtle aspects of behaviour. It is a requirement of this measurement system that the blot is fetched from one of the measurement servers, and that means that we need to bypass the various DNS and web proxy caches that are widely used in the network. The approach we use is to generate unique DNS names for each instance of the blot, so that every DNS query is a new query and cannot be served from a cache. Equally, every web fetch of the blot is a new URL, so that a proxy cannot intercept the fetch.
When we generate these unique DNS names we include in the synthetic name a time component, which is an encoding of the time that the script in the ad was executed by the user. Each DNS name is used only once, and the script is intended to run to completion immediately. So in a reasonable world, the authoritative DNS server would see one, or perhaps two, queries for each unique DNS name, and the time of the DNS query should be within a few seconds of the time that is encoded in the DNS name. The Time To Live (TTL) of the DNS name is one second, and each unique name is never reused in any other Ad.
The Internet can be truly prodigious! If you look hard enough and for long enough on the Internet you will probably find every form of pathological behaviour that could possibly exist! And with some 24 million unique DNS names being generated each and every day from these measurement experiments, then if there are some strange DNS behaviours out there, it’s likely that we can see them!
1450151673.887 15-Dec-2015 query: z.t1000.u953a6ea5.s1448087430.i5112.vxxxx.06ca0.z.dotnxdomain.net A 1450151673.887 15-Dec-2015 query: z.t1000.uc86fd1d9.s1447672979.i5112.vxxxx.3b460.z.dotnxdomain.net A 1450151673.887 15-Dec-2015 query: z.t1000.ub46e3821.s1447703026.i5112.vxxxx.0c914.z.dotnxdomain.net A 1450151674.013 15-Dec-2015 query: z.t1000.u953a6ea5.s1448087430.i5112.vxxxx.06ca0.z.dotnxdomain.net A 1450151674.015 15-Dec-2015 query: z.t1000.ub46e3821.s1447703026.i5112.vxxxx.0c914.z.dotnxdomain.net A 1450151674.017 15-Dec-2015 query: z.t1000.uc86fd1d9.s1447672979.i5112.vxxxx.3b460.z.dotnxdomain.net A 1450151674.753 15-Dec-2015 query: z.t1000.u953a6ea5.s1448087430.i5112.vxxxx.06ca0.z.dotnxdomain.net A 1450151674.755 15-Dec-2015 query: z.t1000.uc86fd1d9.s1447672979.i5112.vxxxx.3b460.z.dotnxdomain.net A 1450151674.756 15-Dec-2015 query: z.t1000.u953a6ea5.s1448087430.i5112.vxxxx.06ca0.z.dotnxdomain.net A 1450151674.757 15-Dec-2015 query: z.t1000.ub46e3821.s1447703026.i5112.vxxxx.0c914.z.dotnxdomain.net A |
Figure 1 – DNS Query Log Extract
Figure 1 shows an extract from the query log of one of the authoritative DNS servers for this domain. In this log extract, the first column is the time of the query, encoded as the number of seconds since 1 January 1970 UTC, which corresponds in this case to the 15th December 2015, at 03:54:33/03:54:34 UTC. The number in the label starting with ‘s’ is the time the experiment was executed by the user. These times correspond to the time and dates listed in Figure 2.
2015-11-21 06:30:30 2015-11-16 11:22:59 2015-11-16 19:43:46 2015-11-21 06:30:30 2015-11-16 19:43:46 2015-11-16 11:22:59 2015-11-21 06:30:30 2015-11-16 11:22:59 2015-11-21 06:30:30 2015-11-16 19:43:46 |
Figure 2 – DNS Name Creation Times for Queries in Figure 1
What this shows is that each of these queries corresponds to an experiment that was delivered and executed between 20 and 30 days earlier! There is nothing in the measurement exercise itself that could lead to these “echo” queries. These queries are zombie queries. The initial trigger event is long gone, and the query itself is living in some strange afterlife where the single trigger event that kicked the query into life is long gone! One or two of these zombie queries per day is one thing, but the numbers appear to be far higher than that. To try and understand this a little better we can look at the age of these zombie queries for one authoritative name server for a single day. Figure 3 shows the distribution of the age of queries for all DNS zombies for a single day on a single DNS server used in this experiment. In this case, 16%, or one in six of the 18.3 million DNS queries seen at this server were zombies.
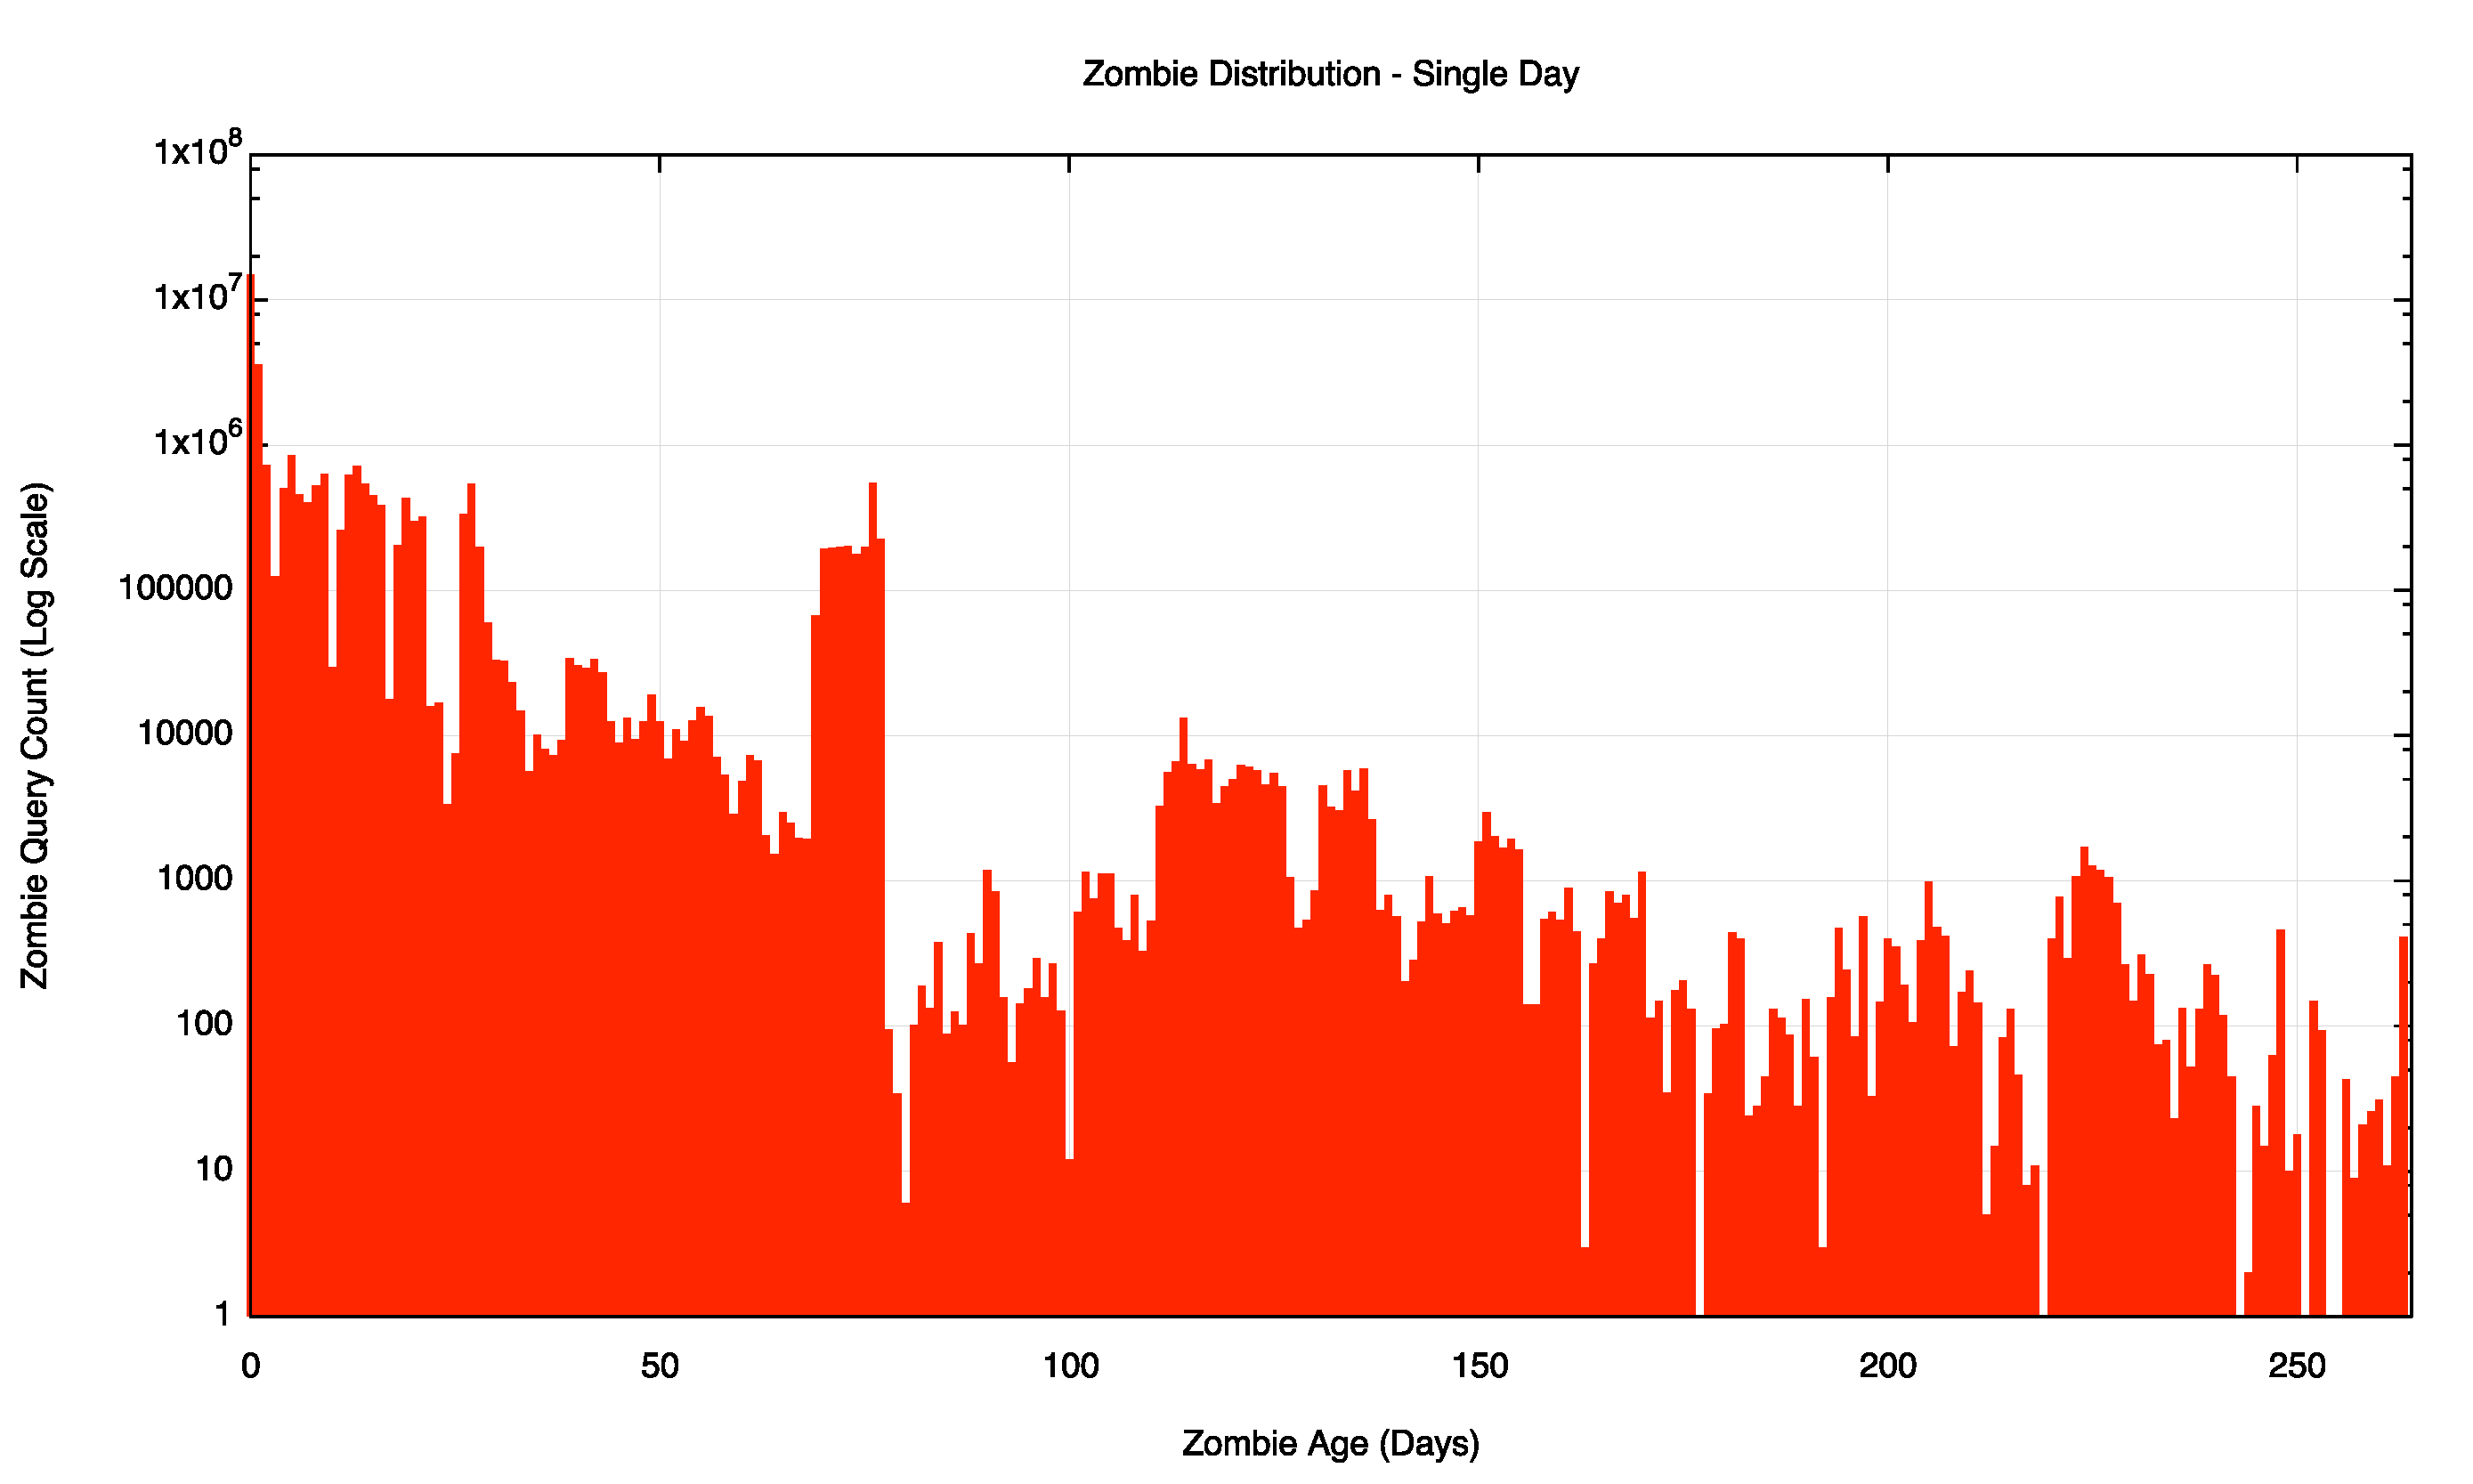
Figure 3 – Zombie Age Distribution
The age distribution of these zombie queries can also be seen in a cumulative distribution plot (Figure 4). One-half of the zombie queries occurs within the first 24 hours after the original query. There is an exponential decline in zombie counts for the first 30 days, then the zombies appear to be very persistent, and the decline over time is far slower for older zombies. The high count at the 60-day point appears to map to a local peak in original DNS queries that occurred some 60 days earlier.
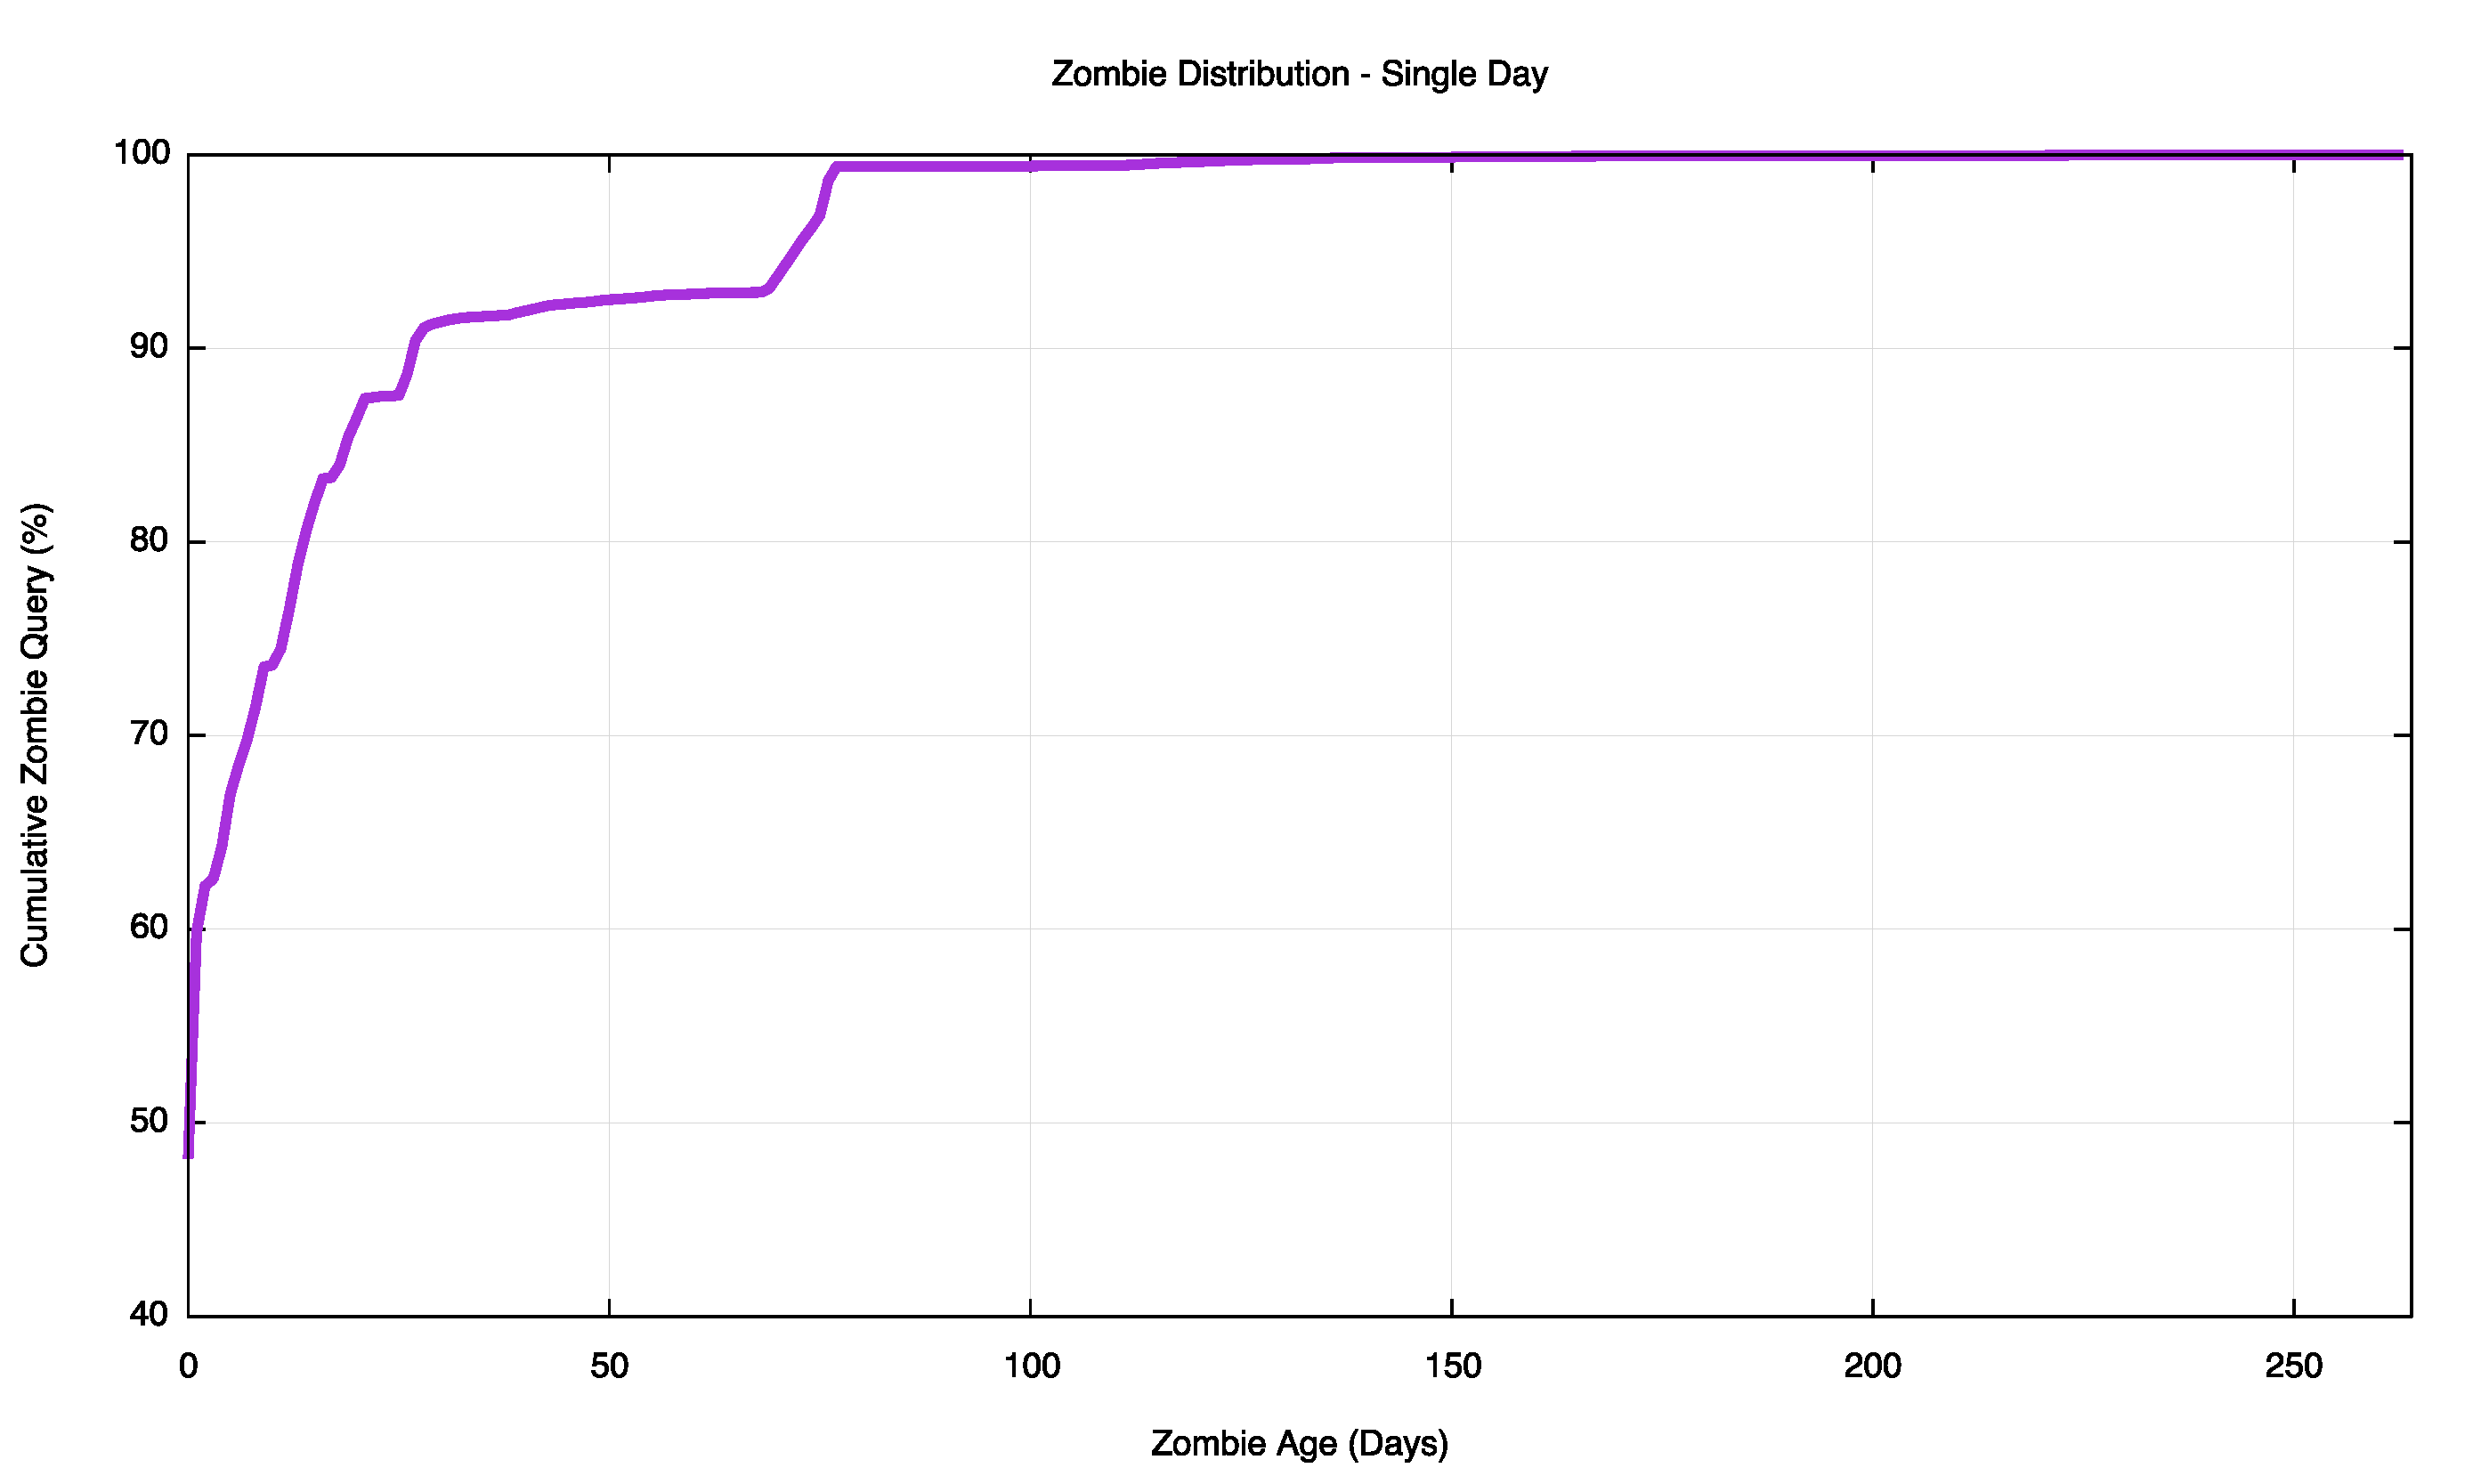
Figure 4 – Zombie Age Cumulative Distribution
It appears that a number of DNS resolvers are performing some form of “just in case” pre-provisioning of the DNS name resolution, and not releasing a name from this cache for some days, even months. What if we broadened our search to look for all zombies over an extended period?
The following two figures show the distribution of the age of these DNS query zombies recorded over a 5½ month period from 1 October 2015 until mid-March 2016. Some 44 billion queries were seen over all the servers (44,733,946,408), of which some 11 billion (11,274,142,797 queries) were zombie queries where the name itself was more than 1 hour “old”. The age profile of this set of zombies is shown in Figure 5, and the cumulative distribution is shown in Figure 6.
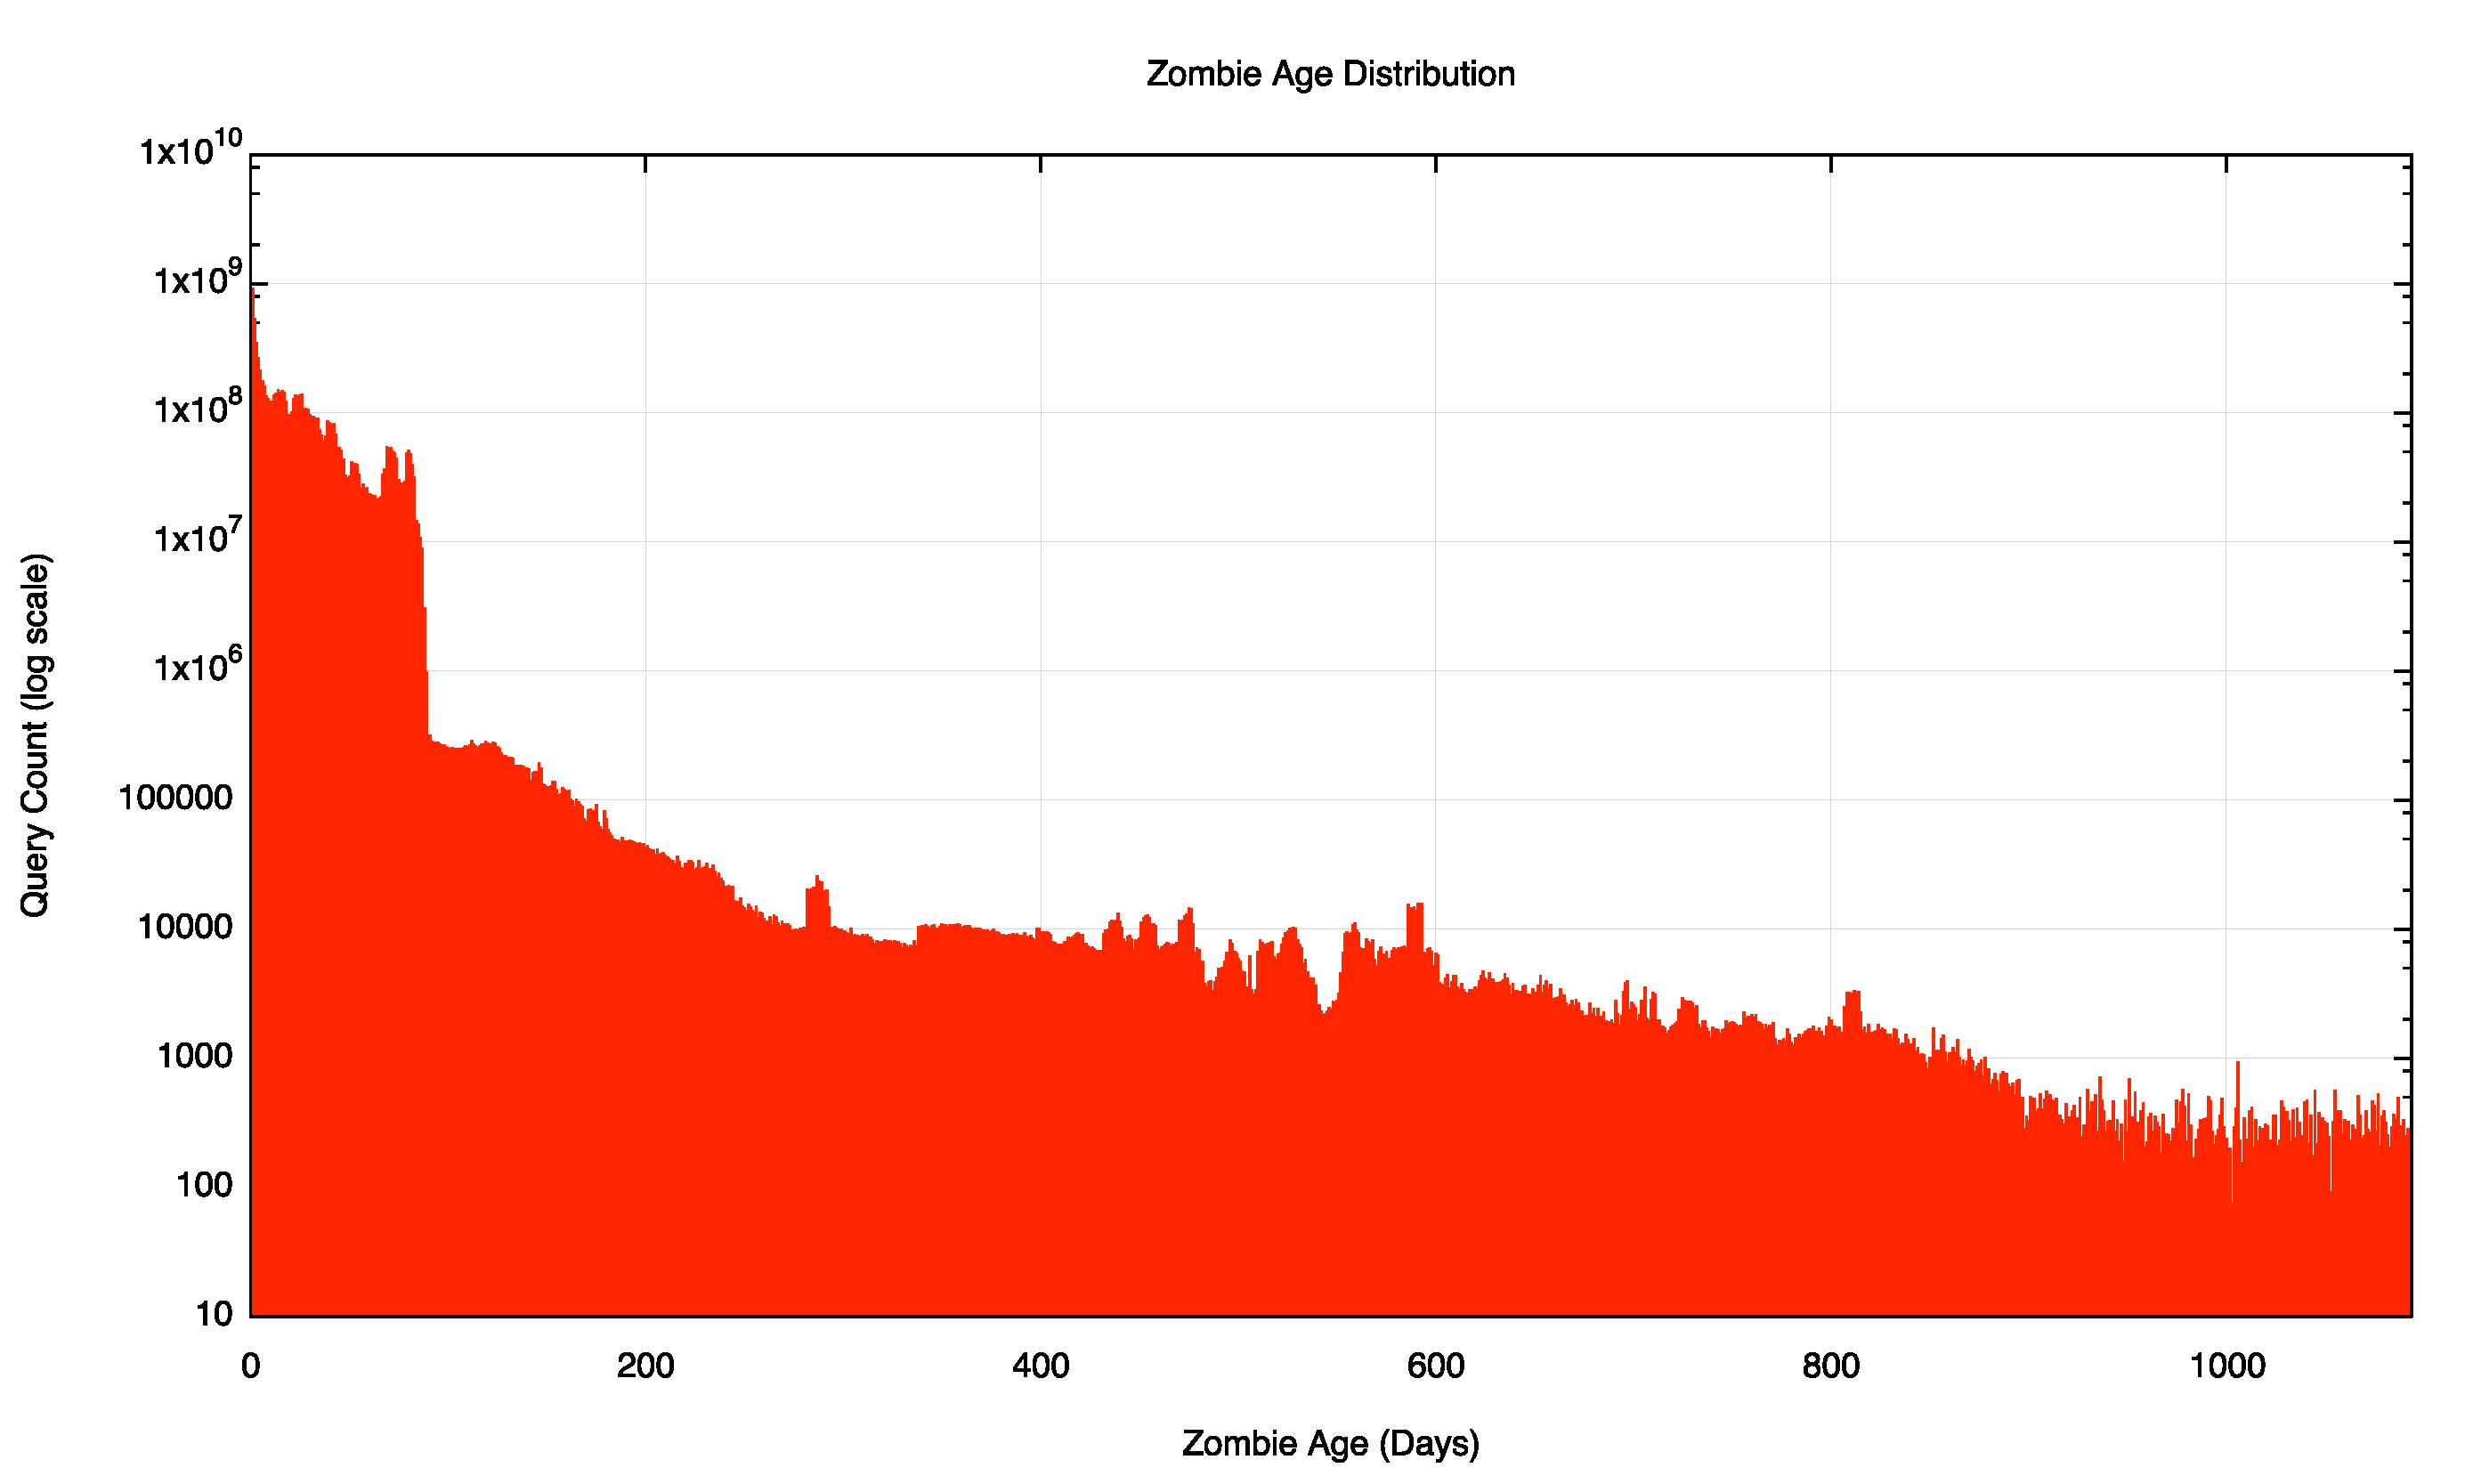
Figure 5 – Zombie Age Distribution – 160-day collection
The cumulative distribution shows that one-quarter of all zombies is between one and 24 hours old. There is a long-lived tail to this distribution, and 1% of all queries are for query names that were created more than 83 days ago. Figure 6 shows that the decline in these long-lived zombies appears to be approximately linear when viewed using a log scale, which suggests some form of an exponential decline of these zombies over time.
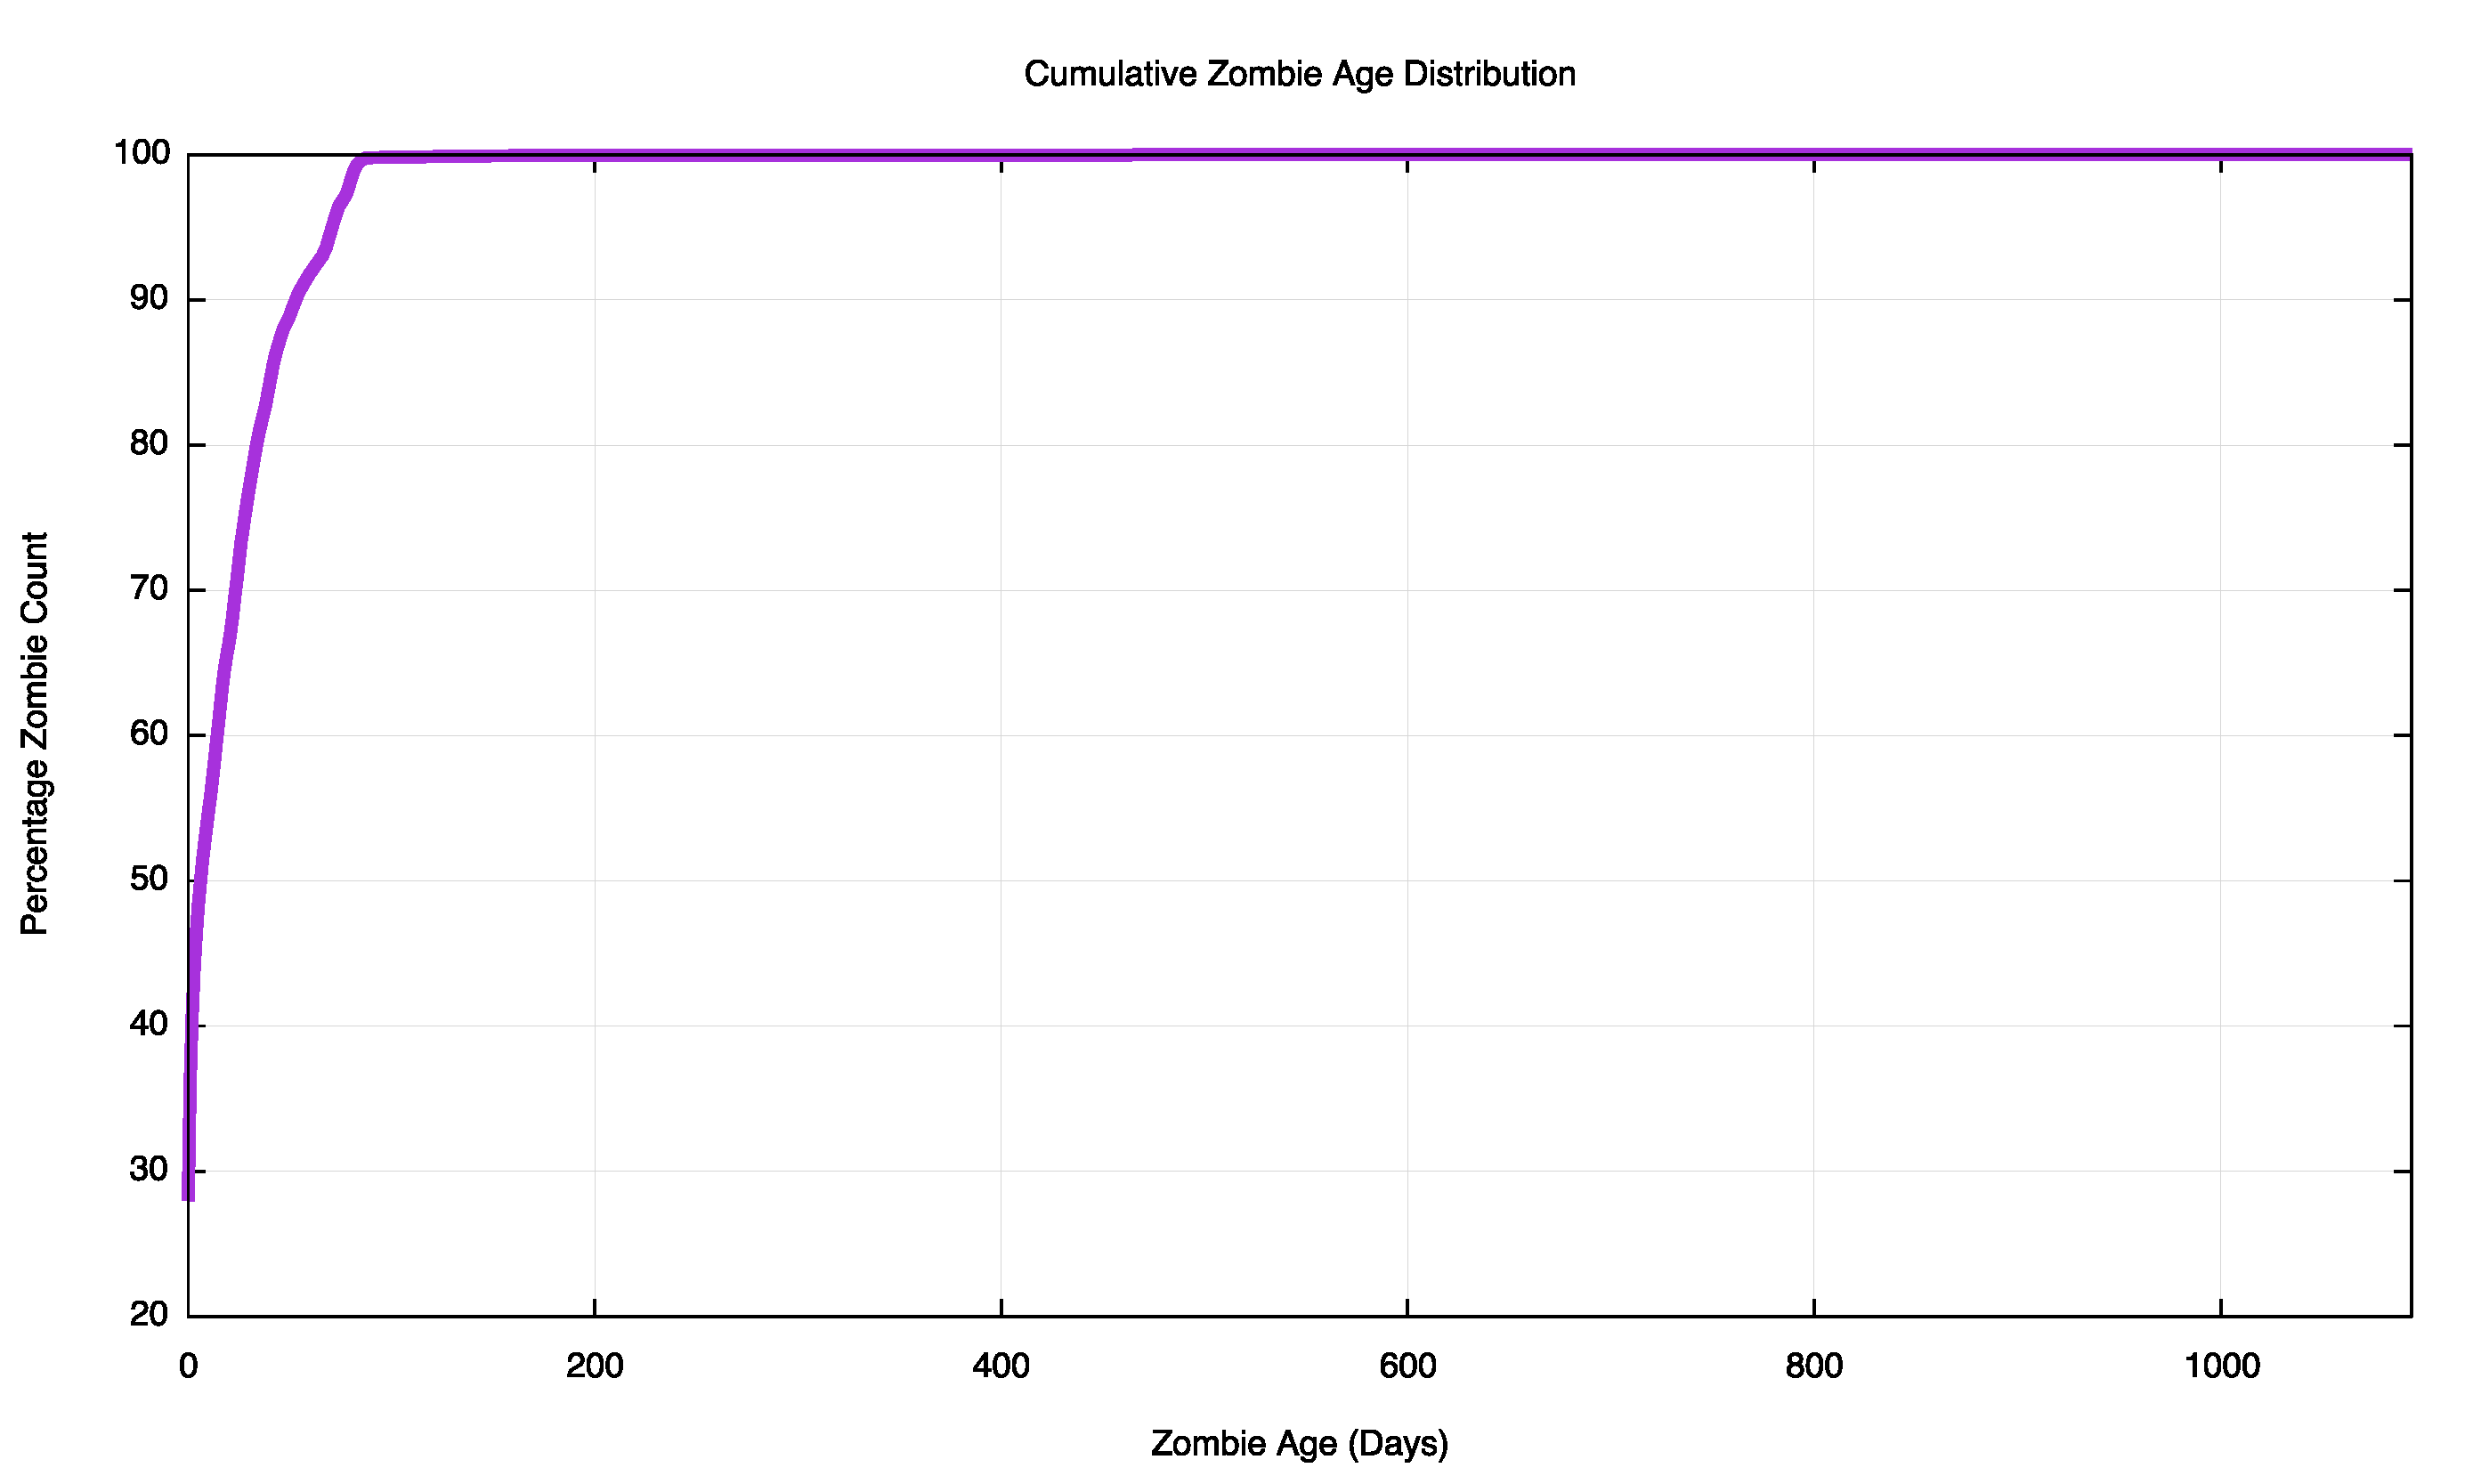
Figure 6 – Cumulative Zombie Age Distribution – 160-day collection
It’s a somewhat surprising outcome that one-quarter of all the DNS queries at these authoritative name servers are zombie queries, where there is no discernable original trigger event.
What could be causing this behaviour? One possible explanation is that this is not DNS cache refreshing at all, but web cache refreshing, coupled with a form of web caching that entails checking the validity of the embedded URLs within the page, and this would cause these zombie queries.
Do web zombies exist? And is there any correlation between the web zombie fetch distribution and the DNS zombie query distribution? Over the same period, the web servers associated with this experiment recorded 9,005,437,917 web fetches, or which just 7,055,965 appear to be aged more than one hour. So 0.08% of the web queries are zombies, and this is far lower than the 24.41% zombie rate seen in the DNS query logs.
The cumulative distribution of the age of these zombies is also quite different. As shown in Figure 7, most of the DNS query zombies are less than 100 days old, while some 6% of the zombie web queries are greater than 100 days old.

Figure 7 – Cumulative Zombie Age Distribution – Web vs DNS
It appears that there is no real correlation here, and the DNS zombie query rate is largely independent of the far smaller web zombie query rate.
It seems that we are left with the DNS resolvers themselves being the cause of this zombie query pattern. The next question is the nature of the zombie activity. Is this the result of a small number of unique queries with a very large query rate, or a much larger number of unique queries that are queried at a far lower rate of around once per day or similar. The distribution of repeat queries is a ‘heavy tail’ distribution with a high number of zombie queries occurring between 1 and 12 times per day.
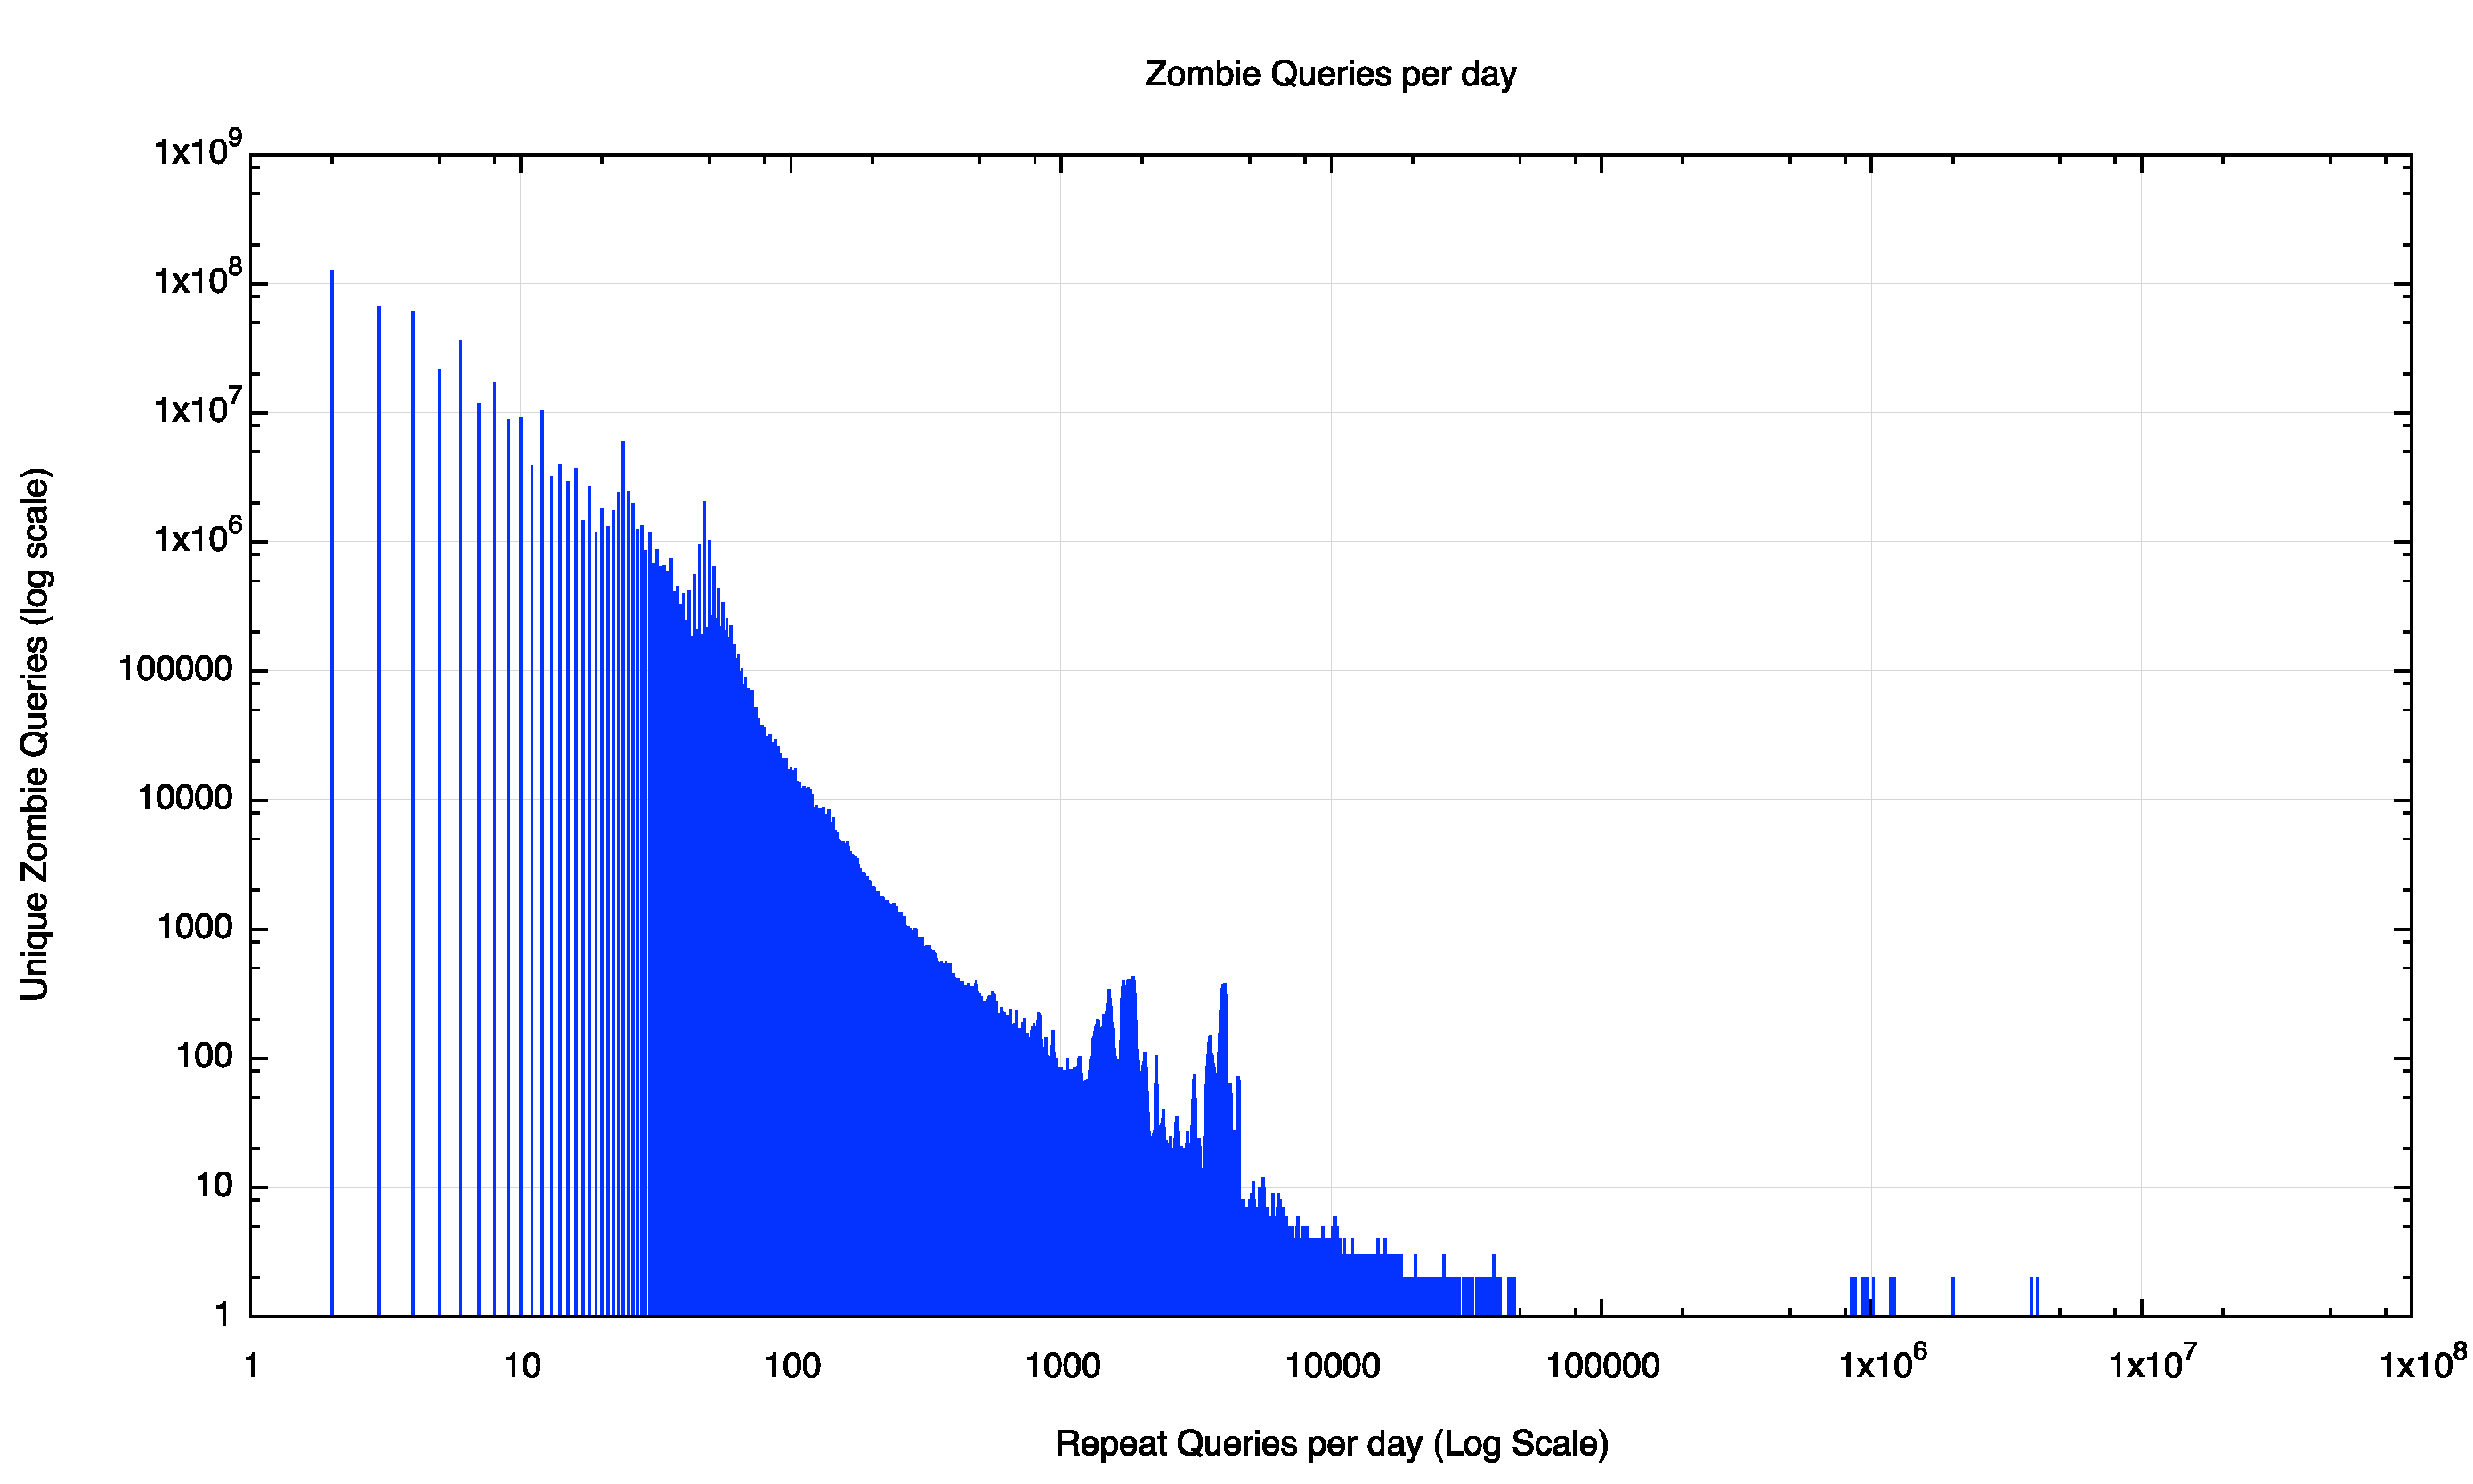
Figure 8: Queries per unique Query Name per day
Of the 59 million unique zombie query names, one-quarter of these names are queried once per day or less, and 9/10 of these names are queried 12 times per day or less. Most of these queries appear to be some form local cache refreshing within a local refresh timer setting between 2 and 24 hours. However, some 16 query names were queried in excess of 10 million times in a day!
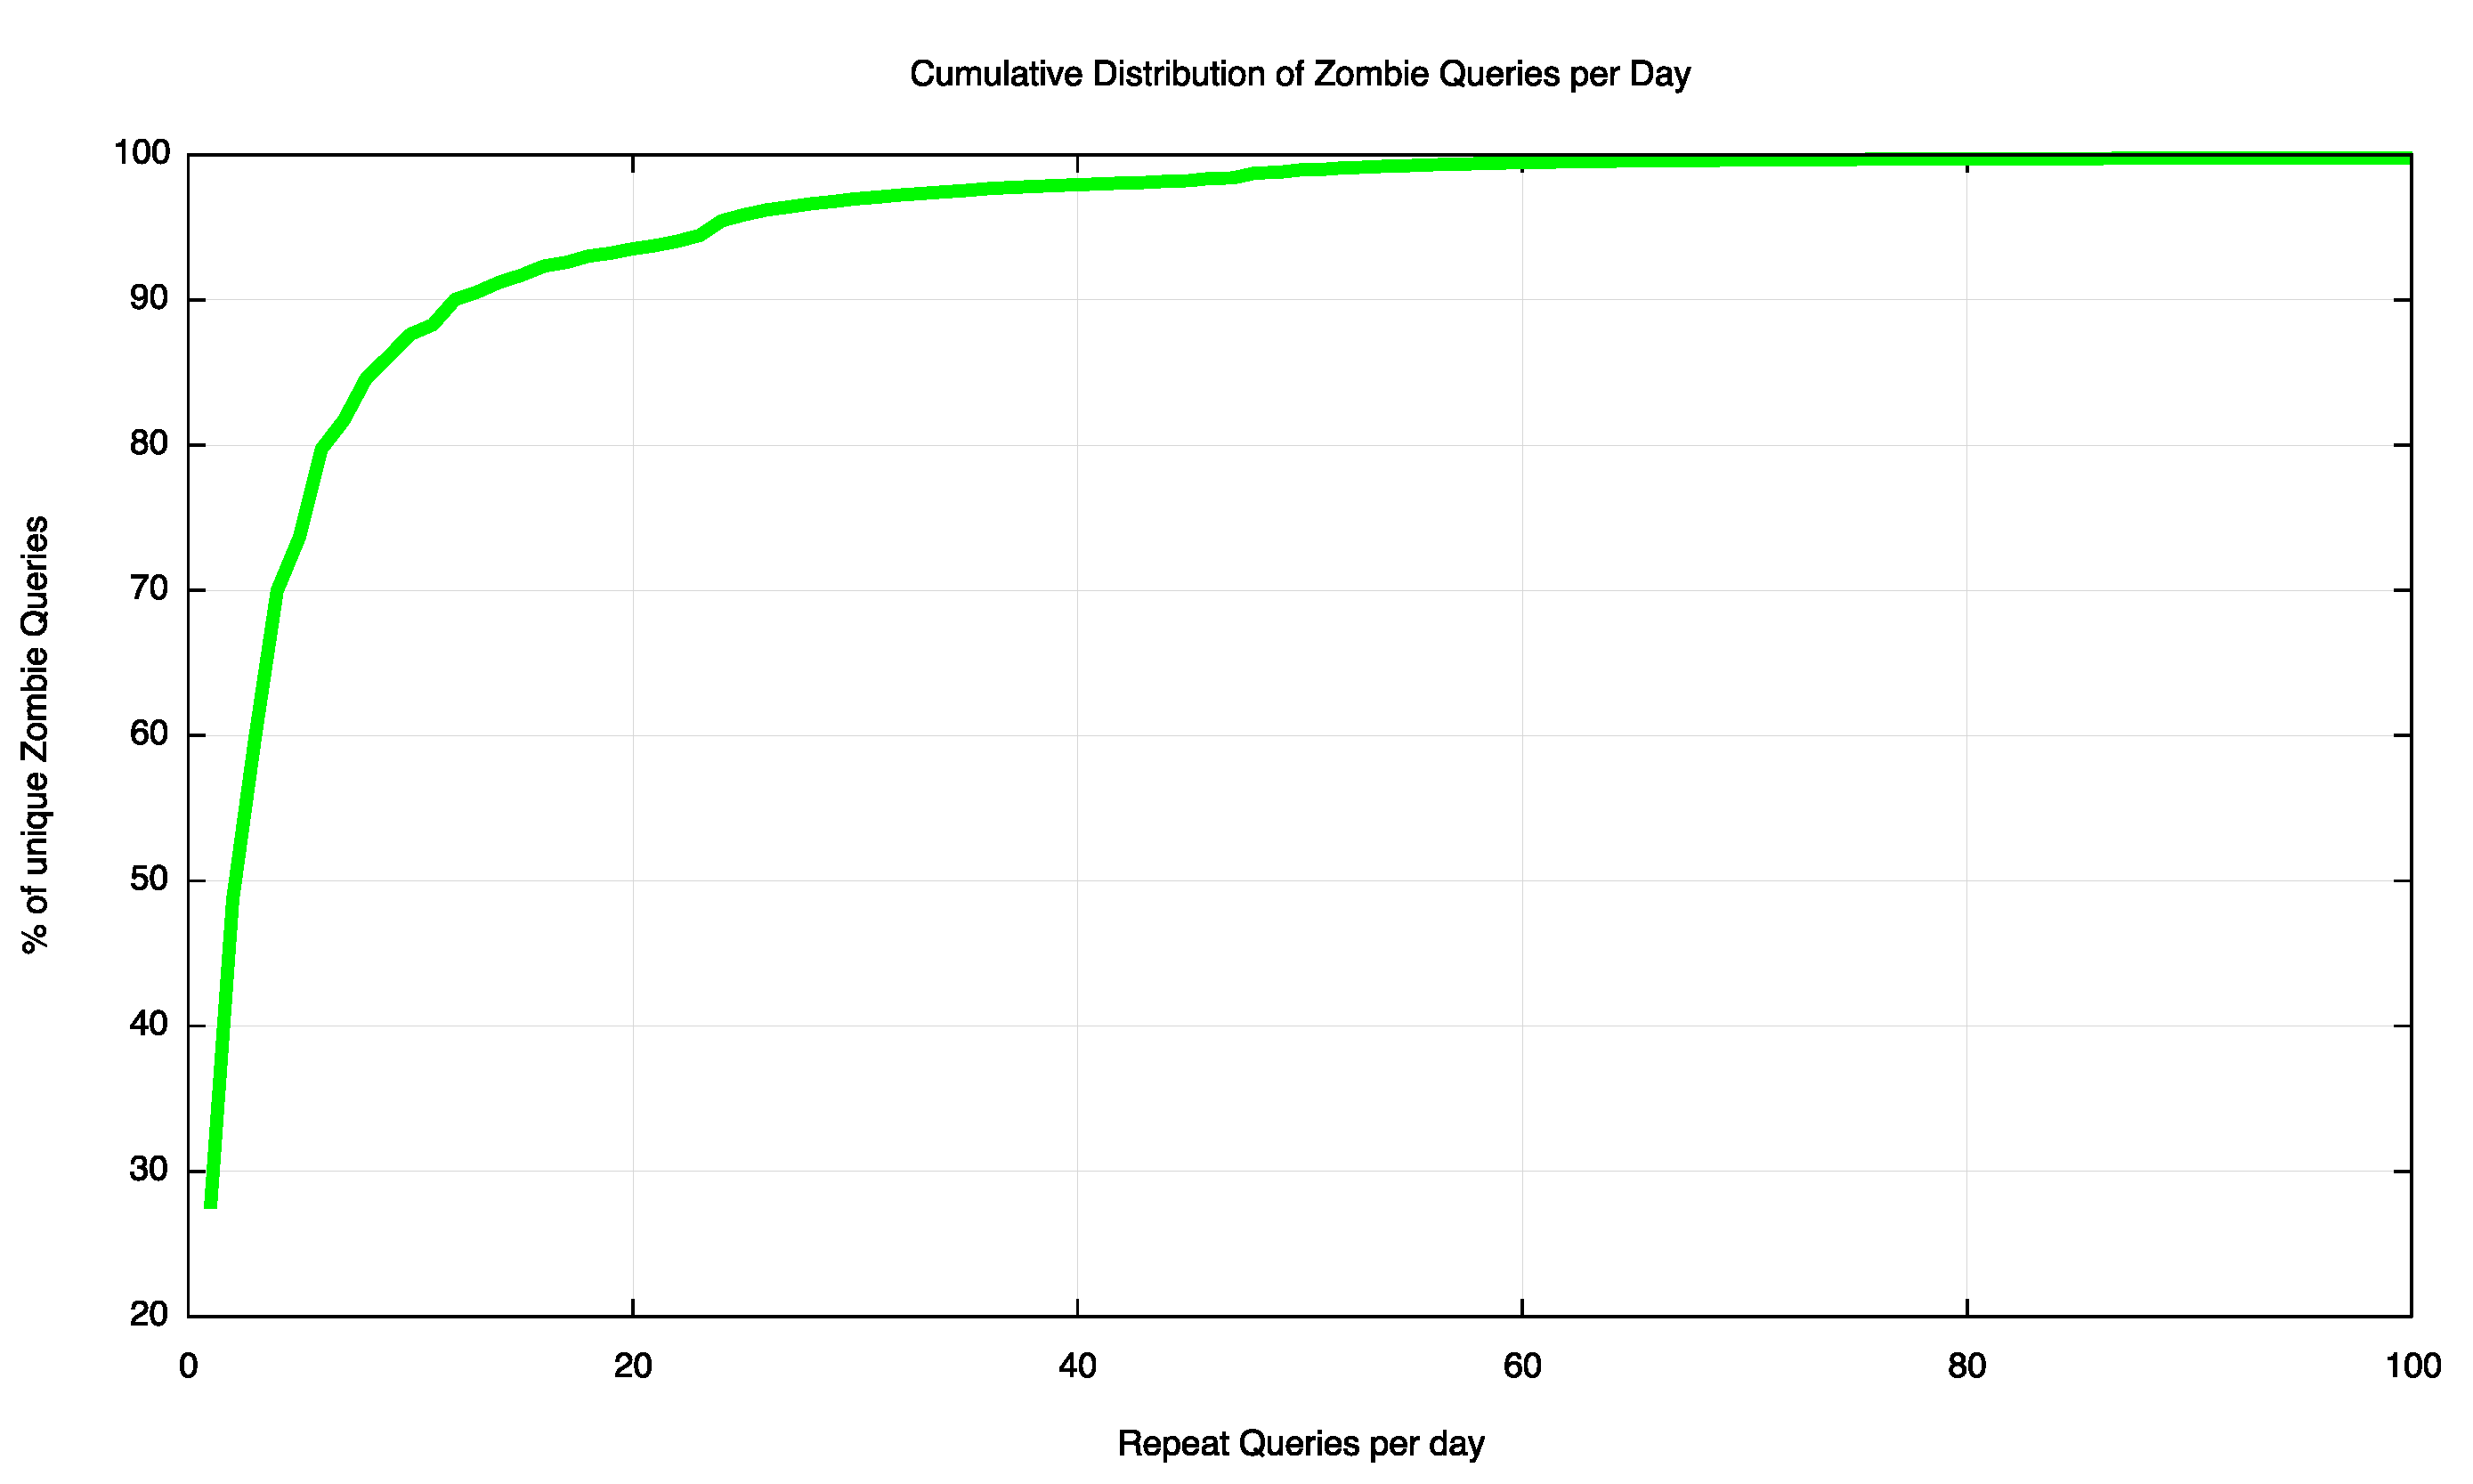
Figure 9: Cumulative Distribution of unique Query Names per day
What is the nature of this zombie query load? To what extent is this load due to a large number of query names being held in DNS resolver caches being periodically refreshed at daily or hourly cycles? Or is this dominated by a small number of resolvers that appear to have wedged themselves into a maniacal query loop and performing queries for the same name at a sustained query rate in excess of 100 queries per second?
The distribution of zombies according to the repeat frequency per day is shown in Figure 10.
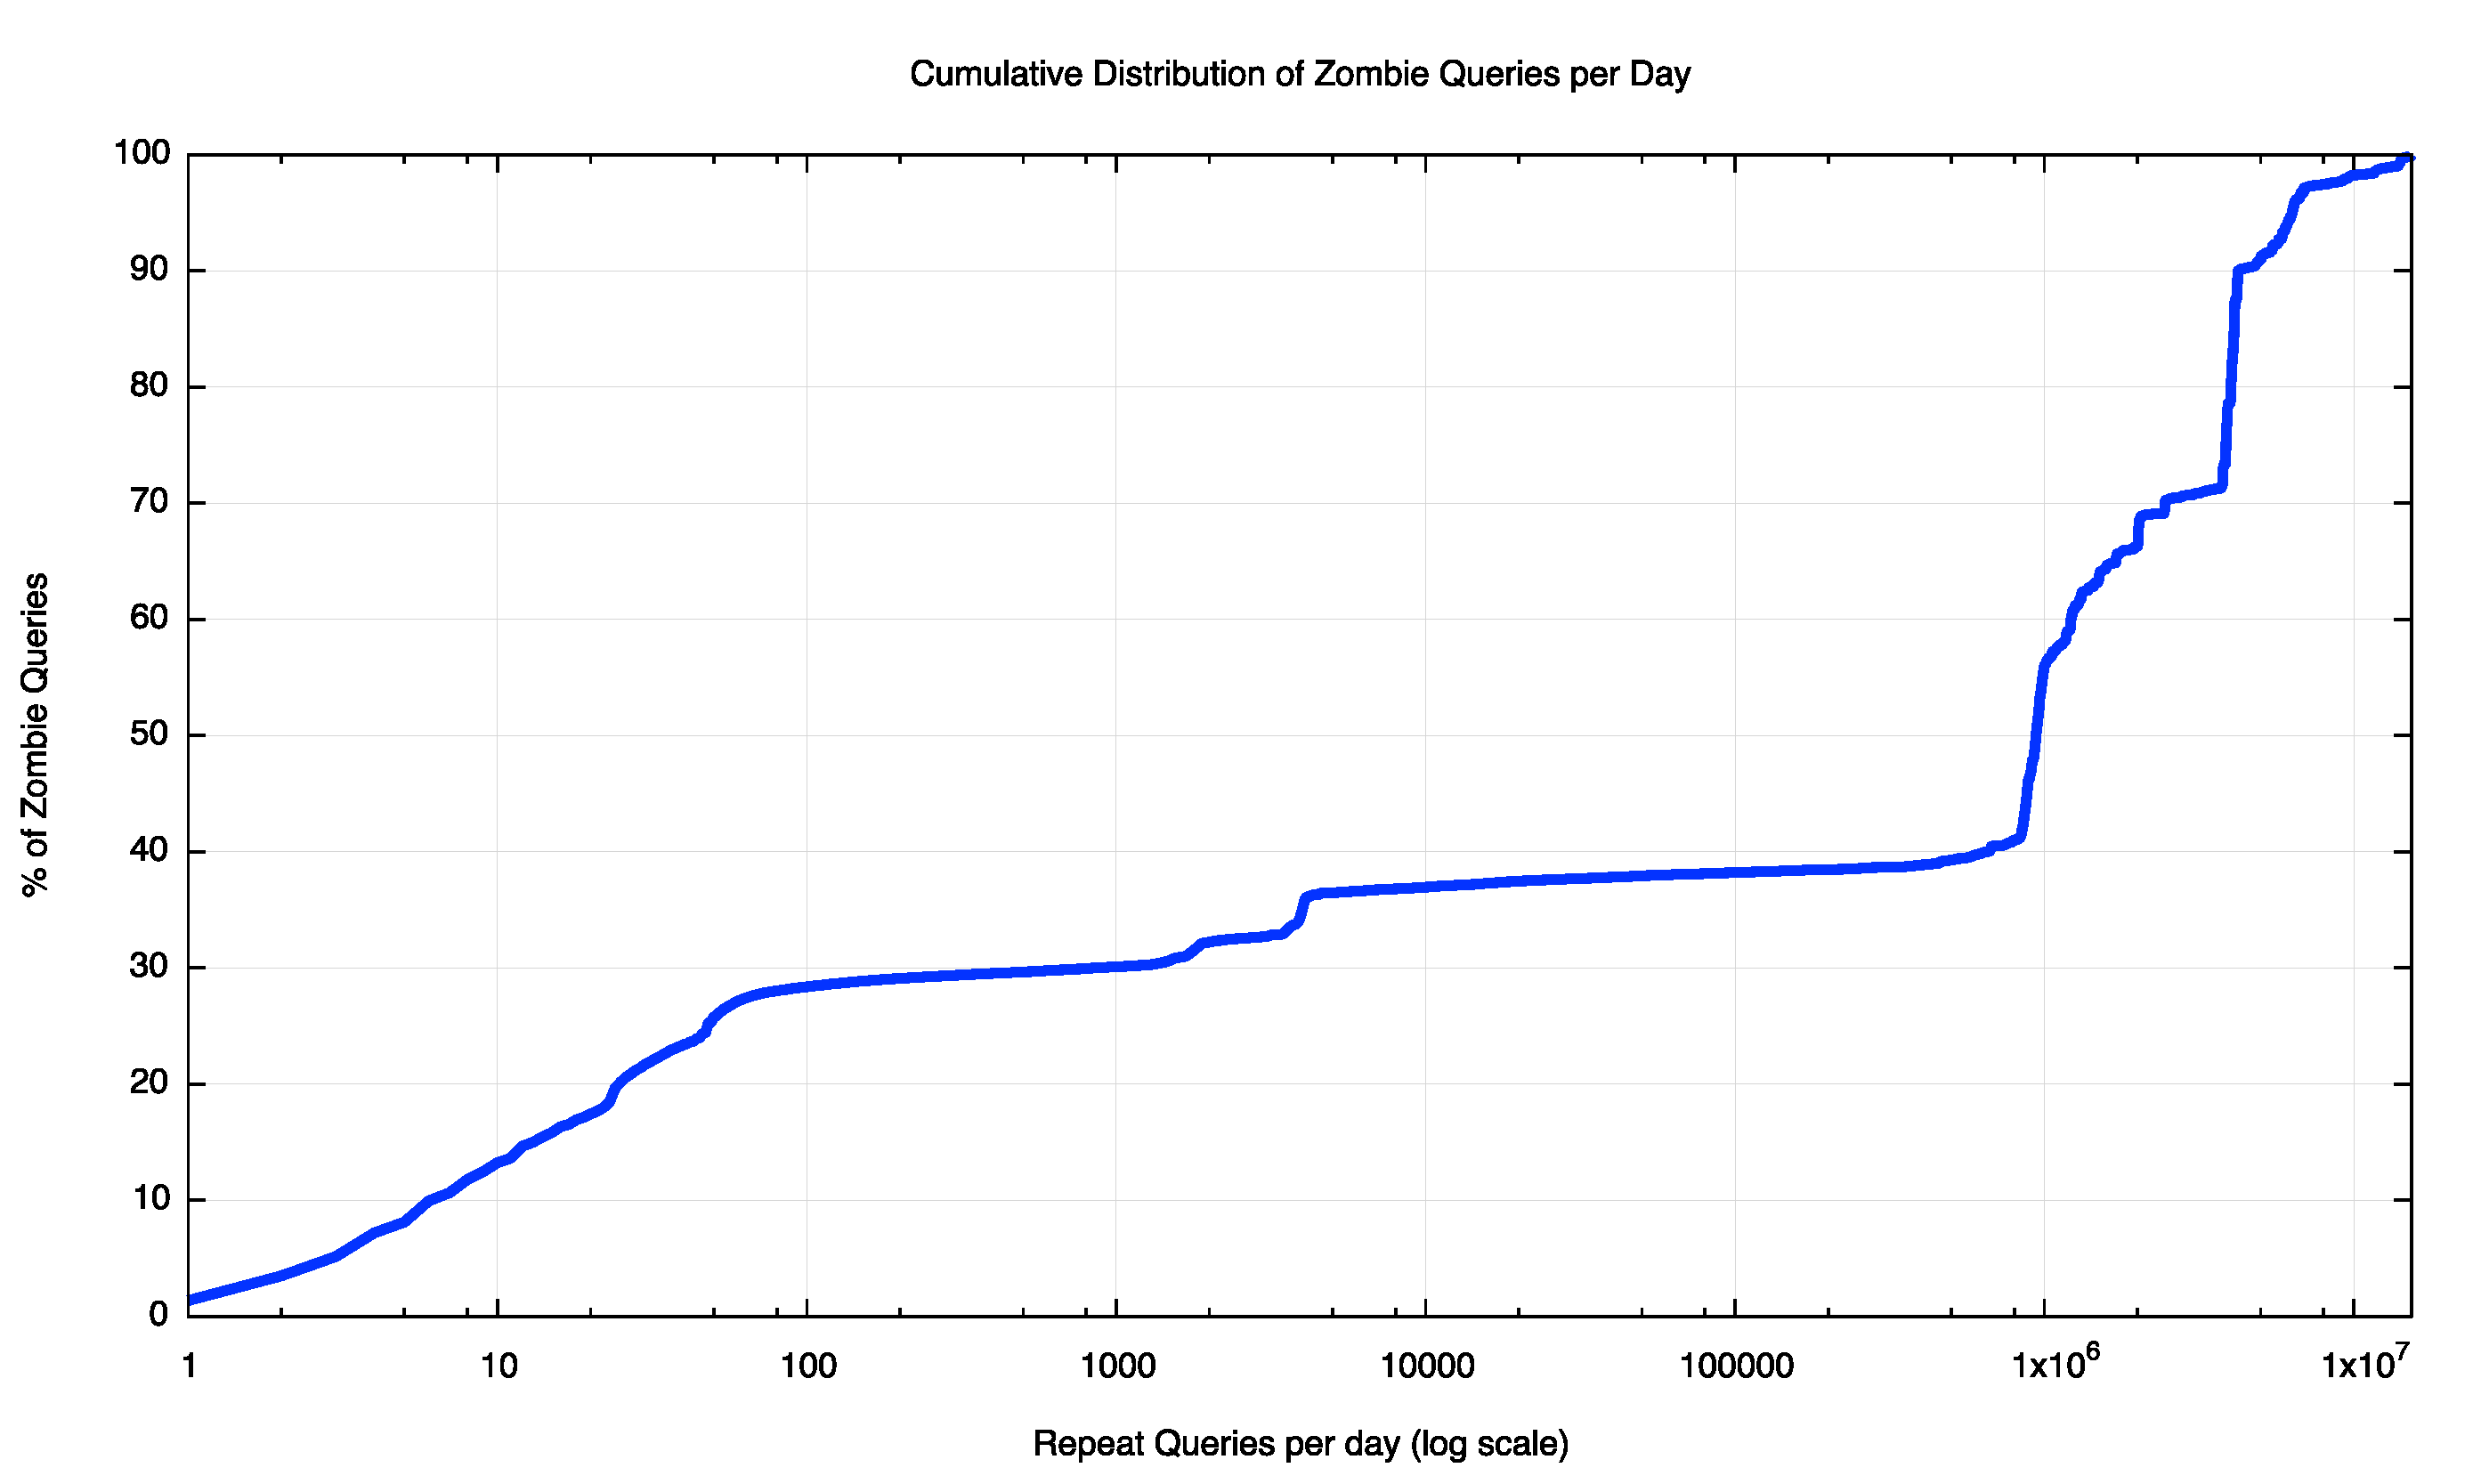
Figure 10: Cumulative Distribution of Zombie Queries per day
What we can see from this figure is that some 30% of the zombie queries are from resolvers that query for the same query name less than 30 times per day. So a little under one-third of the zombie queries are from resolvers using a local cache refresh timer of the order of hours to maintain their local cache. However, some 60% of the zombie queries are from query strings that are queried around 1 million times (or more) per day. This very high query rate suggests that these queries are originating from resolver behaviours that are broken in some manner, and these resolvers have been pushed into some form of pathological high-speed query loop.
This data points to the observation that there are a set of resolvers that appear to be misbehaving by emitting a duplicate query stream at high volume while there are a second set of resolvers that appear to be shadowing original DNS queries.
Let’s look at this data set by counting, for each visible DNS resolver, the number of queries made for DNS names that are “current” the number of queries that are “zombie” queries, where the timestamp in the DNS name is older than one hour.
The first list is those resolvers that made the highest zombie query count from the 1.2 million resolver IP addresses gathered in this exercise. The table shows the IP address of the DNS resolver that made the query to the authoritative name server, the count of “current” queries, the count of zombie queries, the ratio between the two and the network and country where the DNS resolver is located (Table 1).
| Resolver | Current | Zombie | Ratio | ASN | CC | AS Name |
| 186.151.28.130 | 3,978,931 | 4,610,444,812 | 1,158 | 14754 | GT | Telgua, Guatemala |
| 87.236.233.178 | 14,124,423 | 1,006,797,893 | 71 | 35656 | JO | JUNET Jordanian Universities, Jordan |
| 74.205.176.249 | 9,868,204 | 870,945,137 | 88 | 53618 | CA | ADITY-OSH – Aditya Birla Minacs, Canada |
| 204.184.141.253 | 35,034,545 | 594,314,499 | 16 | 2572 | US | Missouri Research and Edu., United States |
| 38.229.33.65 | 7 | 573,038,416 | 81,862,630 | 23028 | US | Team Cymru Inc. United States |
| 80.246.0.3 | 1,486,712 | 379,724,419 | 255 | 21391 | DZ | TDA-AS,DZ Algeria |
| 80.246.0.2 | 2,041,670 | 373,155,047 | 182 | 21391 | DZ | TDA-AS,DZ Algeria |
| 87.236.232.5 | 5,697,987 | 255,364,280 | 44 | 35656 | JO | JUNET Jordanian Universities, Jordan |
| 74.205.162.254 | 1,975,978 | 200,821,246 | 101 | 14214 | CA | MINACS – Minacs Inc, Canada |
| 38.229.33.67 | 11 | 128,929,881 | 11,720,898 | 23028 | US | Team Cymru Inc, United States |
| 38.229.33.68 | 2 | 109,905,028 | 54,952,514 | 23028 | US | Team Cymru Inc, United States |
| 38.229.33.100 | 3 | 90,637,788 | 30,212,596 | 23028 | US | Team Cymru Inc, United States |
| 38.229.33.99 | 3 | 67,436,258 | 22,478,752 | 23028 | US | Team Cymru Inc, United States |
| 200.195.185.205 | 93,986 | 39,623,754 | 421 | 14868 | BR | COPEL Telecom S.A. Brazil |
| 167.102.229.10 | 1,632,910 | 17,868,074 | 10 | 27026 | US | Network Maryland, US United States |
| 54.183.221.9 | 13 | 17,637,567 | 1,356,735 | 16509 | US | AMAZON-02 – Amazon.com, United States |
| 54.183.144.165 | 59 | 17,331,749 | 293,758 | 16509 | US | AMAZON-02 – Amazon.com, United States |
| 192.235.48.69 | 3,259,591 | 12,759,627 | 4 | 14813 | BB | Columbus Telecommunications, Barbados |
Figure 11 – Resolvers with the highest zombie query count
There are two distinct behaviours visible here.
One is “wedged” resolvers that appear to be making the same query over and over again. For example, the first line shows that a resolver located in Guatemala (186.151.28.130) generates on average 1,158 zombie queries for each current query, and over the entire period generated some 4.6 billion zombie queries. Clearly there is some intense query loop going on here, and these 4.6 billion zombie queries coming from this single resolver is a perverse form of highest achievement in today’s Internet. It’s likely that this resolver is wedged in some strange looping state. A similar picture exists for the two resolvers in the Jordanian Universities Network where there the 1 billion and 250 million zombie queries from each of two resolvers located in that network. Also notable are the DNS resolvers in Minacs in Canada, Missouri Research and Education in the US, Copel in Brazil, and to a lesser extent Columbus Telecommunications in Barbados. It’s likely that these resolvers are in some strange form of query loop status and they probably need some intervention to calm them down.
The second form of behaviour is shown in this list by those resolvers that make a massive number of zombie queries, but few, if any, current queries. These resolvers are operated by Team Cymru and Amazon.
Let’s look at each of these behaviours in slightly more detail.
We can provide a little more detail at the apparently broken resolvers by looking at the number of unique current queries made by each resolver and the number of subsequent repeat queries, and do the same for the zombie queries (Table 4).
| Resolver | Current | Zombie | Zombie | ASN | CC | AS Name | ||
| Uniques | Repeats | Uniques | Repeats | Repeat Ratio | ||||
| 74.205.176.249 | 3,238 | 10,501,108 | 724 | 876,780,601 | 1,211,023 | 53618 | CA | Aditya Birla Minacs Worldwide, Canada |
| 204.184.141.253 | 2,495 | 35,034,545 | 572 | 600,739,995 | 1,050,244 | 2572 | US | MOREnet, United States |
| 186.151.28.130 | 926 | 3,978,931 | 6,462 | 4,704,634,886 | 728,046 | 14754 | GT | Telgua, Guatemala |
| 74.205.162.254 | 345 | 2,167,441 | 411 | 202,079,128 | 491,676 | 14214 | CA | MINACS – Minacs, Canada |
| 87.236.233.178 | 8,201 | 14,435,262 | 3,094 | 1,019,572,525 | 329,532 | 35656 | JO | JUNET Jordanian Universities, Jordan |
| 209.173.47.77 | 136 | 495,700 | 11 | 3,338,108 | 303,464 | 18474 | US | Aeneas Internet Services, United States |
| 115.249.45.34 | 37 | 265,058 | 12 | 3,154,574 | 262,881 | 18101 | IN | Reliance Communications, India |
| 200.195.185.205 | 74 | 93,986 | 218 | 40,534,251 | 185,936 | 14868 | BR | COPEL Telecom, Brazil |
| 195.53.128.4 | 215 | 70,442 | 1 | 138,326 | 138,326 | 31418 | ES | SOGECABLE, Spain |
| 50.203.18.22 | 223 | 1,946,242 | 6 | 668,671 | 111,445 | 7922 | US | Comcast, United States |
| 197.215.152.195 | 13,830 | 37,012,512 | 1,408 | 142,438,304 | 101,163 | 37558 | LY | LITC, Libya |
| 201.94.158.33 | 98 | 347,644 | 17 | 1,522,810 | 89,577 | 28625 | BR | Terremark do Brasil, Brazil |
| 38.95.167.66 | 75 | 242,166 | 6 | 436,269 | 72,711 | 174 | US | Cogent Communications, United States |
| 46.174.164.4 | 93 | 785,915 | 6 | 435,973 | 72,662 | 39742 | UA | ITM IT-MARK, Ukraine |
| 167.102.229.7 | 612 | 99,122 | 58 | 3,729,929 | 64,309 | 27026 | US | NETWORKMARYLAND, United States |
| 87.236.232.5 | 54,998 | 5,819,430 | 5,634 | 258,275,972 | 45,842 | 35656 | JO | JUNET Jordanian Universities, Jordan |
| 217.108.239.47 | 12 | 55,886 | 39 | 1,731,390 | 44,394 | 3215 | FR | AS3215 Orange, France |
| 217.108.239.58 | 68 | 57,215 | 39 | 1,727,063 | 44,283 | 3215 | FR | AS3215 Orange, France |
| 167.102.229.10 | 6,823 | 1,634,688 | 505 | 19,286,366 | 38,190 | 27026 | US | NETWORKMARYLAND, United States |
| 67.51.123.126 | 57 | 239,777 | 5 | 150,976 | 30,195 | 7385 | US | Integra Telecom, United States |
| 89.207.162.2 | 670 | 16,443 | 1 | 28,921 | 28,921 | 41383 | GB | WOLASN Wolseley, United Kingdom |
| 187.7.128.5 | 0 | 0 | 18 | 444,244 | 24,680 | 8167 | BR | Brasil Telecom, Brazil |
| 41.63.166.180 | 14 | 4,696 | 4 | 94,524 | 23,631 | 36907 | AO | TVCaboAngola, Angola |
| 216.195.101.101 | 189 | 358,403 | 9 | 201,797 | 22,421 | 33481 | US | BELWAVE COMMUNICATIONS, United States |
| 212.118.102.114 | 94 | 223,292 | 3 | 66,067 | 22,022 | 34397 | SA | Cyberia Riyadh, Saudi Arabia |
| 200.111.157.10 | 41 | 53,333 | 183 | 3,690,776 | 20,168 | 6471 | CL | ENTEL, Chile |
| 12.13.190.116 | 14 | 1,890 | 8 | 137,972 | 17,246 | 7018 | US | ATT-INTERNET4, United States |
| 98.142.39.194 | 19 | 484,707 | 2 | 30,221 | 15,110 | 25899 | US | LS Networks, United States of America |
| 200.3.214.69 | 5 | 3,536 | 16 | 193,635 | 12,102 | 17126 | CL | E-money, Chile |
| 84.17.5.235 | 42 | 195,941 | 13 | 152,705 | 11,746 | 8359 | RU | MTS MTS PJSC, Russian Federation |
Figure 12 – Resolvers with the highest zombie repeat query ratio
This is a day-by-day running total of the number of unique current queries made by each resolver, and the number of repeat queries made in the first hour. The resolver at 74.205.176.249 is clearly broken, in so far as it managed to generate some 10 million repeat queries in the first hour from just 3,200 initial unique queries. This appears to be a resolver that took the 1 second TTL seriously and commenced a cache refresh cycle based on this 1 second TTL.
If a resolver is going to gratuitously refresh a local cache entry, it should pass the TTL through a basic sanity check first! Or give up after 1 or 2 gratuitous refresh cycles. This is a resolver that kept on querying, and it presented the server with some 876 million subsequent queries for just 724 unique query names, an amplification factor of 1.2 million repeat queries per name. The resolver at the Missouri Research and Education network in the US (204.184.141.253) show a very similar query behaviour.
All these resolvers listed in the table above have the highest zombie amplification factor. Either they are taking the original 1 second TTL literally and attempting to keep the record in a local cache by mindlessly re-querying the name every second, or there is some other pathology that is causing these resolvers to enter a very high repeat query cycle.
Another way to look at the second category of resolver behaviour is to rank the resolvers by the ratio of zombie to current queries. Figure 13 shows the 25 resolvers with the highest zombie to current query ratio.
| Resolver | Current | Zombie | Ratio | ASN | CC | AS Name |
| 186.151.28.130 | 3,978,931 | 4,610,444,812 | 1,158 | 14754 | GT | Telgua, Guatemala |
| 38.229.33.65 | 7 | 573,038,416 | 81,862,630 | 23028 | US | Team Cymru Inc, United States |
| 38.229.33.68 | 2 | 109,905,028 | 54,952,514 | 23028 | US | Team Cymru Inc, United States |
| 38.229.33.100 | 3 | 90,637,788 | 30,212,596 | 23028 | US | Team Cymru Inc, United States |
| 38.229.33.99 | 3 | 67,436,258 | 22,478,752 | 23028 | US | Team Cymru Inc, United States |
| 38.229.33.67 | 11 | 128,929,881 | 11,720,898 | 23028 | US | Team Cymru Inc, United States |
| 199.91.135.162 | 0 | 5,519,461 | 5,519,461 | 27471 | US | Blue Coat Systems, Inc, United States |
| 212.142.63.183 | 0 | 2,472,109 | 2,472,109 | 6830 | NL | LGI-UPC Liberty Global Operations, Netherlands |
| 212.142.48.75 | 0 | 2,401,930 | 2,401,930 | 6830 | NL | LGI-UPC Liberty Global Operations, Netherlands |
| 54.193.90.244 | 1 | 1,480,634 | 1,480,634 | 16509 | US | AMAZON-02 – Amazon.com, Inc, United States |
| 54.193.58.86 | 0 | 1,479,066 | 1,479,066 | 16509 | US | AMAZON-02 – Amazon.com, Inc, United States |
| 54.193.65.165 | 0 | 1,423,147 | 1,423,147 | 16509 | US | AMAZON-02 – Amazon.com, Inc, United States |
| 54.183.221.9 | 13 | 17,637,567 | 1,356,735 | 16509 | US | AMAZON-02 – Amazon.com, Inc, United States |
| 54.193.7.134 | 0 | 842,849 | 842,849 | 16509 | US | AMAZON-02 – Amazon.com, Inc, United States |
| 218.241.99.50 | 0 | 713,779 | 713,779 | 24151 | CN | China Internet Network Information Center, China |
| 54.215.202.77 | 0 | 372,889 | 372,889 | 16509 | US | AMAZON-02 – Amazon.com, Inc, United States |
| 54.215.190.109 | 0 | 365,598 | 365,598 | 16509 | US | AMAZON-02 – Amazon.com, Inc, United States |
| 54.215.215.191 | 0 | 361,804 | 361,804 | 16509 | US | AMAZON-02 – Amazon.com, Inc, United States |
| 54.193.83.224 | 0 | 361,474 | 361,474 | 16509 | US | AMAZON-02 – Amazon.com, Inc, United States |
| 54.219.130.114 | 0 | 345,080 | 345,080 | 16509 | US | AMAZON-02 – Amazon.com, Inc, United States |
| 54.183.145.224 | 0 | 338,949 | 338,949 | 16509 | US | AMAZON-02 – Amazon.com, Inc, United States |
| 54.193.11.144 | 0 | 334,725 | 334,725 | 16509 | US | AMAZON-02 – Amazon.com, Inc, United States |
| 220.128.227.81 | 0 | 326,208 | 326,208 | 3462 | TW | HINET Data Communication Business Group, Taiwan |
| 59.120.57.250 | 0 | 323,403 | 323,403 | 3462 | TW | HINET Data Communication Business Group, Taiwan |
| 86.82.68.237 | 0 | 321,396 | 321,396 | 1136 | NL | KPN, Netherlands |
| 64.89.232.86 | 0 | 317,115 | 317,115 | 17204 | US | Nominum, Inc, United States |
Figure 13 – Resolvers with the highest zombie query ratio
It’s interesting that almost none of these resolvers made a “current” query – they appear to specialize almost exclusively in zombie queries. It may well be these particular systems are used as part of an operation to collect the URLs that users go to and then validate these URLs by resolving the names themselves. Both Team Cymru and Blue Coat apparently specialize in cybersecurity functions, so this may well be the case.
It appears that the overall 25% zombie ratio of DNS queries we are seeing here is made up of two quite different behaviours. The first is a small set of resolvers that are re-querying the same DNS query at rates that can only be described as maniacally insane! This is probably the outcome of an extended local cache retention policy and strict adherence to the provided TTL. The combination is just disastrous. The second zombie query component is a little more sinister. It seems that nothing you or I do on the Internet is a secret, and there is a large industry that actively tracks what you and I do. Now it may be that their motives are pure of heart, and they perform this intense shadowing as part of their efforts to identify and track various forms of cyber abuse and attack. However, the result is that it seems that as Internet users we are little more than goldfish in a clear glass bowl, and personal privacy is a quaint historic function.
Which has the larger zombie population? The storers? Those maniacal re-queriers that hammer a small number of unique queries. Or the stalkers? Those DNS snoopers that re-query a massive number of unique names, but each unique query is handled in a more constrained manner.
The distribution of Zombie query ratios is shown in Figure 14.
One-fifth or some 20% of all zombie queries are made from resolvers that query these labels less than five times. It is plausible to infer that this within this set of queries there is some element of online tracking and shadowing of user behaviour. Almost all visible resolvers that pose zombie queries (94%) have a zombie re-query ratio of five or less. The resolvers listed in Table 5 appear to be part of this set of DNS trackers.
At the other end of the scale, some 60% of all zombie queries are part of a repeat query set that is 100,000 queries of greater. These 60% of all zombie queries with this very high repeat rate are generated by just 11 resolvers, as listed as the highest ranked resolvers in Figure 12.
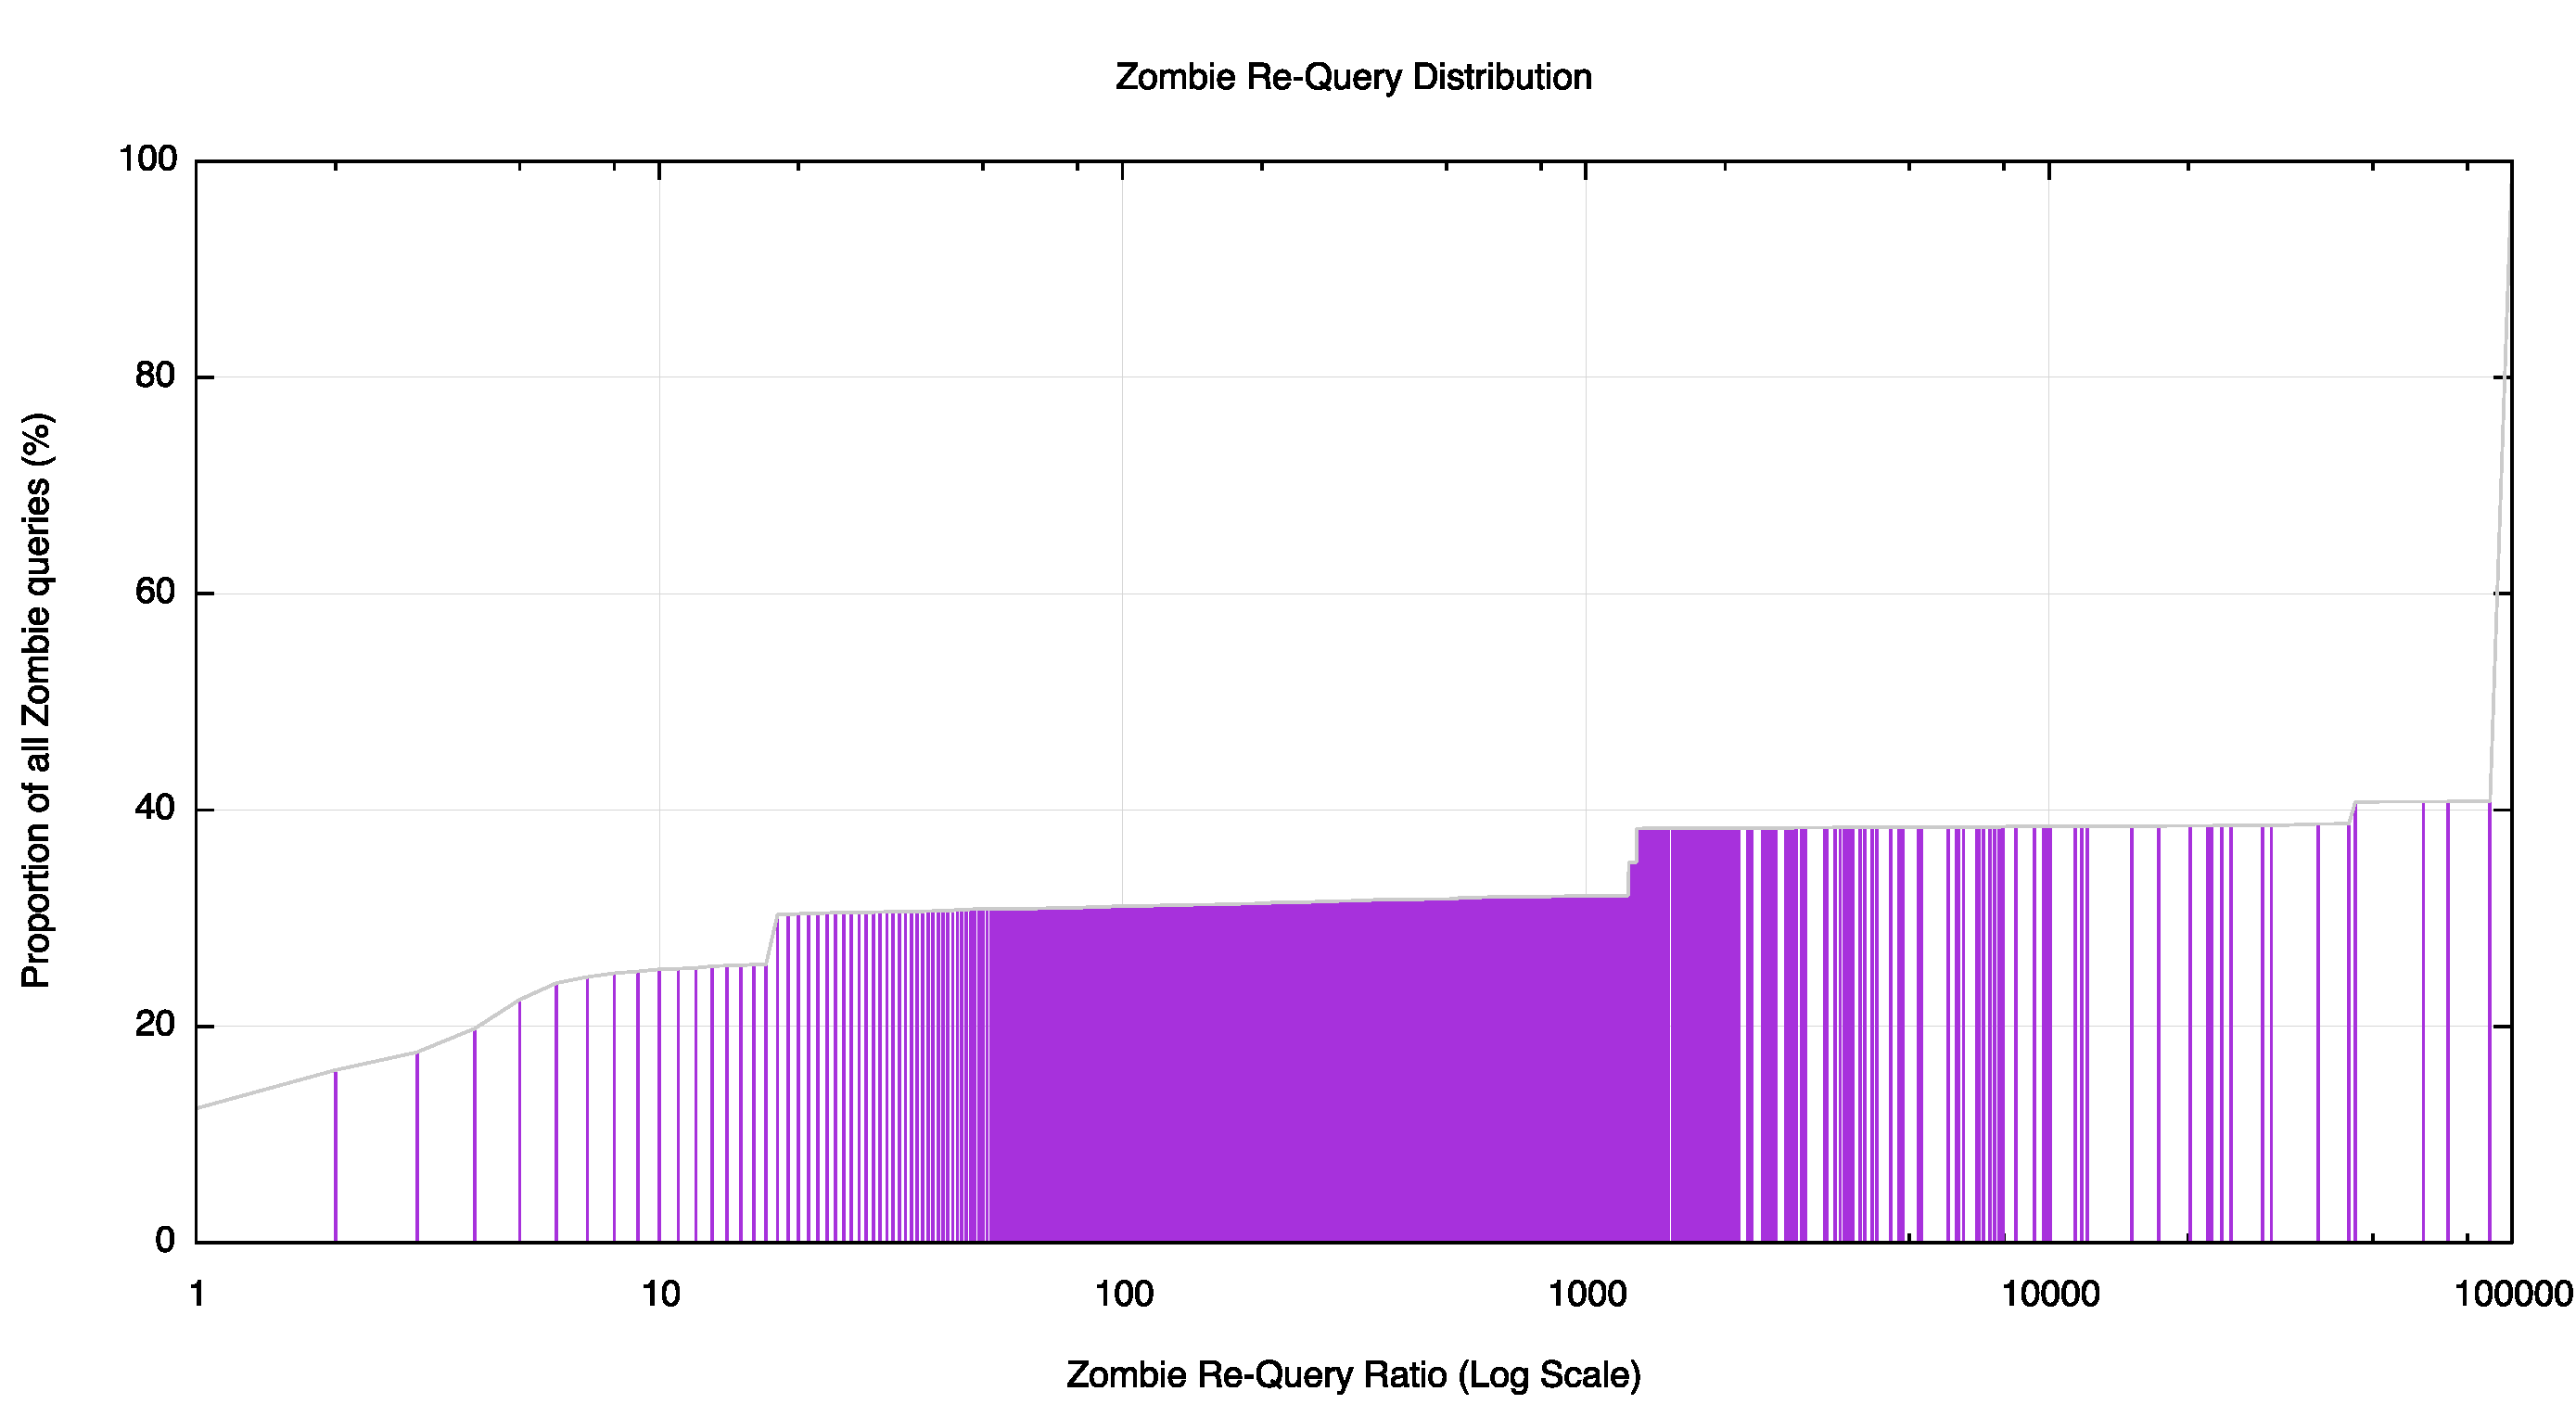
Figure 14: Cumulative Distribution of Zombie Queries per day as Zombie Ratio
In the larger scheme of things, most of the DNS is behaving exactly as expected, and more than one-half of the 1.2 million visible DNS resolvers make no zombie queries whatsoever. Some 424,000 visible resolvers perform up to 5 zombie queries per unique query name, which could be seen as some modest level of local cache refresh. The remaining 15,000 DNS resolvers behave in progressively worse ways, with the re-query rates rising from 5 zombie queries per unique query to the worst case of 1.2 million zombie queries per unique query. Even if we can fix just 11 of the worst cases here we would make a substantial impact on the zombie population in the DNS.
The good news is that we now know who these zombies are.
Now all we have to do is kill them.
Zombiepedia offers some hints as to how to do that!
Editors Note: Below is a presentation that Geoff gave on this topic at DNS OARC 24, Buenos Aires
The views expressed by the authors of this blog are their own and do not necessarily reflect the views of APNIC. Please note a Code of Conduct applies to this blog.
yeah, this dive into dns zombies from back in 2016 still feels spot on – those lingering queries eating up 25% of the load on authoritative servers are a real headache, especially with wedged resolvers stuck in endless loops or the creepy shadowing for tracking user behavior. the stats on high-repeat offenders like that guatemalan ip blasting billions of zombies highlight how a few bad actors can mess with the whole ecosystem, and it’s wild thinking about the privacy hits from all that unintended monitoring. when you’re tracing these rogue resolvers or checking ip ownership to flag potential issues, tools like ipwhois.net make it easy to pull up geolocation and isp details quick. props for calling out the need to “calm down” those maniacal ones – wonder how much has improved since then with better ttl handling?