

It’s time for another annual roundup from the world of IP addresses. Let’s examine the changes that have occurred in the past 12 months in addressing the Internet and consider what IP address allocation information can reveal about the evolving nature of the network itself.
Around 1992, the Internet Engineering Task Force (IETF) conducted the ‘IP Next Generation’ study (RFC 1752) to understand the demands that would be placed on the addressing system. The staggeringly large numbers of connected devices that we see today were certainly within the range predicted by that study. The assumption made at the time was that we would continue to use much the same IP protocol architecture, including that each connected device would be assigned a unique IP address. This implied that the 32-bit address field defined in version four of the IP protocol was clearly going to be inadequate to cope with the predicted number of connected devices. A span of 4B address values was just not large enough.
At the time, it was concluded that the only way the Internet would work across such a massive pool of connected devices was to deploy a new IP protocol that came with a massively larger address space. This world of abundant silicon processors connected to a single public Internet was the scenario that IPv6 was primarily intended to solve. The size of the 128-bit address space would allow us to uniquely assign a public IPv6 address to every such device, no matter how small, or how many
But while the Internet has grown at amazing speeds across the ensuing 33 years, the deployment of IPv6 has proceeded at a more measured pace. There’s still no evidence of any common sense of urgency about the deployment of IPv6 in the public Internet, and there is still no common agreement that the continued reliance on IPv4 is failing us.
There’s a contradiction between the addressed device population of the IPv4 Internet and the actual count of connected devices, which is, of course, many times larger. Through the 1990s, the Internet rapidly changed from a peer-to-peer architecture to a client/server framework. Clients can initiate network transactions with servers, but are incapable of initiating transactions with other clients. Servers are capable of completing connection requests from clients, but cannot initiate such connections with clients.
Network Address Translators (NATs) are a natural fit to this client/server model. Pools of clients can share a smaller pool of public addresses and require the use of an address once they have initiated an active session with a remote server. NATs squeeze 30B connected devices into a far smaller pool of 3B advertised IPv4 addresses. Services and applications that cannot work behind NATs are no longer useful in the context of the public Internet, and are no longer used as a result.
In essence, we dropped the notion that an IP address is uniquely associated with a device’s identity. The resulting ability to share addresses across clients alleviated the immediacy of the IPv4 addressing problem for the Internet.
The pressures of this unstoppable growth in the number of deployed devices connected to the Internet imply that even NATs cannot absorb these growth pressures forever. NATs can extend the effective addressable space in IPv4 by up to 32 ‘extra’ bits, using mapping of the 16-bit source and destination port fields of the Transport Control Protocol (TCP) and User Datagram Protocol (UDP) headers. They also enable the time-based sharing of these public addresses. Both of these measures are effective in stretching the IPv4 address space to encompass a larger client device pool, but they do not transform the finite IP address space into an infinitely elastic resource.
The outcome of this process, if it were limited to operate solely within IPv4, would be the fragmentation of the IPv4 Internet into disconnected parts based on the service ‘cones’ of the points of presence of the content distribution servers. The entire concept of a globally unique and coherent address pool layered over a single coherent packet transmission realm would be over.
Alternatively, we may see these growth pressures motivate the further deployment of IPv6, and the emergence of IPv6-only elements of the Internet as the network itself tries to maintain a cohesive and connected whole. Commercial pressures are pulling the network in both of these directions, so it’s entirely unclear what path the Internet will follow in the coming years. My (admittedly cynical, and perhaps overly jaded) personal opinion lies in a future of a highly fragmented network, at least in terms of the underlying packet connectivity protocol.
Can address allocation data help us to shed some light on what is happening in the larger Internet? Let’s look at what happened in 2025.
IPv4 in 2025
It appears that the process of exhausting the remaining pools of unallocated IPv4 addresses is proving to be as protracted as the process of the transition to IPv6. By the end of 2021, the end of the old registry allocation model had effectively occurred, with the depletion of pools of unallocated addresses in each of the Regional Internet Registries (RIRs).
It’s difficult to talk about ‘allocations’ in today’s Internet. There is still a set of transactions where addresses are drawn from the residual pools of RIR-managed available address space, and allocated or assigned to network operators. At the same time, there is also a set of transactions where addresses are traded between networks in what is essentially a ‘sale’. These address transfers necessarily entail a change of registration details, so the registry records the outcome of a transfer, or sale, in a manner that is like an allocation or assignment.
We want to look at the larger picture of the amount of IPv4 address space used, or usable, by Internet network operators. Perhaps the best metric to use is the total span of allocated and assigned addresses, and the consequent indication of annual change in the change in this total address span from year to year.
What is the difference between ‘allocated’ and ‘assigned’?
When a network operator or sub-registry has received an allocation, it can further delegate that IP address space to its customers, along with using it for their own internal infrastructure. When a network operator has received an assignment, this can only be used for their own internal infrastructure.
I personally find the distinction between these two terms a distracting artifice these days, so from here on I’ll use the term ‘allocation” to describe both allocations and assignments, without further distinction.
The total IPv4 allocated address pool contracted by 237K addresses in 2025, with 3.687B allocated addresses at the end of the year. This represented a contraction of 0.01% of the total allocated IPv4 public address pool through 2025 (Table 1).
| 2011 | 2012 | 2013 | 2014 | 2015 | 2016 | 2017 | 2018 | 2019 | 2020 | 2021 | 2022 | 2023 | 2024 | 2025 | |
| Address span (B) | 3.395 | 3.483 | 3.537 | 3.593 | 3.624 | 3.643 | 3.657 | 3.657 | 3.682 | 3.684 | 3.685 | 3.687 | 3.686 | 3.687 | 3.687 |
| Annual change (M) | 168.0 | 88.4 | 53.9 | 55.9 | 30.6 | 19.4 | 13.2 | 0.6 | 24.9 | 2.2 | 1.1 | 1.6 | -0.4 | 1.2 | -0.2 |
| Relative growth | 5.2% | 2.6% | 1.5% | 1.6% | 0.85% | 0.53% | 0.36% | 0.02% | 0.68% | 0.06% | 0.03% | 0.04% | -0.01% | 0.03% | -0.01% |
Table 1 — IPv4 allocated addresses by year.
Have we exhausted all the available sources of further IPv4 addresses? The address management model is that unallocated addresses are held in a single pool by the Internet Assigned Numbers Authority (IANA). Blocks of addresses are passed to RIRs, who then allocate them to various end entities, either for their own use or for further allocation. But, IANA exhausted the last of its available address pools years ago. These days, it holds just three /24 address prefixes and has done so for the past 13 years. Because the option of dividing this tiny address pool into five equal chunks of 153.6 individual addresses is not viable, these addresses are likely to sit in IANA recovered address registry for some time.
That is, until one or more of the RIRs return more prefixes recovered from the old ‘legacy’ allocated addresses to IANA, who would then be able to divide the pool and distribute them to each of the five RIRs. This is unlikely to occur.
There are also addresses that IANA have marked as reserved for some special purpose. This includes blocks of addresses reserved for Multicast use. At the high end of the IPv4 address space registry, there is a set of addresses marked as reserved for Future Use (240.0.0.0/4). This is a large pool of 268,435,456 addresses (the former ‘Class E’ space), and if ever there was a ‘future’ for IPv4, then it has well and truly come and gone. How to unlock this space and return it to the general use pool is a problem that so far has not found a generally workable solution, although efforts to do so have surfaced in the community from time to time.
The topic of releasing the Class E space for use in the public Internet as a globally routable unicast address space has come up during the past 15 years or so. Some Internet drafts were published for the IETF’s consideration that either directly proposed releasing this space for use or outlined the impediments in host and router implementations that were observed to exist in 2008 when these drafts were being developed.
The proposals lapsed, probably due to the larger consideration at the time that the available time and resources to work on these issues were limited, and the result of the effort spent in ‘conditioning’ this IPv4 space for general use was only going to obtain a very small extension in the anticipated date of depletion of the remaining IPv4 address pools. The same amount of effort spent on working on advancing IPv6 deployment was assumed to have a far larger beneficial outcome.
From time to time, this topic reappears on mailing lists and blogs, but the debates tend to circle around this same set of topics one more time and then lapse.
As IANA is no longer a source of new IP addresses, we need to look at the RIR practices to see the life cycle of addresses from a registry perspective. When IP address space is returned to the RIR or reclaimed by the RIR according to the RIR’s policies, it is normally placed in a RIR-reserved pool for some time and marked as reserved.
Marking returned or recovered addresses as reserved for a period of time allows address prefix reputation and related services, including routing records, to record the cessation of the previous state of the addresses’ prefix, before any subsequent allocation. Following this quarantine period, which has been between months and years, this reserved space is released for reuse.
The record of annual year-on-year change in allocated addresses per RIR during the same fourteen-year period is shown in Table 2. There are some years when the per-RIR pool of allocated addresses shrunk in size. This is generally due to inter-RIR movement of addresses, due to administrative changes and inter-RIR address transfers.
| 2011 | 2012 | 2013 | 2014 | 2015 | 2016 | 2017 | 2018 | 2019 | 2020 | 2021 | 2022 | 2023 | 2024 | 2025 | |
| APNIC | 101.0 | 0.6 | 1.2 | 4.6 | 7.4 | 6.7 | 3.2 | 0.4 | 10.5 | 1.7 | 1.5 | 0.8 | -1.1 | -0.8 | 0.6 |
| RIPE NCC | 40.5 | 37.8 | 1.0 | 33.8 | 4.7 | 4.1 | 3.7 | 0.3 | 12.0 | 0.4 | 2.5 | 4.7 | 6.2 | 5.0 | 8.9 |
| ARIN | 53.8 | 24.3 | 19.0 | -14.1 | 2.3 | -4.8 | -2.3 | -0.3 | -10.1 | -0.9 | -1.7 | -3.8 | -5.5 | -3.0 | -2.9 |
| LACNIC | 13.6 | 17.3 | 26.3 | 18.7 | 1.2 | 1.5 | 1.4 | 0.1 | 2.4 | 1.2 | -0.2 | -0.3 | -0.1 | 0.0 | -7 |
| AFRINIC | 9.4 | 8.5 | 6.3 | 12.8 | 15.0 | 11.9 | 7.1 | 0.2 | 10.1 | -0.2 | -0.9 | 0.2 | 0.1 | 0.0 | 0.2 |
| Total | 218.3 | 88.5 | 53.8 | 55.8 | 30.6 | 19.4 | 13.1 | 0.7 | 24.9 | 2.2 | 1.2 | 1.6 | -0.4 | 1.2 | -0.2 |
Table 2 — Annual change in IPv4 allocated addresses (millions), distribution by RIR.
Each of the RIRs is running through its final pools of IPv4 addresses. At the end of 2025, across the RIR system, there are 3.9M addresses in the available pool, held mainly in APNIC (3.1M) and AFRINIC (773K). About 11.2M addresses are marked as reserved, with 5.6M held by ARIN and 4.5M addresses held by AFRINIC. As seen in Table 3, there has been a reduction in the reserved pool for all RIRs, except AFRINIC, and the major reductions were seen in APNIC (1.7M) and ARIN (600K).
| Available | Reserved | ||||||
| RIR | 2023 | 2024 | 2025 | 2023 | 2024 | 2025 | |
| APNIC | 2,469,120 | 3,647,488 | 3,107,392 | 2,202,624 | 416,256 | 465,152 | |
| RIPE NCC | 1,024 | 256 | 1,536 | 708,872 | 677,160 | 782,440 | |
| ARIN | 8,960 | 3,840 | 66,560 | 5,213,184 | 4,609,792 | 5,424,640 | |
| LACNIC | 256 | 1,536 | 2,304 | 151,296 | 118,528 | 118,528 | |
| AFRINIC | 1,201,664 | 990,976 | 773,632 | 4,186,112 | 4,443,648 | 4,480,512 | |
| Total | 3,681,024 | 4,644,096 | 3,951,424 | 12,462,088 | 10,265,384 | 11,271,272 | |
Table 3 — IPv4 available and reserved pools, December 2023 to December 2025.
In the case of ARIN, a transfer between two ARIN-serviced entities is conceptually treated as two distinct transactions: A return of the addresses to the ARIN registry and a new allocation from ARIN. The date of the transfer is recorded as the new allocation date in the records published by the RIR. Other RIRs treat an address transfer like a change of the nominated holder of the already-allocated addresses, and when processing a transfer, the RIR’s records preserve the original allocation date for the transferred addresses.
When we look at the individual transaction records in the published RIR data and collect them by year, the collected ARIN data includes the volume of transferred addresses that were processed in that year. The other RIRs only include the allocations performed in that year.
To provide a view across the entire system, it’s necessary to use an analysis approach that can compensate for these differences in the ways RIRs record address transactions.
In this study, an allocation is defined as a state transition in the registry records from reserved or available, to an allocated state. This is intended to separate out the various actions associated with processing address transfers — which generally involve no visible state change, as the transferred address block remains allocated across the transfer — from allocations.
This is how the data in Figure 1 was generated from the data published by RIRs. It compares the status of the address pools at the end of each year to that of the status at the start of the year. An allocation in that year is identified if the allocated address block was not registered as allocated at the start of the year.
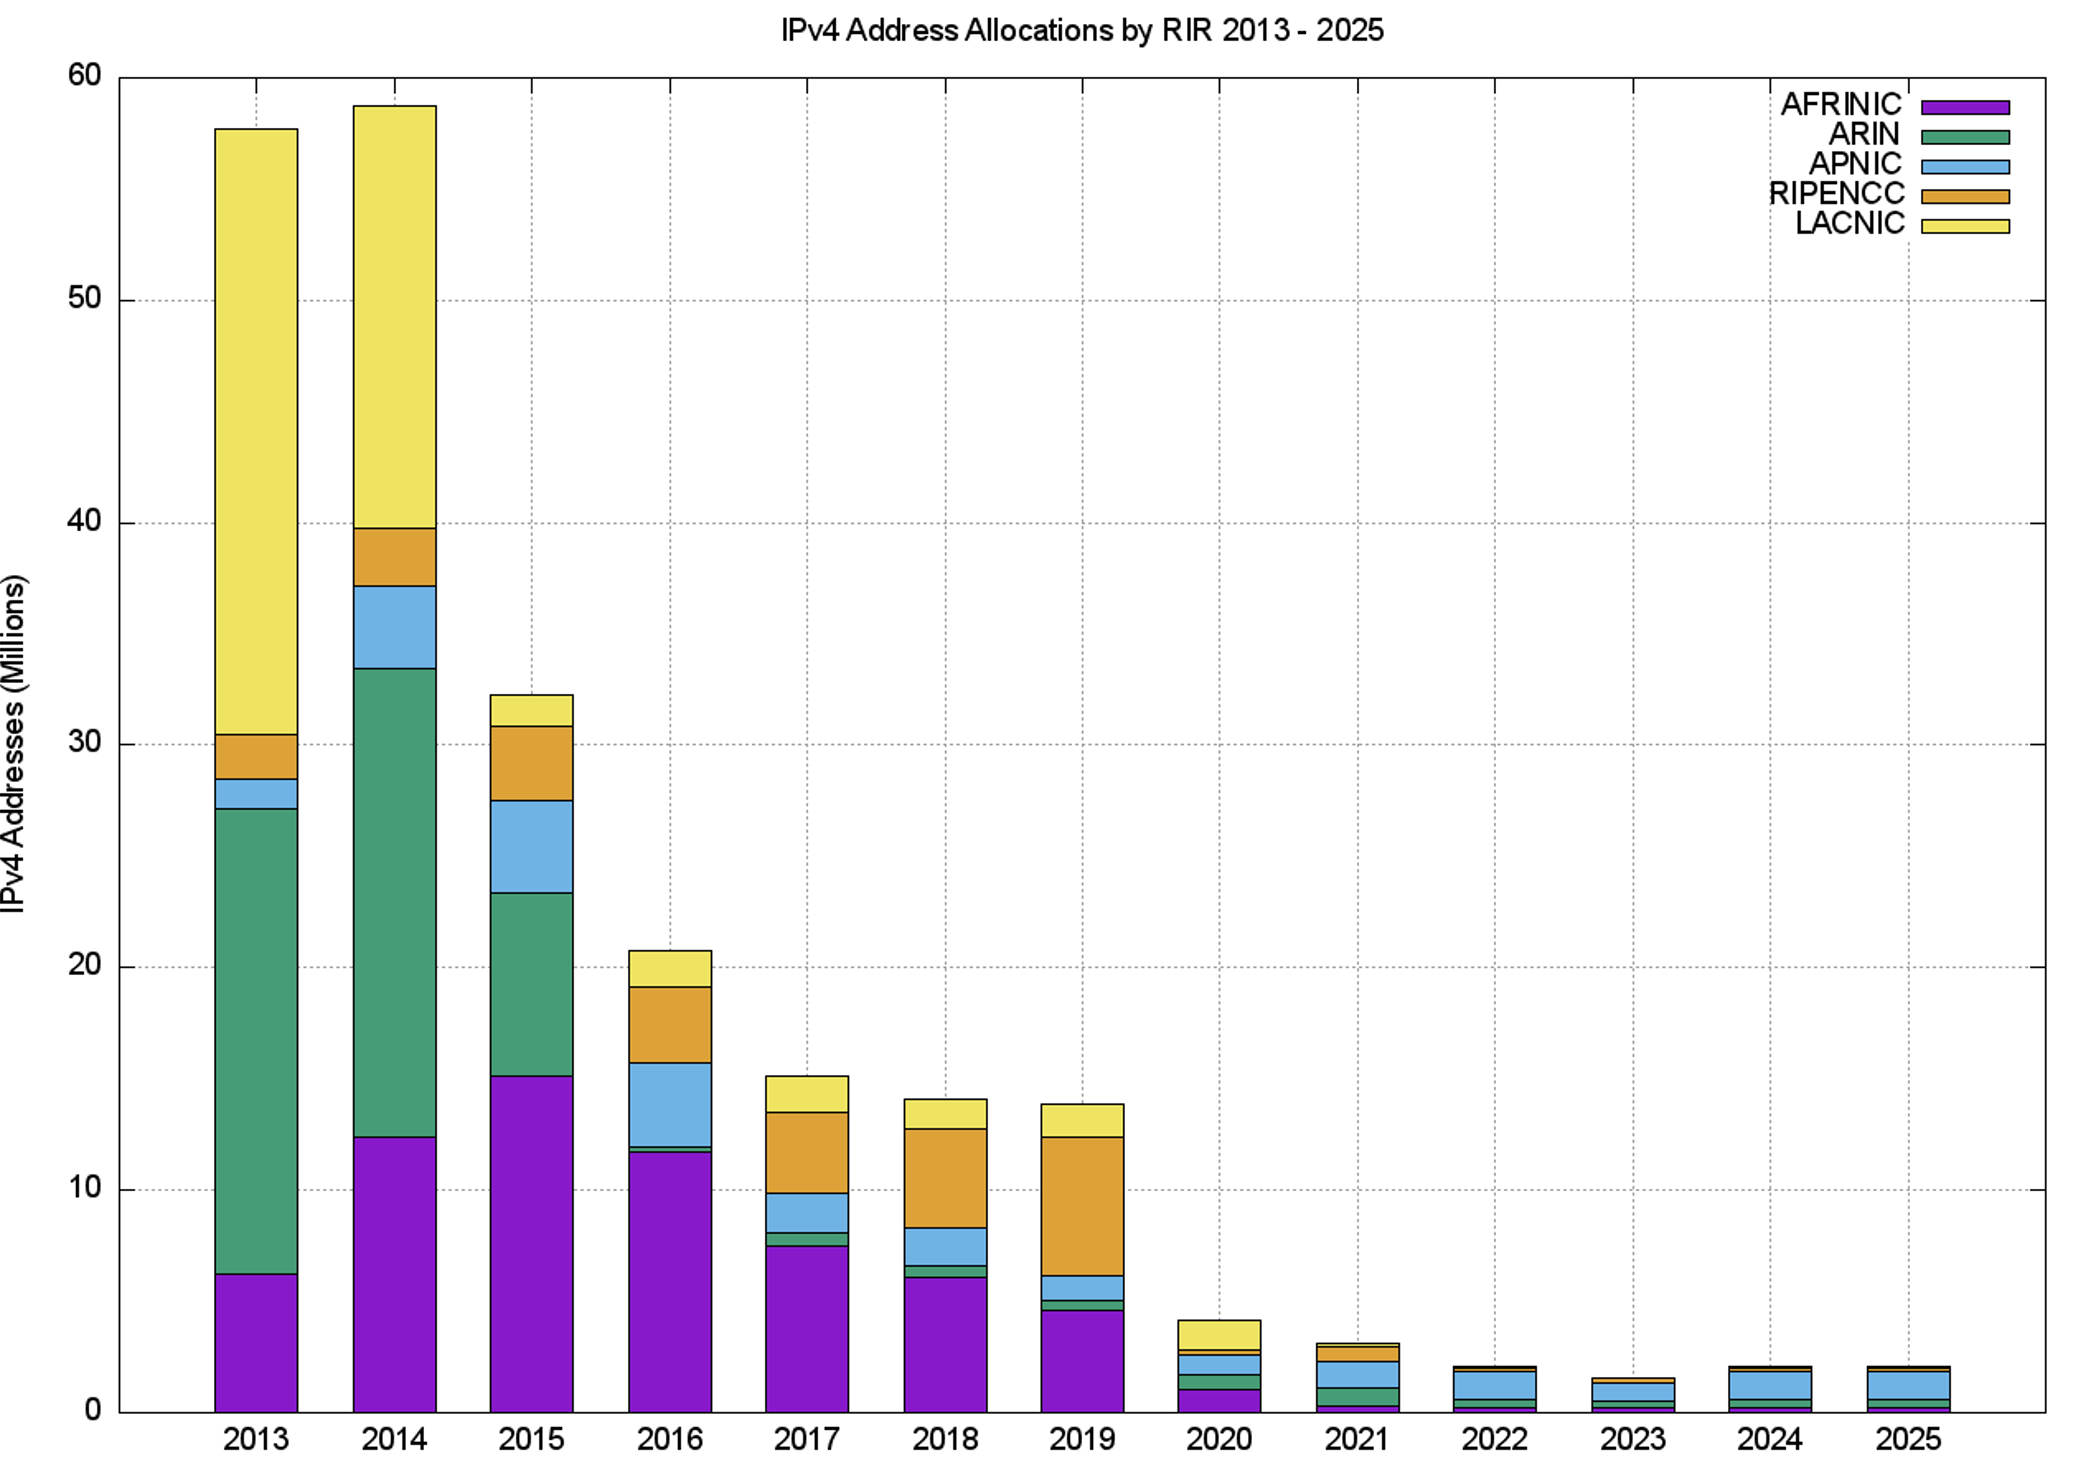
The number of RIR IPv4 allocations by year, once again generated by using the same data analysis technique as used for Figure 1, is shown in Figure 2.
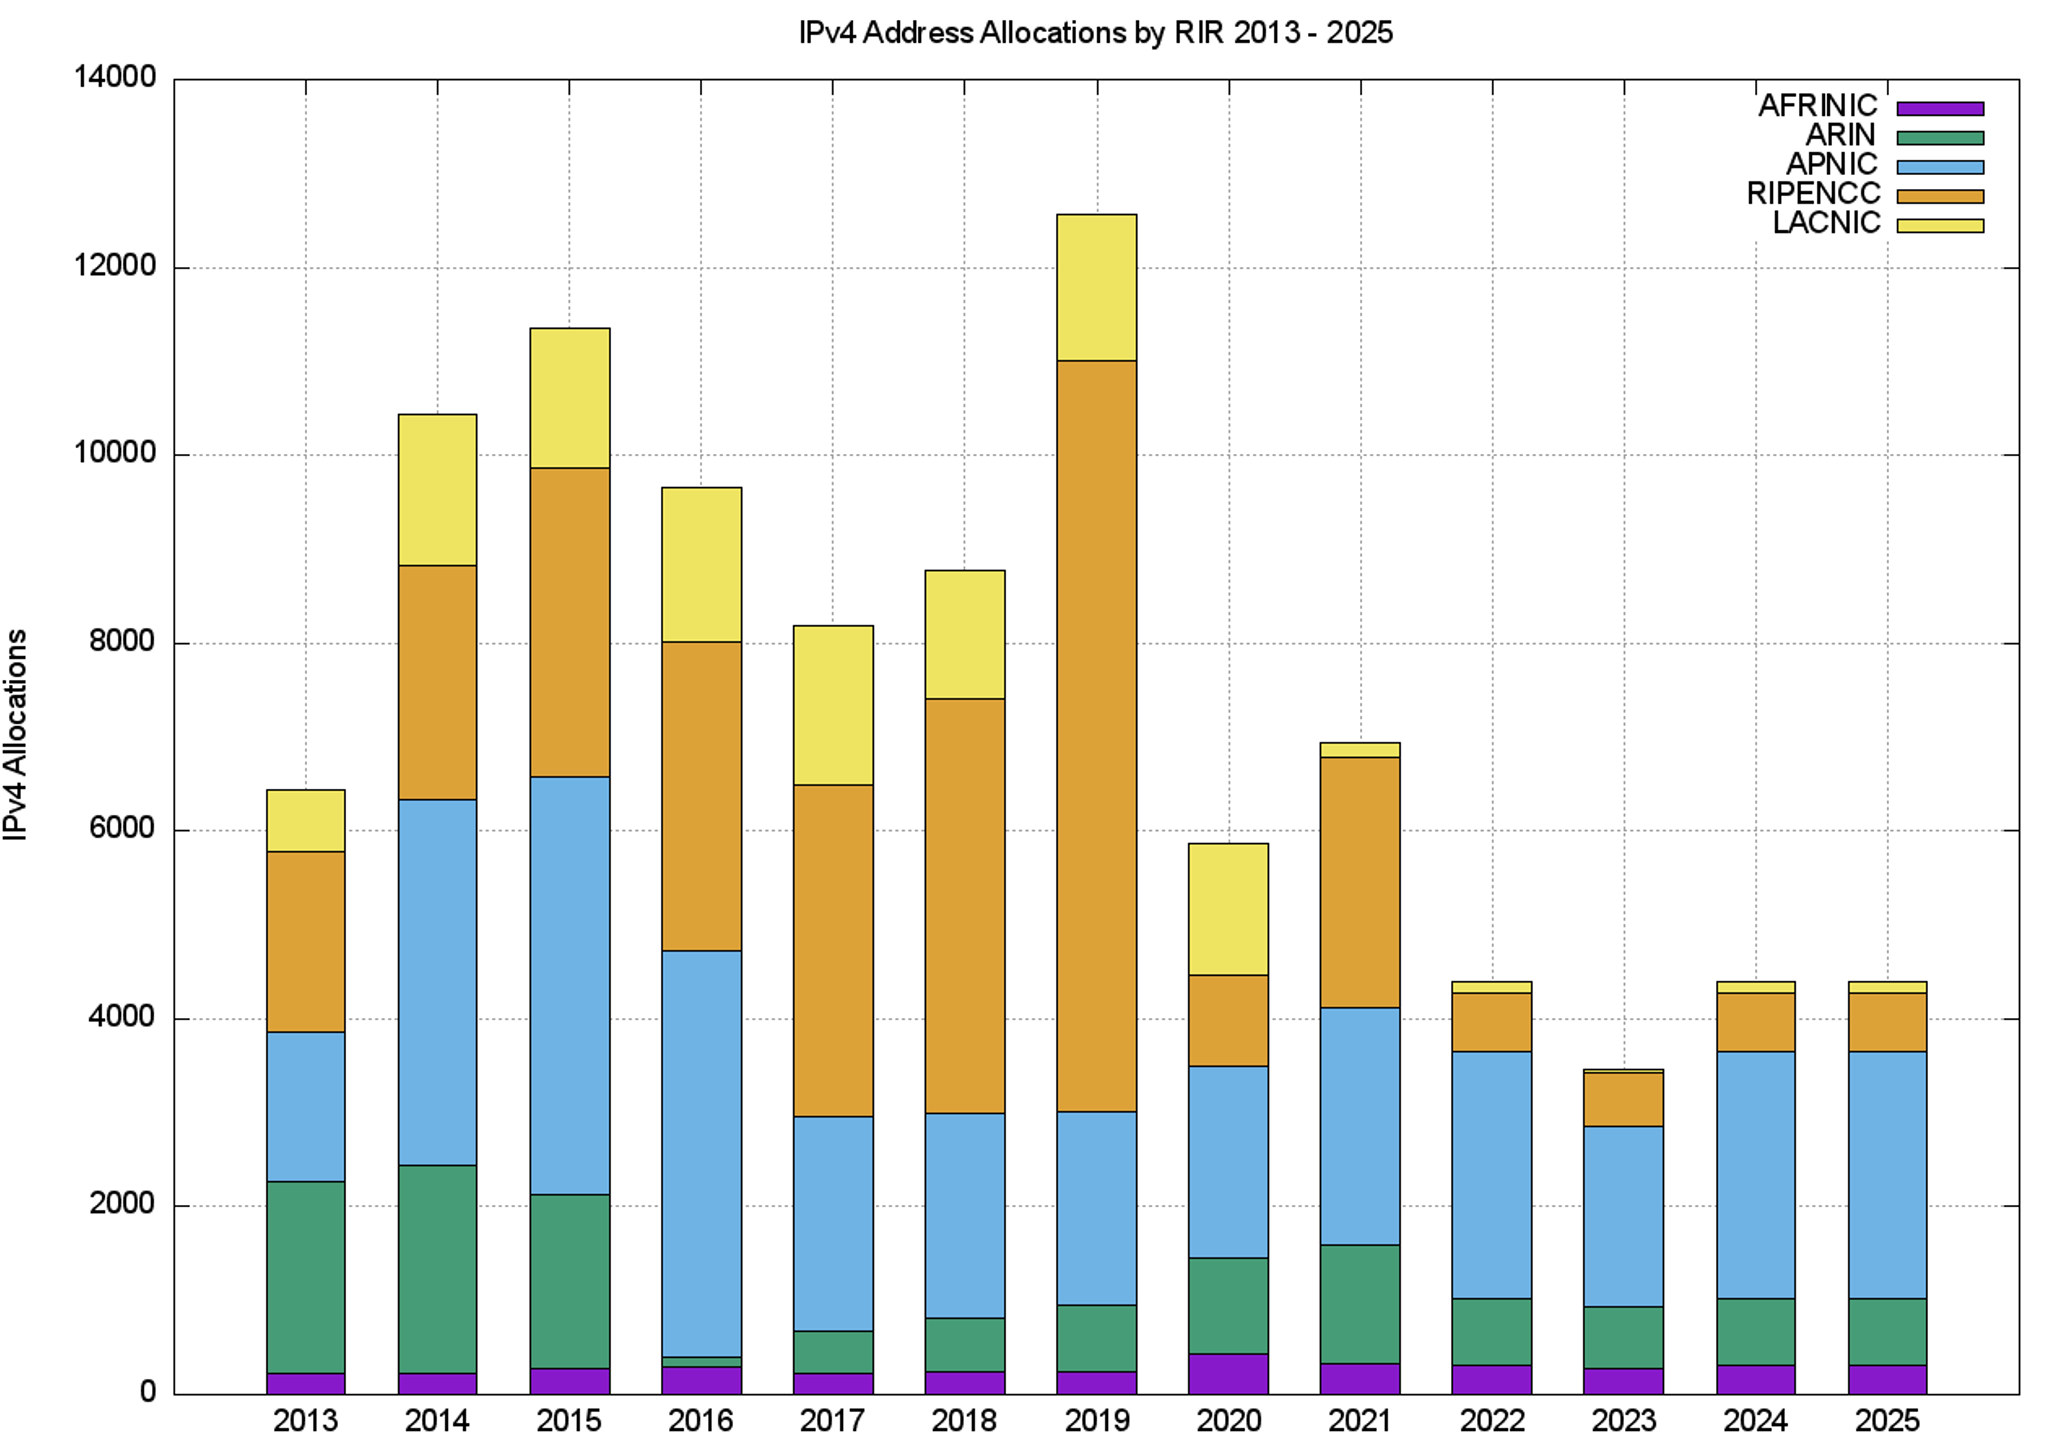
It’s clear from these two figures that the average size of an IPv4 address allocation has shrunk considerably in recent years, corresponding to the IPv4 address exhaustion policies in each of the RIRs.
IPv4 address transfers
The RIRs permit the registration of IPv4 transfers between address holders to allow secondary redistribution of addresses as an alternative to returning unused addresses to the registry. This has been in response to the issues raised by IPv4 address exhaustion. The underlying motivation is to encourage the reuse of otherwise idle or inefficiently used address blocks through the incentives provided by a market for addresses, and to ensure that such address movement is publicly recorded in the registry system.
The number of registered transfers in the past 11 years is shown in Table 4. This number of transfers includes both inter-RIR and intra-RIR transfers. It also includes both the merger and acquisition-based transfers and the other grounds for address transfers. Each transfer is treated as a single transaction, and in the case of inter-RIR transfers, this is accounted for in the receiving RIR’s totals.
| Receiving RIR | 2013 | 2014 | 2015 | 2016 | 2017 | 2018 | 2019 | 2020 | 2021 | 2022 | 2023 | 2024 | 2025 |
| APNIC | 180 | 307 | 451 | 840 | 845 | 491 | 533 | 820 | 785 | 745 | 796 | 752 | 706 |
| RIPE NCC | 171 | 1,054 | 2,836 | 2,373 | 2,451 | 3,775 | 4,221 | 4,696 | 5,742 | 4,640 | 4,937 | 5,215 | 4,196 |
| ARIN | 3 | 22 | 26 | 26 | 68 | 94 | 150 | 141 | 97 | 185 | 703 | ||
| LACNIC | 2 | 3 | 9 | 17 | 20 | 17 | 12 | ||||||
| AFRINIC | 17 | 27 | 26 | 80 | 58 | 14 | 15 | 2 | |||||
| Total | 351 | 1,361 | 3,290 | 3,235 | 3,322 | 4,311 | 4,849 | 5,639 | 6,766 | 5,601 | 5,864 | 6,184 | 5,619 |
Table 4 — IPv4 address transfer transactions per year.
The differences between the RIR-reported numbers are interesting. The policies relating to address transfers do not appear to have been adopted to any significant extent by address holders in AFRINIC and LACNIC serviced regions, while uptake in the RIPE NCC service region appears to be very enthusiastic!
A slightly different view is that of the volume of addresses transferred per year (Table 5).
| Receiving RIR | 2013 | 2014 | 2015 | 2016 | 2017 | 2018 | 2019 | 2020 | 2021 | 2022 | 2023 | 2024 | 2025 |
| APNIC | 2.3 | 4.1 | 6.6 | 8.2 | 4.9 | 10.0 | 4.3 | 16.6 | 6.5 | 3.7 | 2.7 | 2.5 | 2.4 |
| RIPE NCC | 2.0 | 9.6 | 11.6 | 9.2 | 24.6 | 19.5 | 26.9 | 18.2 | 16.2 | 36.9 | 20.8 | 23.0 | 22.3 |
| ARIN | 0.1 | 0.3 | 0.2 | 0.0 | 0.3 | 0.2 | 0.2 | 3.1 | 1.6 | 4.5 | 8.4 | ||
| LACNIC | 0.0 | 0.0 | 0.0 | 0.0 | 0.0 | 0.0 | 0.2 | ||||||
| AFRINIC | 0.2 | 0.5 | 1.2 | 3.4 | 0.5 | 0.1 | 0.1 | 0 | |||||
| Total | 4.3 | 13.7 | 18.2 | 17.6 | 29.6 | 29.7 | 31.9 | 36.2 | 26.4 | 44.3 | 25.3 | 30.2 | 33.4 |
Table 5 — Volume of transferred IPv4 addresses per year (millions of addresses).
A plot of these numbers is shown in Figures 3 and 4.
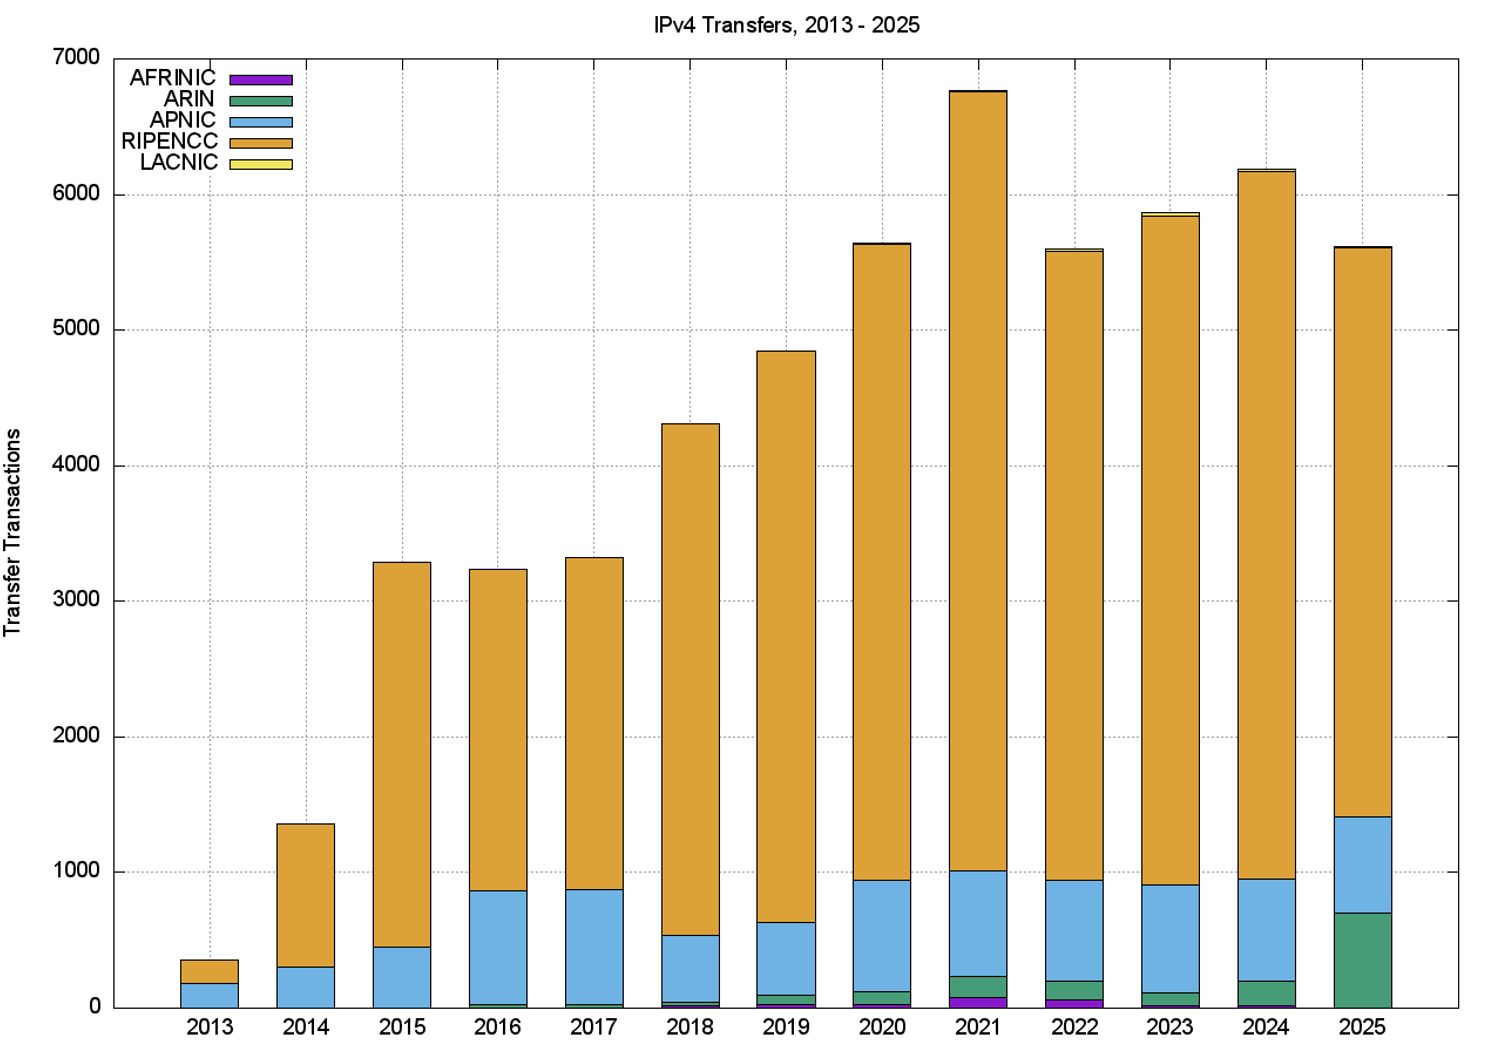
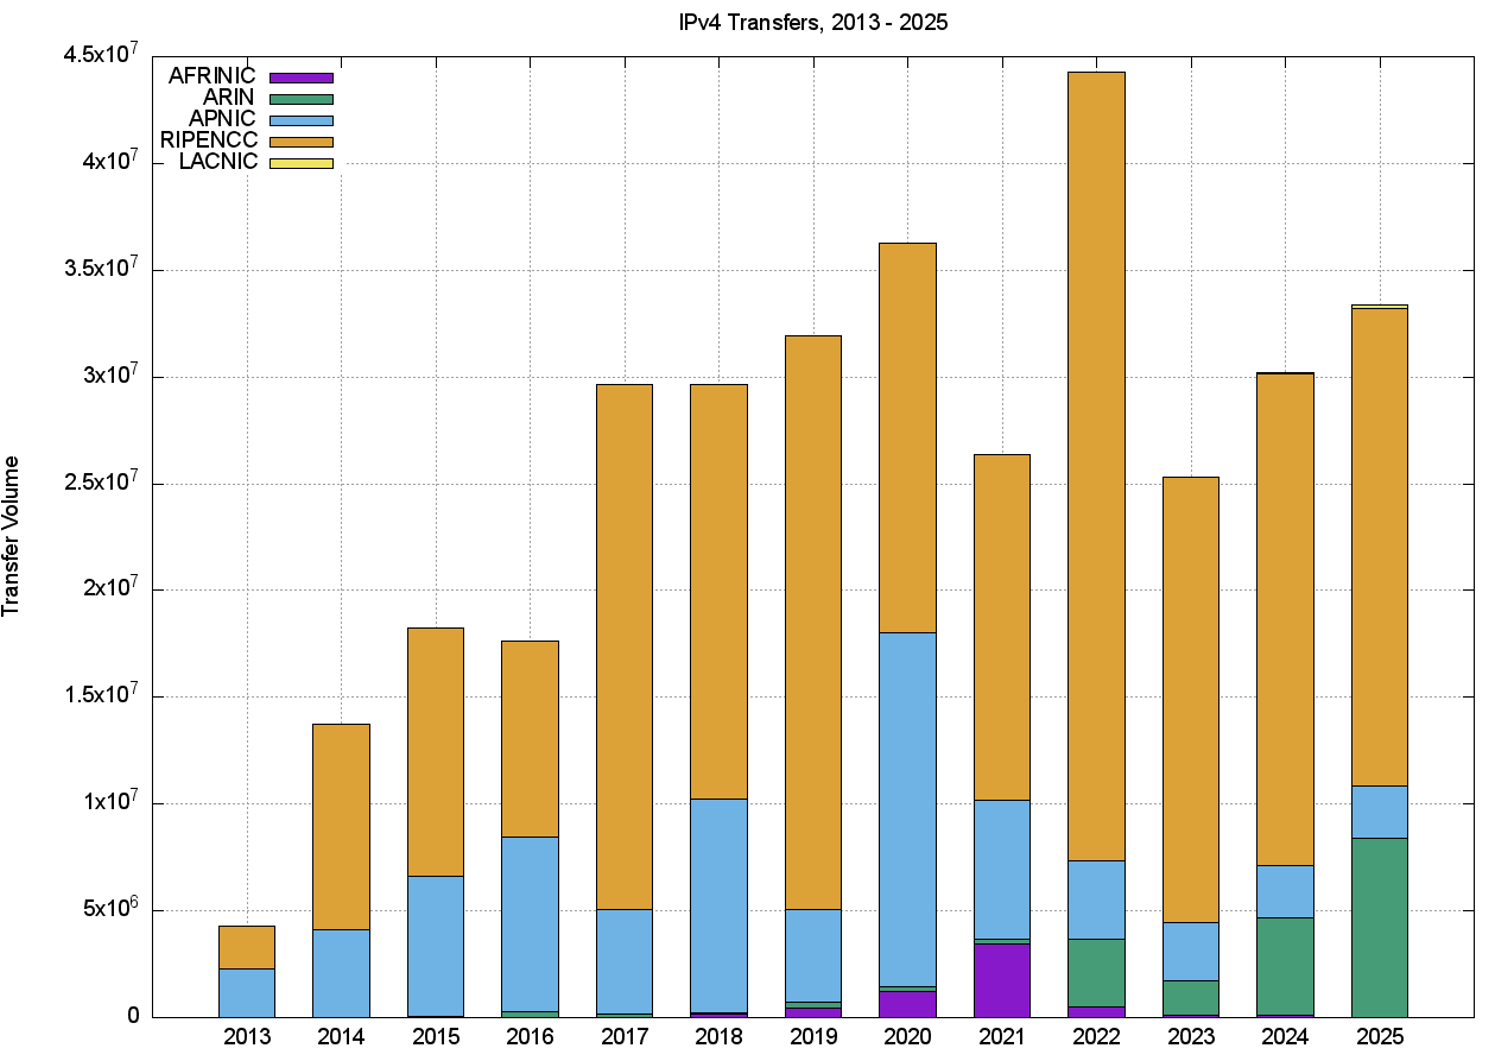
The volumes of transferred addresses reached a peak in 2022 and declined in 2023. In the case of APNIC, the peak occurred in 2020, and the APNIC 2024 volume is comparable to the volume transferred in 2013. In the ARIN service region, address transfers are growing in total volume. In the APNIC service region, the volume of IPv4 address transfers has reduced.
The aggregate total of addresses that have been listed in these transfer logs since 2012 is about 342M addresses, or the equivalent of 20.4 /8s, which is 9.3% of the total delegated IPv4 address space of 3.7B addresses. That figure is likely to be an overestimate, as some address blocks have been transferred multiple times during this period.
Are transfers performing unused address recovery?
This data raises some questions about the nature of transfers. The first question is whether address transfers have managed to recycle from the pool of allocated, but unadvertised, public IPv4 addresses back into active use.
The thought was that by being able to monetize these addresses, holders of such addresses might be motivated to convert their networks to use private addresses and resell their holdings of public addresses. In other words, the opening of a market in addresses would provide an incentive for otherwise unproductive address assets to be placed on the market.
Providers who needed addresses would compete with other providers who had a similar need in bidding to purchase these addresses. In conventional market theory, the most efficient user of addresses (here, ‘most efficient’ is based on the ability to use addresses to generate the highest revenue) would be able to set the market price. Otherwise, unused addresses would be put to productive use, and as long as demand outstrips supply, the most efficient use of addresses is promoted by the actions of the market. In theory.
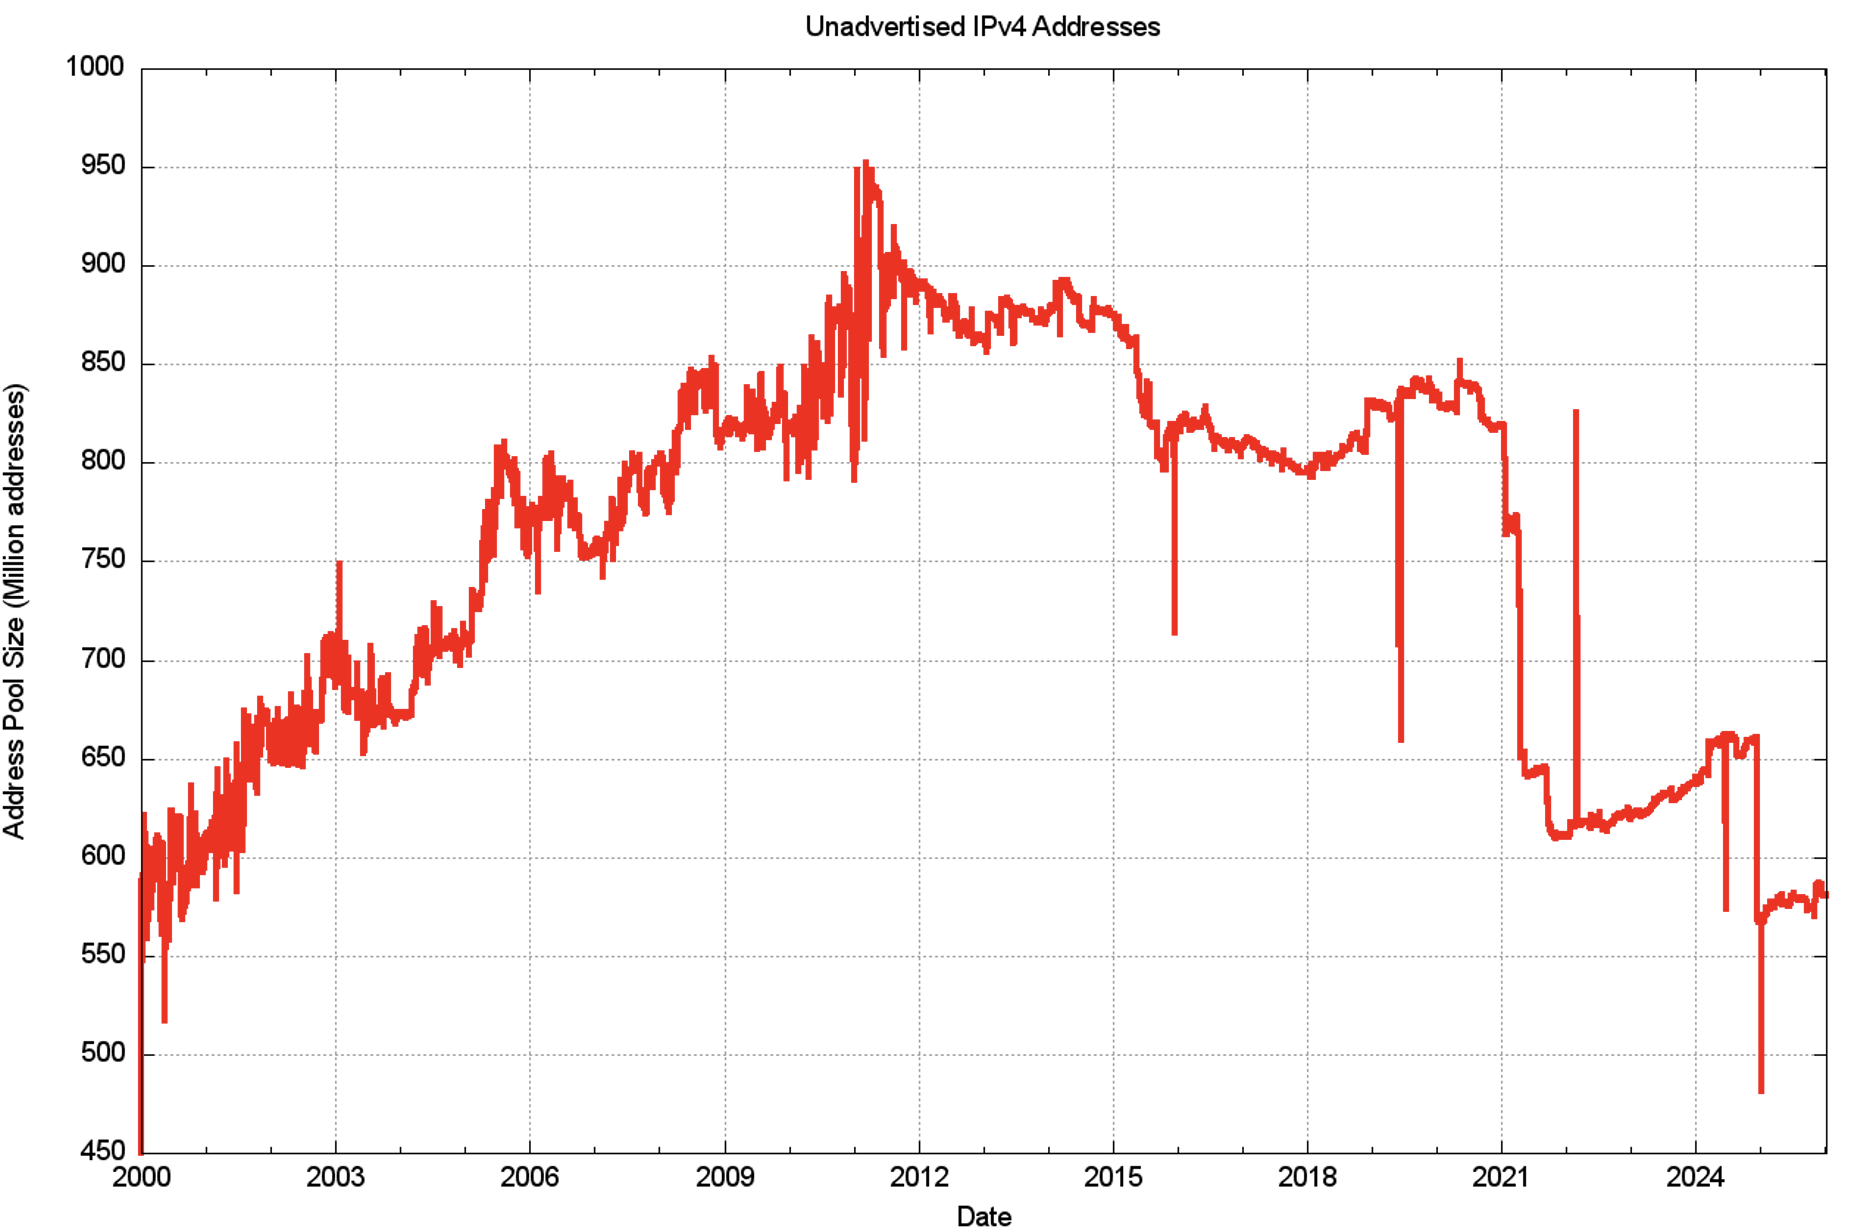
The practical experience with transfers is not so clear. The data relating to address recycling is inconclusive. In the period of 2000 to 2010, the pool of unadvertised assigned IP4 addresses increased in size from 600M to 900M addresses, which was almost one third of the assigned address pool. In the following 11 years, the pool of unadvertised assigned addresses fell to around 800M addresses, with the bulk of that reduction occurring in 2015.
There was a large reduction in the size of this unadvertised address pool at the start of 2021. This was due to the announcement in the Internet’s routing system of seven /8s, from the address space originally allocated to the US Department of Defence (DoD) in the early days of the ARPANET.
At the end of 2021, AS749 originated more IPv4 addresses than any other network — 211,581,184 addresses. This is equivalent to a /4.34 in prefix length notation, or 5% of the total IPv4 address pool. Across 2022 and 2023, the previous trend of an increasing pool of unadvertised addresses resumed.
On December 12 2024, a total of 81,224,704 addresses (the equivalent of 4.8 /8s) were advertised by Autonomous Systems (ASes) operated by Amazon, mainly AS16509, bringing the total pool of unadvertised addresses down to a level last observed in the year 2000. Across 2025, the pool of unadvertised assigned IPv4 addresses has increased slightly (Figure 5).
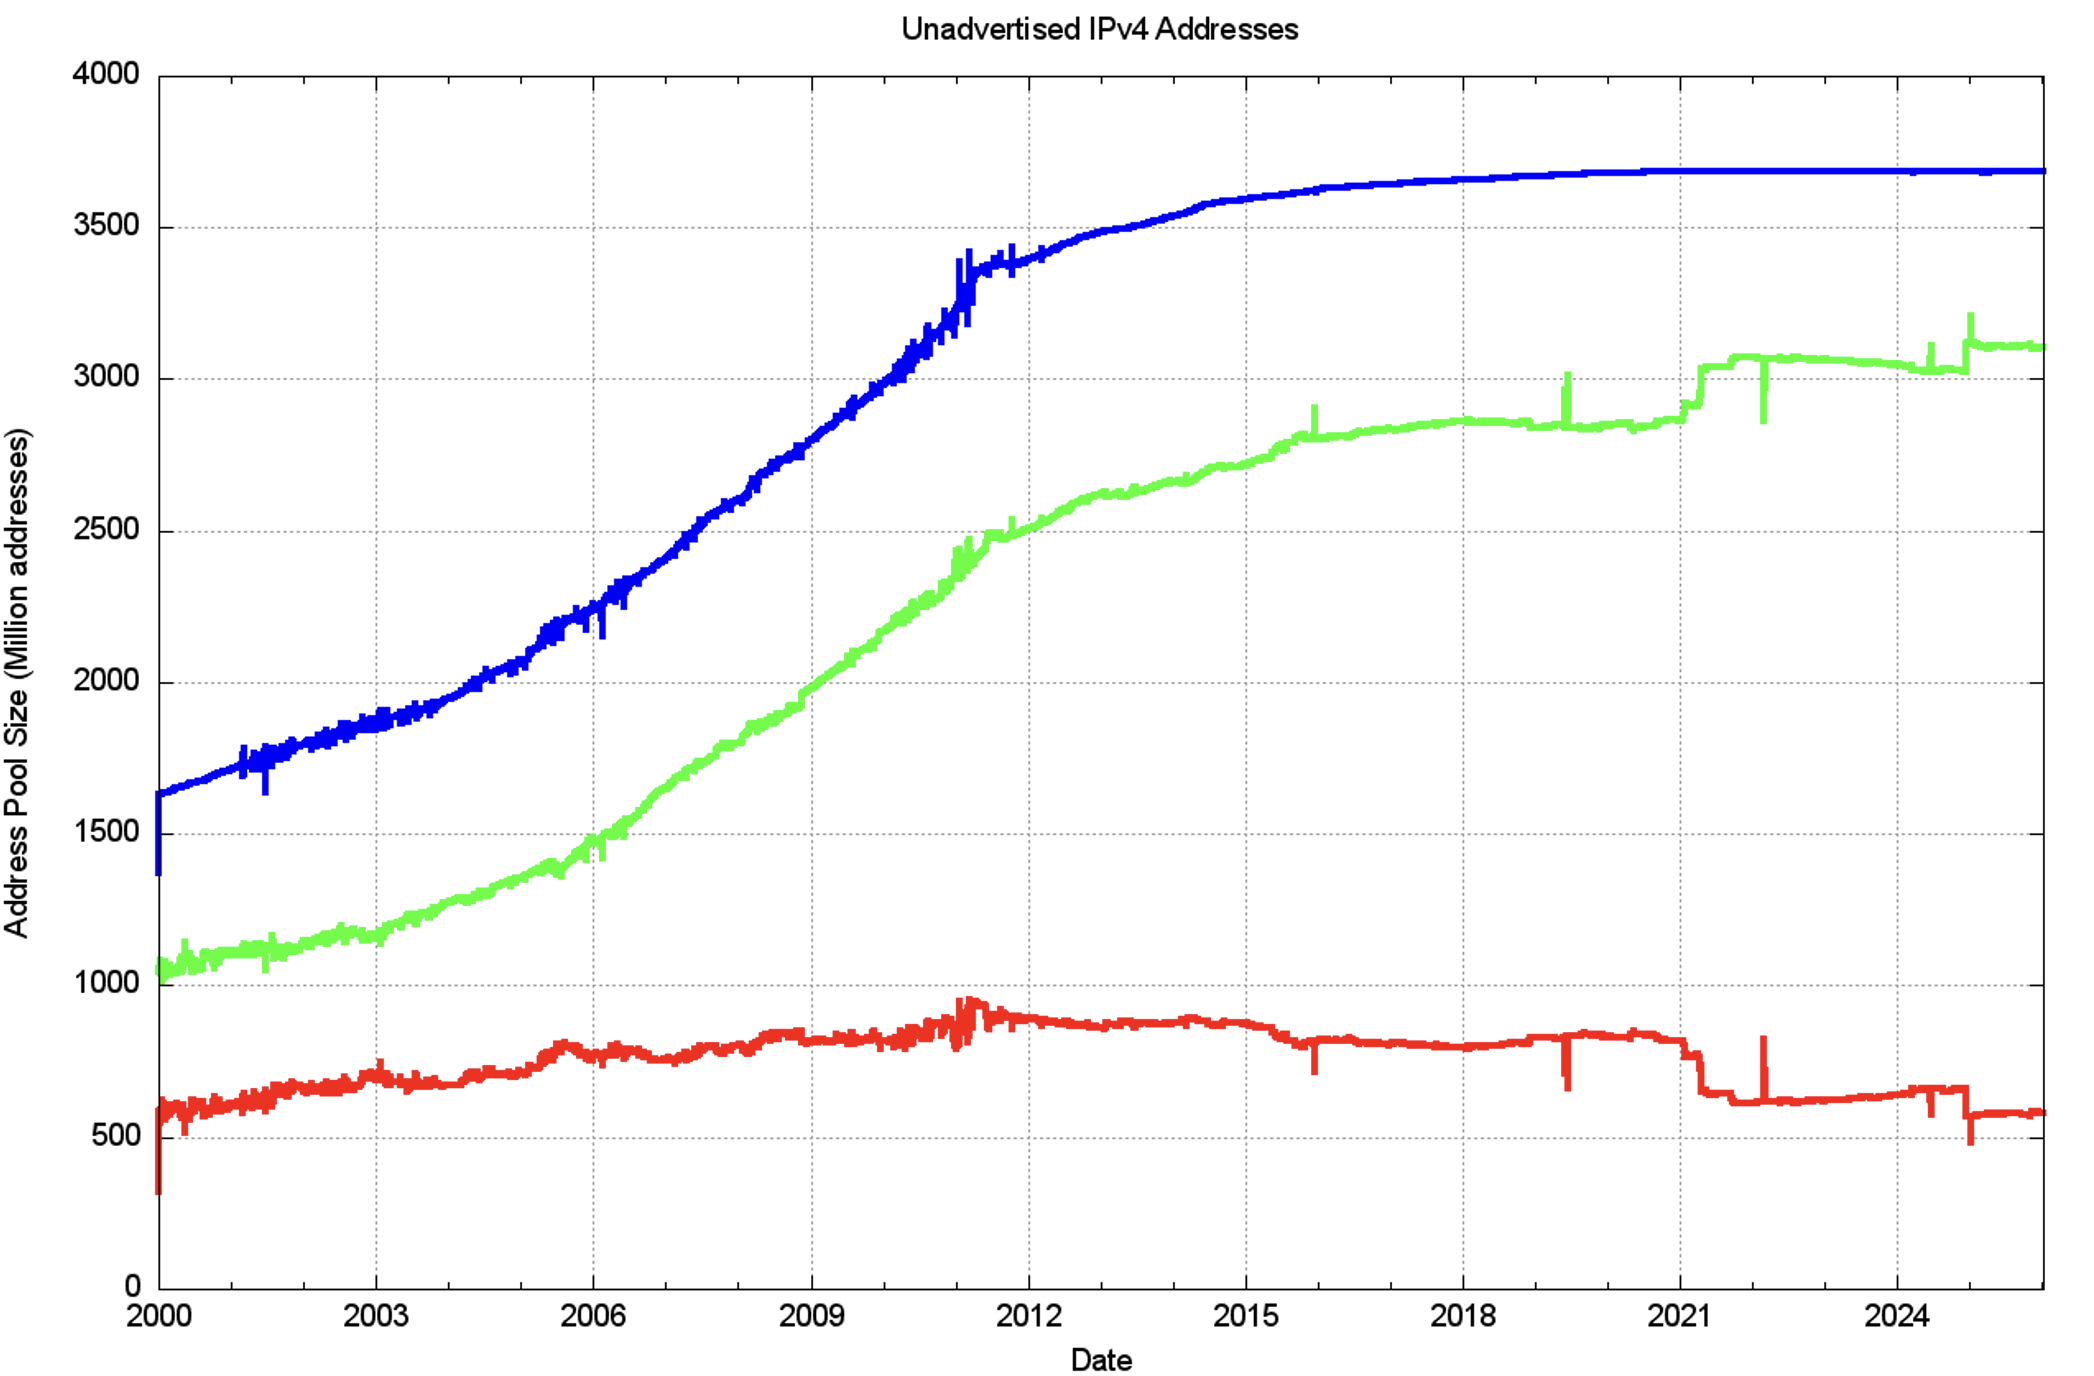
The larger picture of the three IPv4 address pool sizes, allocated, advertised, and unadvertised address pools since the start of 2000, is shown in Figure 6. The onset of more restrictive address policies coincides with the exhaustion of the central IANA unallocated address pool in early 2011, and the period since that date has seen the RIRs run down their address pools.
We can also look at the year 2025 and the changes in these address pools since the start of the year, as shown in Figure 7. The total span of advertised addresses fell by a total of 10M addresses through the year.
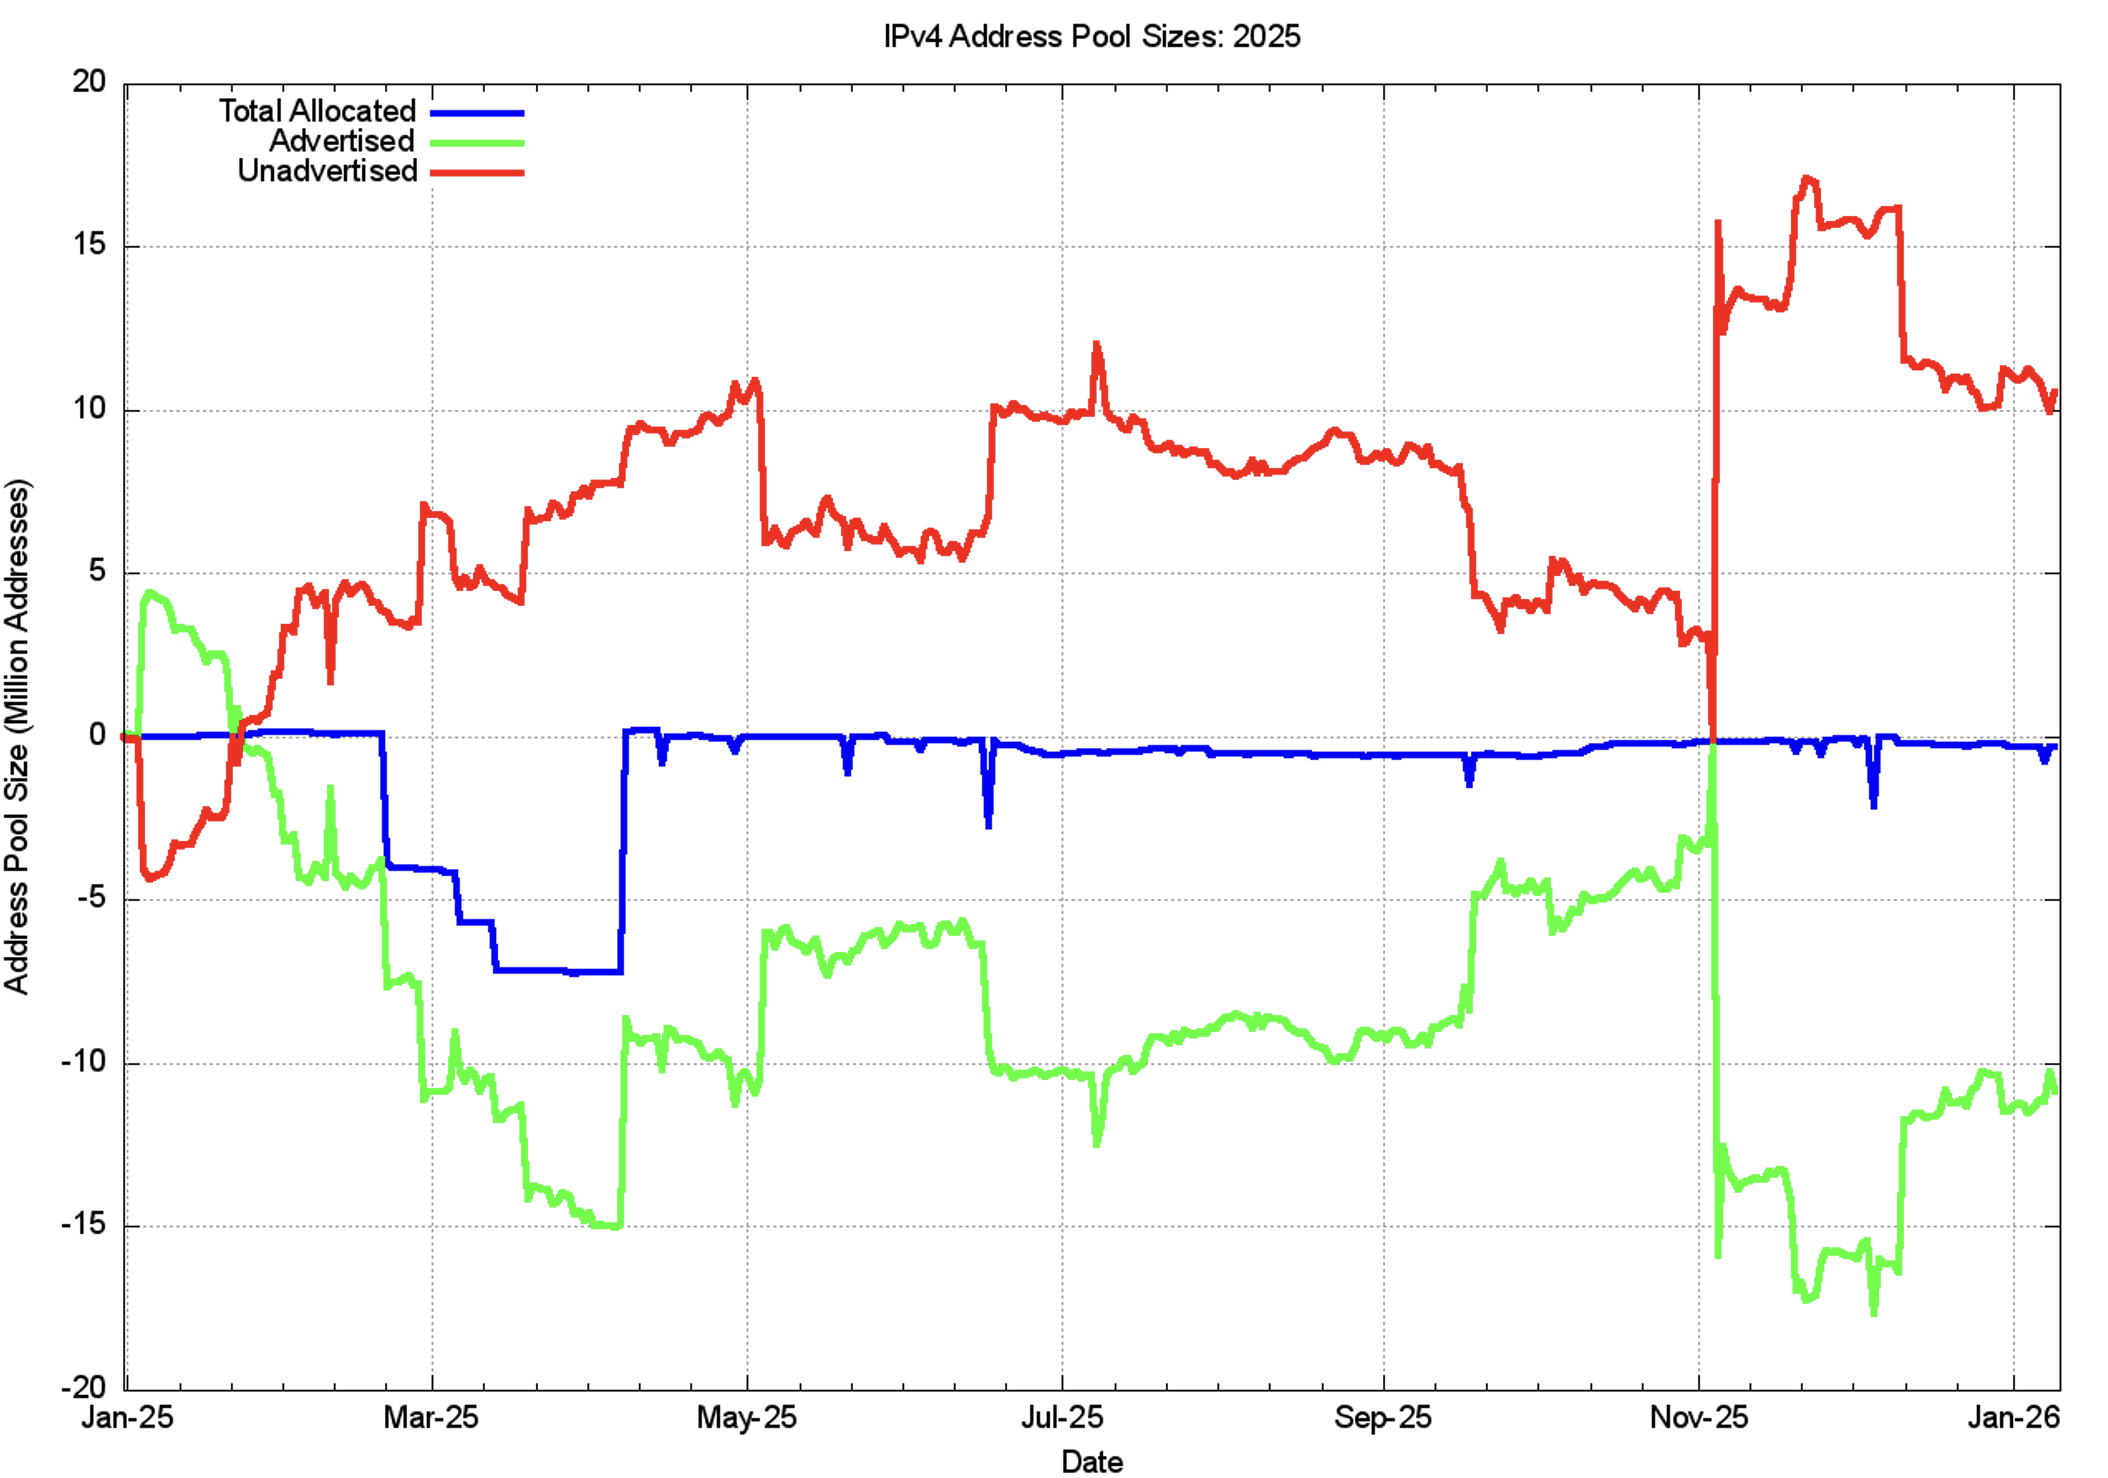
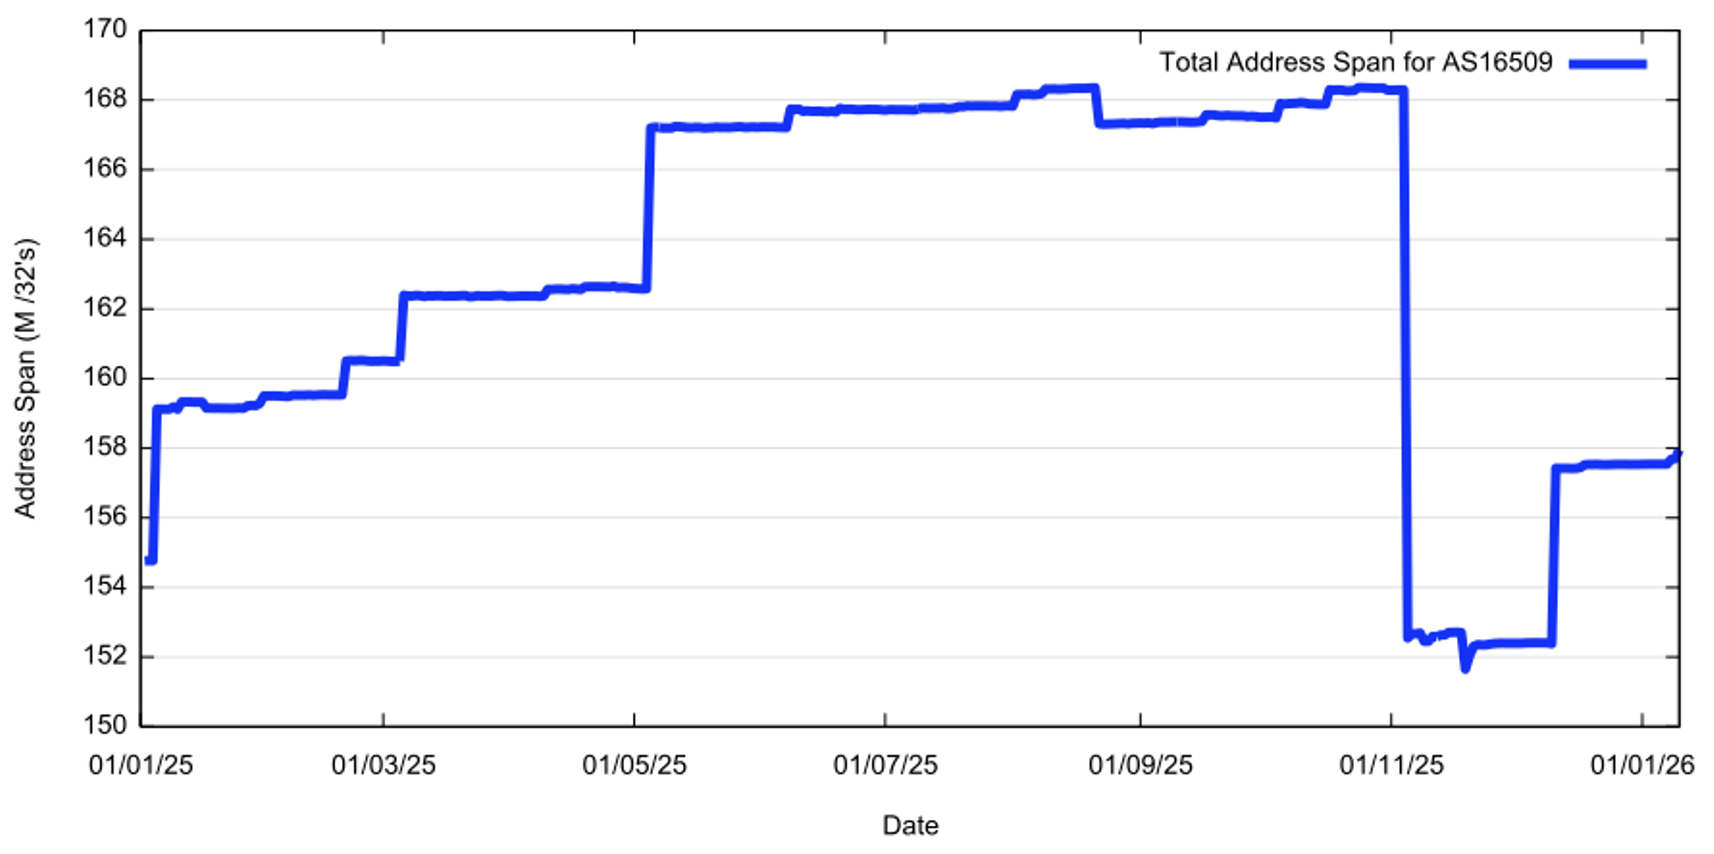
Four of the major step changes through the year in the advertised address span (5 January, 5 May, 5 November, and 11 December 2025) can be attributed to AS16509 (Amazon 02). The day-by-day record of the total address span advertised by this AS is shown in Figure 8. Amazon has advertised a total of an additional 12M addresses through 2025, peaking at 168M addresses at the start of November 2025. On 5 November 2025, Amazon stopped announcing a collection of prefixes with a total span of 15.744M addresses. A month later, on 10 December, 5.039M additional addresses were announced. This announcement brought the total span of addresses announced by Amazon’s AS16509 at the year’s end to 157.425 addresses, just 2.777M more than the 154.763M addresses that were announced at the start of 2025.
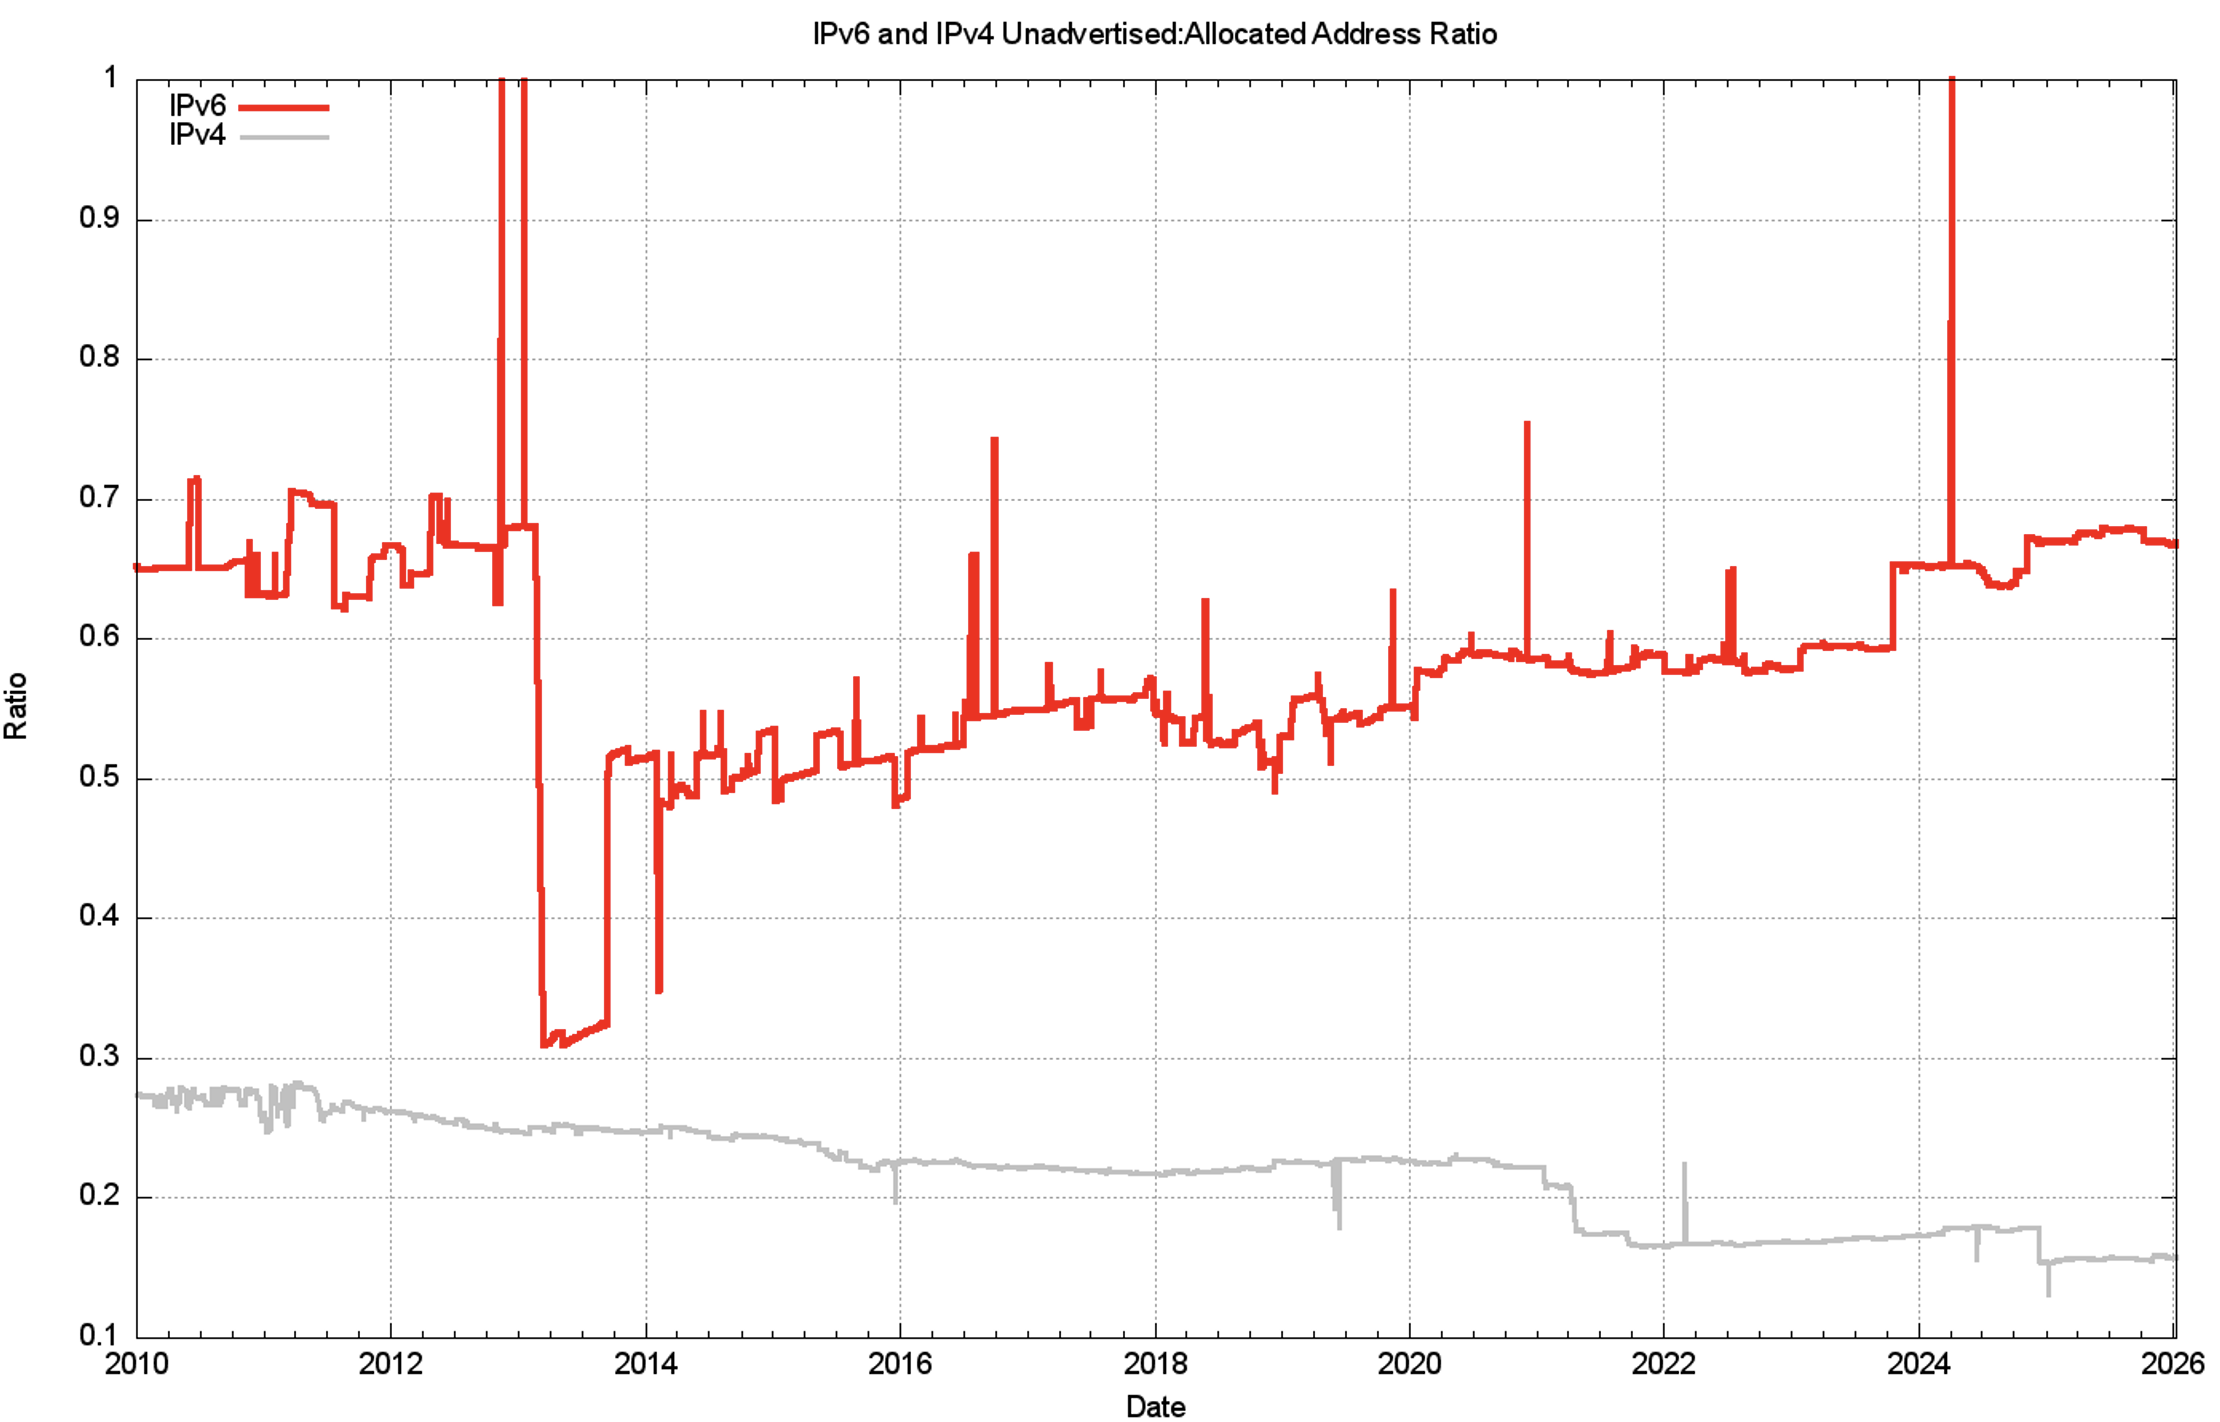
Expressed as a proportion of the total pool of allocated IP addresses, the unadvertised address pool peaked at 38% of the total assigned address pool in early 2003. It then declined during the ensuing 15 years to a relatively low value of 22% at the start of 2018. The ratio has been steadily climbing since that date, with abrupt falls due to the advertisement of the legacy US DoD address space in 2021, and the Amazon address announcements in December 2024 (Figure 9). The unadvertised address space now sits at 16% of the total assigned address pool.
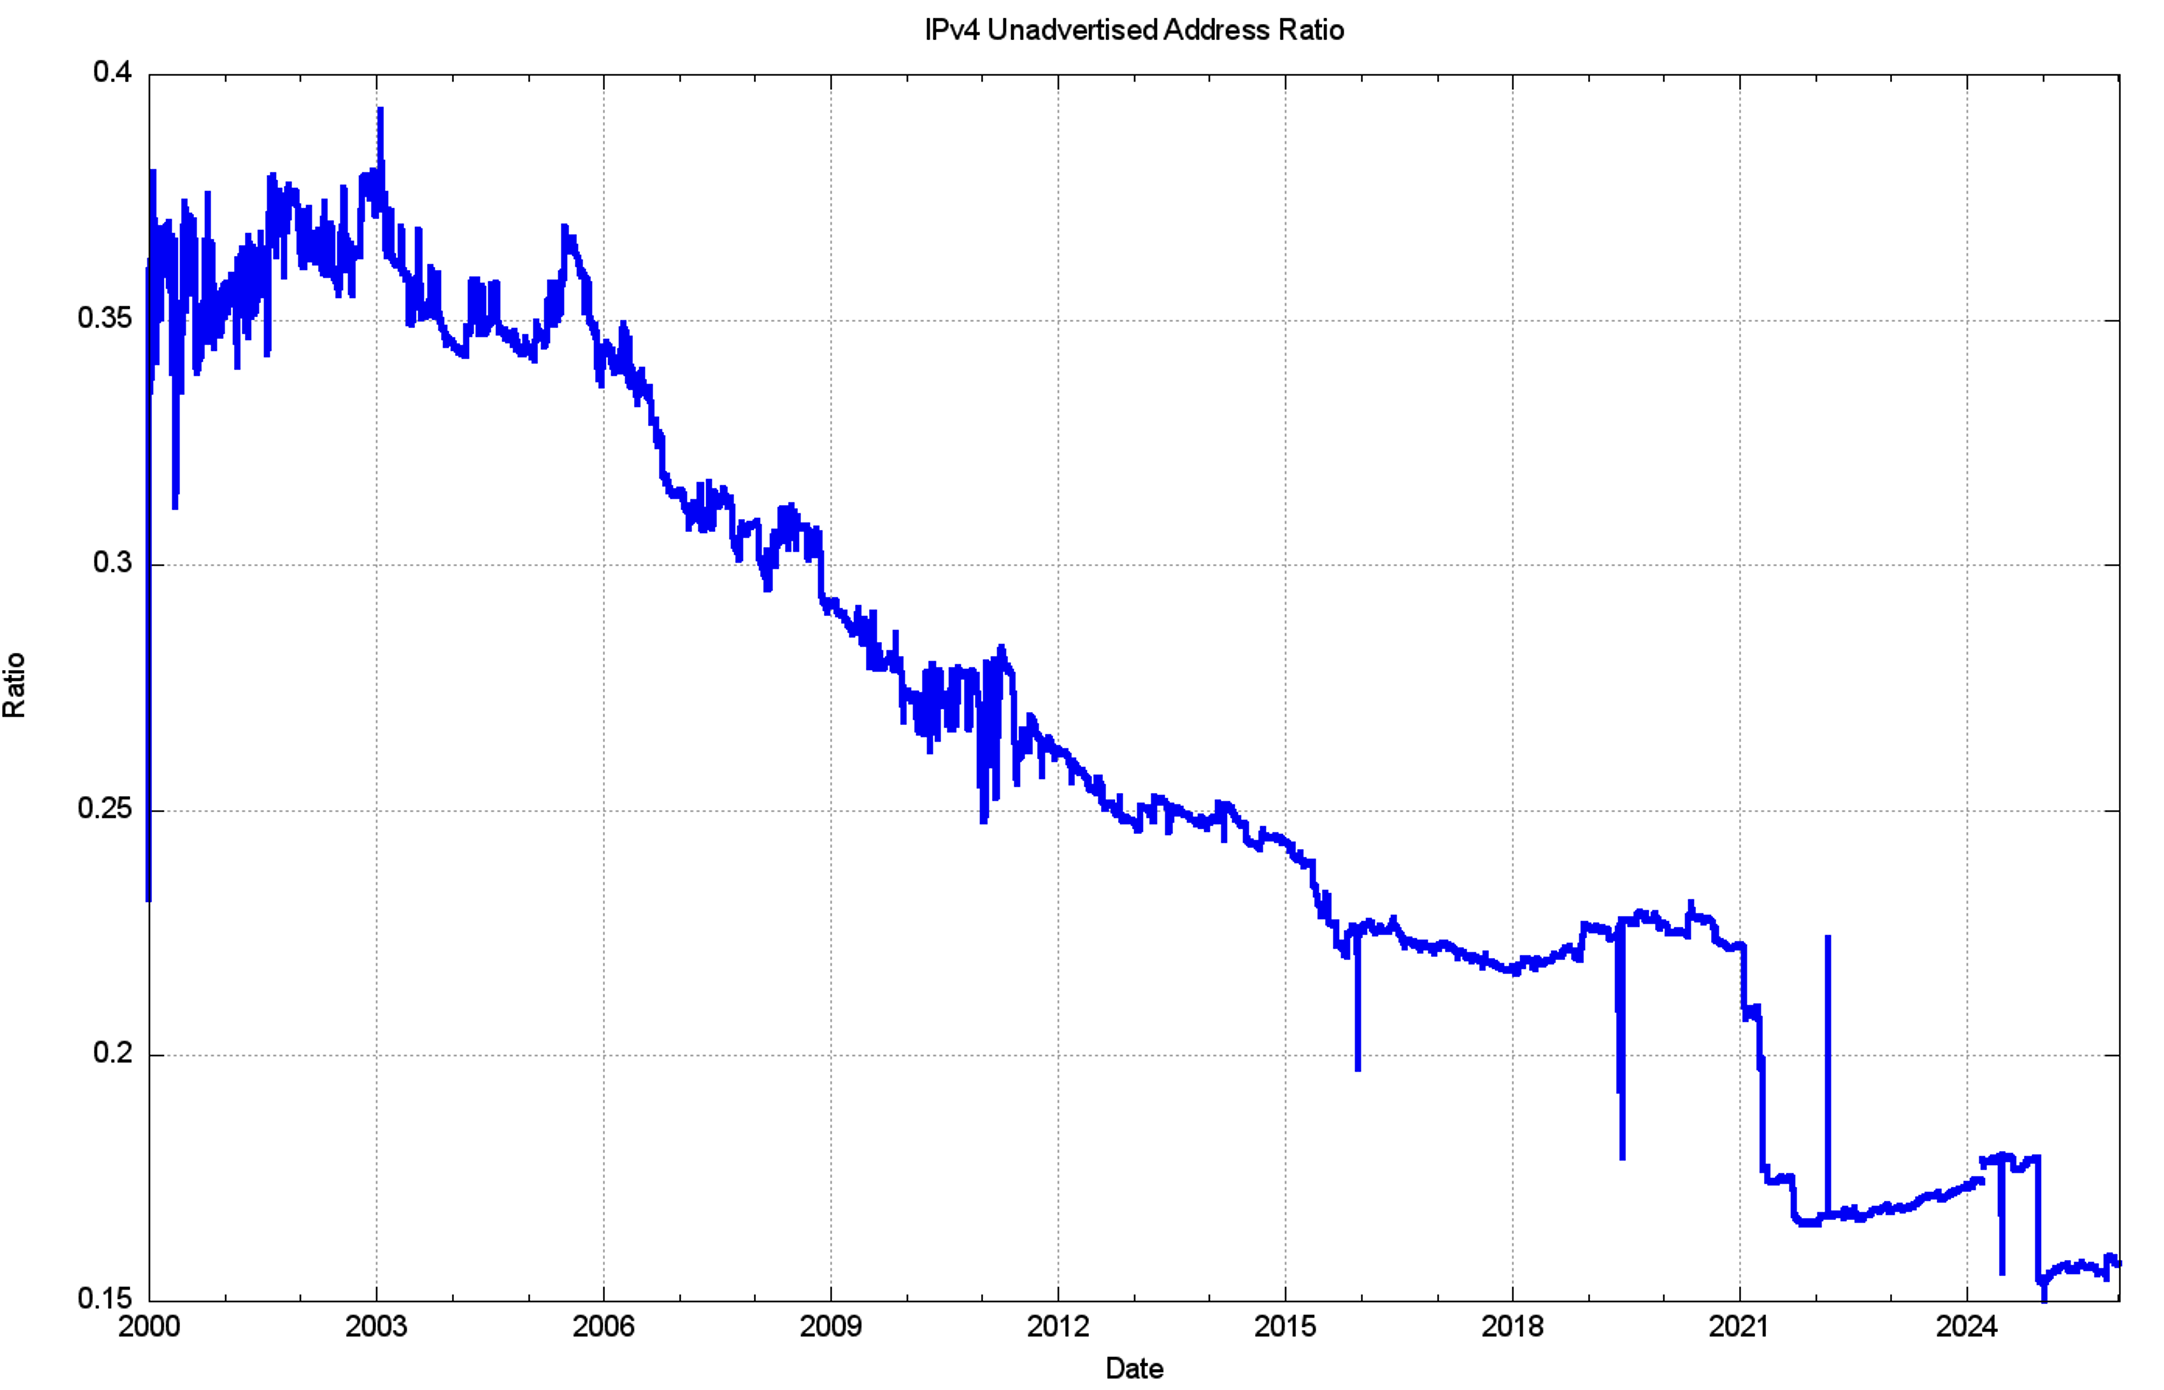
The data behind Figure 9 gives the impression of a steady effort to recycle otherwise idle IP addresses during the past 25 years.
The transfer data points to a somewhat sluggish transfer market. The number of transfer transactions is rising, but the total volume of transferred addresses is falling for most RIRs, except the RIPE NCC (Tables 4 and 5). The address market does not appear to have been effective in flushing out otherwise idle addresses and redeploying them into the routed network.
As with all other commodity markets, the market price of the commodity reflects the balancing of supply and demand, and the future expectations of supply and demand. What does the price of traded IPv4 addresses during the past 10 years tell us?
One of the address brokers, Hilco Streambank’s IPv4.Global, publishes the historical price information of transactions. Ideally, all the address brokers would do the same, as a market with open price information for transactions can operate more efficiently and fairly than markets with hidden price information. Figure 10 uses the Hilco Streambank IPv4.Global transaction data to produce a time series of address prices.
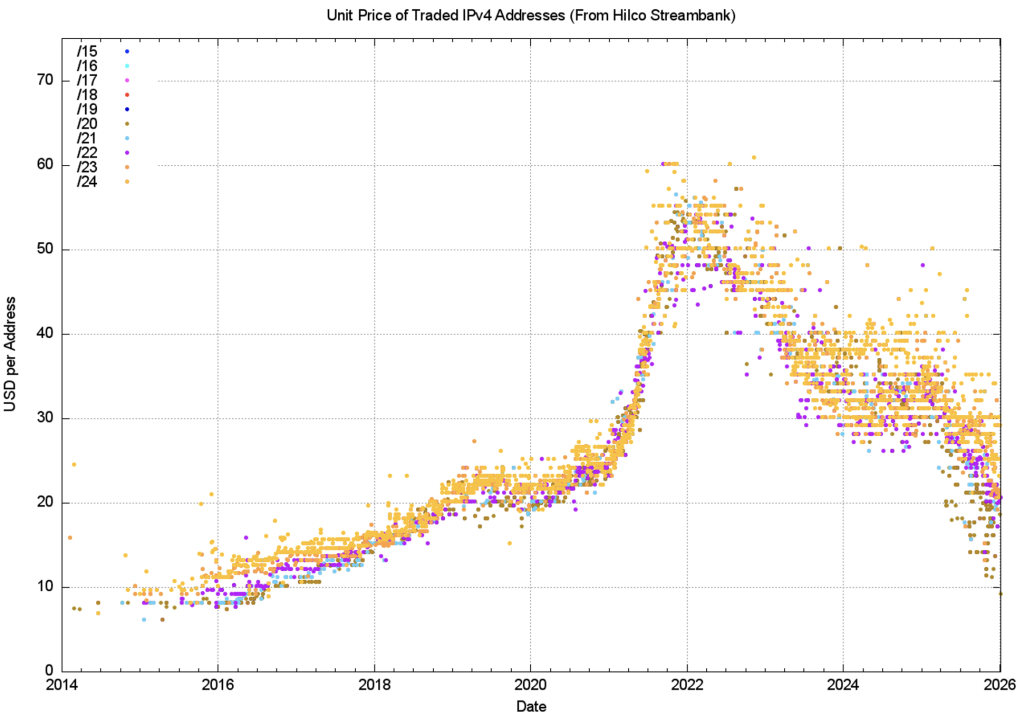
There are distinct behaviour modes in this time series data.
- Before 2016: A relatively low volume of transactions with stable pricing just below USD 10 per address.
- 2016 – 2019: The unit price doubled, with small blocks (/24s and /23s) attracting a price premium.
- 2019 – mid-2020: The price stabilized at between USD 20 and USD 25 per address, with large and small blocks trading at a similar unit price.
- Mid 2020 – 2022: An exponential rise in prices, and the unit price lifted to between USD 45 and USD 60 per address by the end of 2021.
- 2022: The average market price dropped across the year, but the variance in prices increased, and trades at the end of the year were recorded at prices of between USD 40 and USD 60 per address.
- 2024: The price decline continues, and by the end of 2023, IPv4 addresses were traded at unit prices of between USD 26 and USD 40.
- 2024 – 2025: Prices of addresses across 2024 were relatively stable, but the price decline resumed across 2025, with a low of USD 9 per address (for a /14) and a mean of USD 22 per address in the most recent 40 days (up to 10 January 2026).
The average monthly prices for each prefix size in the most recent 25 months are shown in Figure 11.
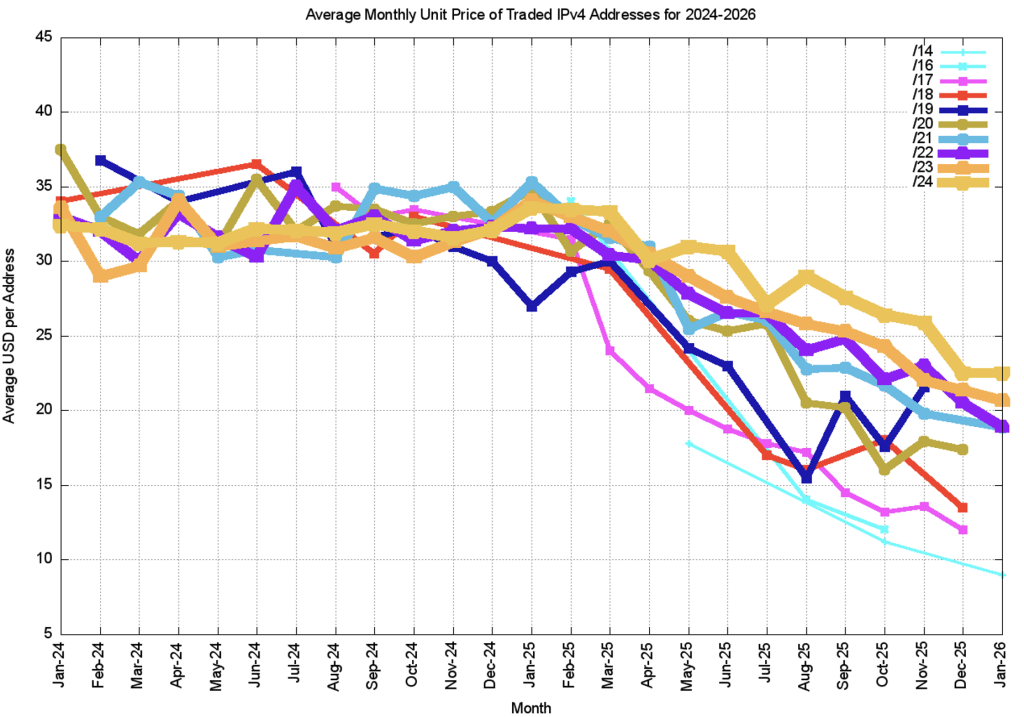
If prices are reflective of supply and demand, it appears that the initial period from 2014 to 2022 saw demand increase at a far greater level than supply. The price escalation reflected some form of perceived scarcity premium being applied to addresses. The subsequent price slump shows that this perception was short-lived.
These days, the low price of USD 9 per address is back to the same price that was seen in 2014. The difference this time is that the range of prices is far greater, and while the mean price is around USD 22 per address, the price in an individual transaction is as high as USD 34 per address. Generally, larger address blocks fetch a lower price per address in the market, and the January 2026 sale for USD 9 per address was for a /14 address block.
What is this price data telling us? If you were hanging onto some idle IPv4 address hoping for the price to rise, then you may have missed out! If you were looking to fund your costs in transition from an IPv4-only platform to a dual-stack through the sale of part of your IPv4 address holdings, then that opportunity may have already passed you by. If you are forecasting a future demand for more IPv4 addresses in your enterprise, then there is no urgency to hit the market and secure IPv4 addresses. If you wait, then the price is likely to drop further.
The largest buyer in the IPv4 market was Amazon, meeting demands from enterprise customers of their cloud-based products — a sector that has been conservative in their moves to transition into a dual-stack situation. I think it’s reasonable to suppose that they saw the price escalation in the period 2014 to 2018 as a signal of a longer-term trend. Securing as many IPv4 addresses as they anticipated needing in the future made sense in a rising market.
Once the big data centre buyers had secured their address inventory, they then exited the market, and the rest of the buyers had insufficient volume to sustain the price. Demand fell off, and the price slumped from the start of 2022 onward.
It’s not as if the IPv4 address market has collapsed completely. Figure 4 shows that in 2025, 33M IPv4 addresses were transferred within the RIR system. The declining price suggests that supply is running higher than demand. While buyers appear to be willing to pay a price premium to purchase from a preferred registry or with a preferred provenance, the average price per address has dropped by 50% across 2025.
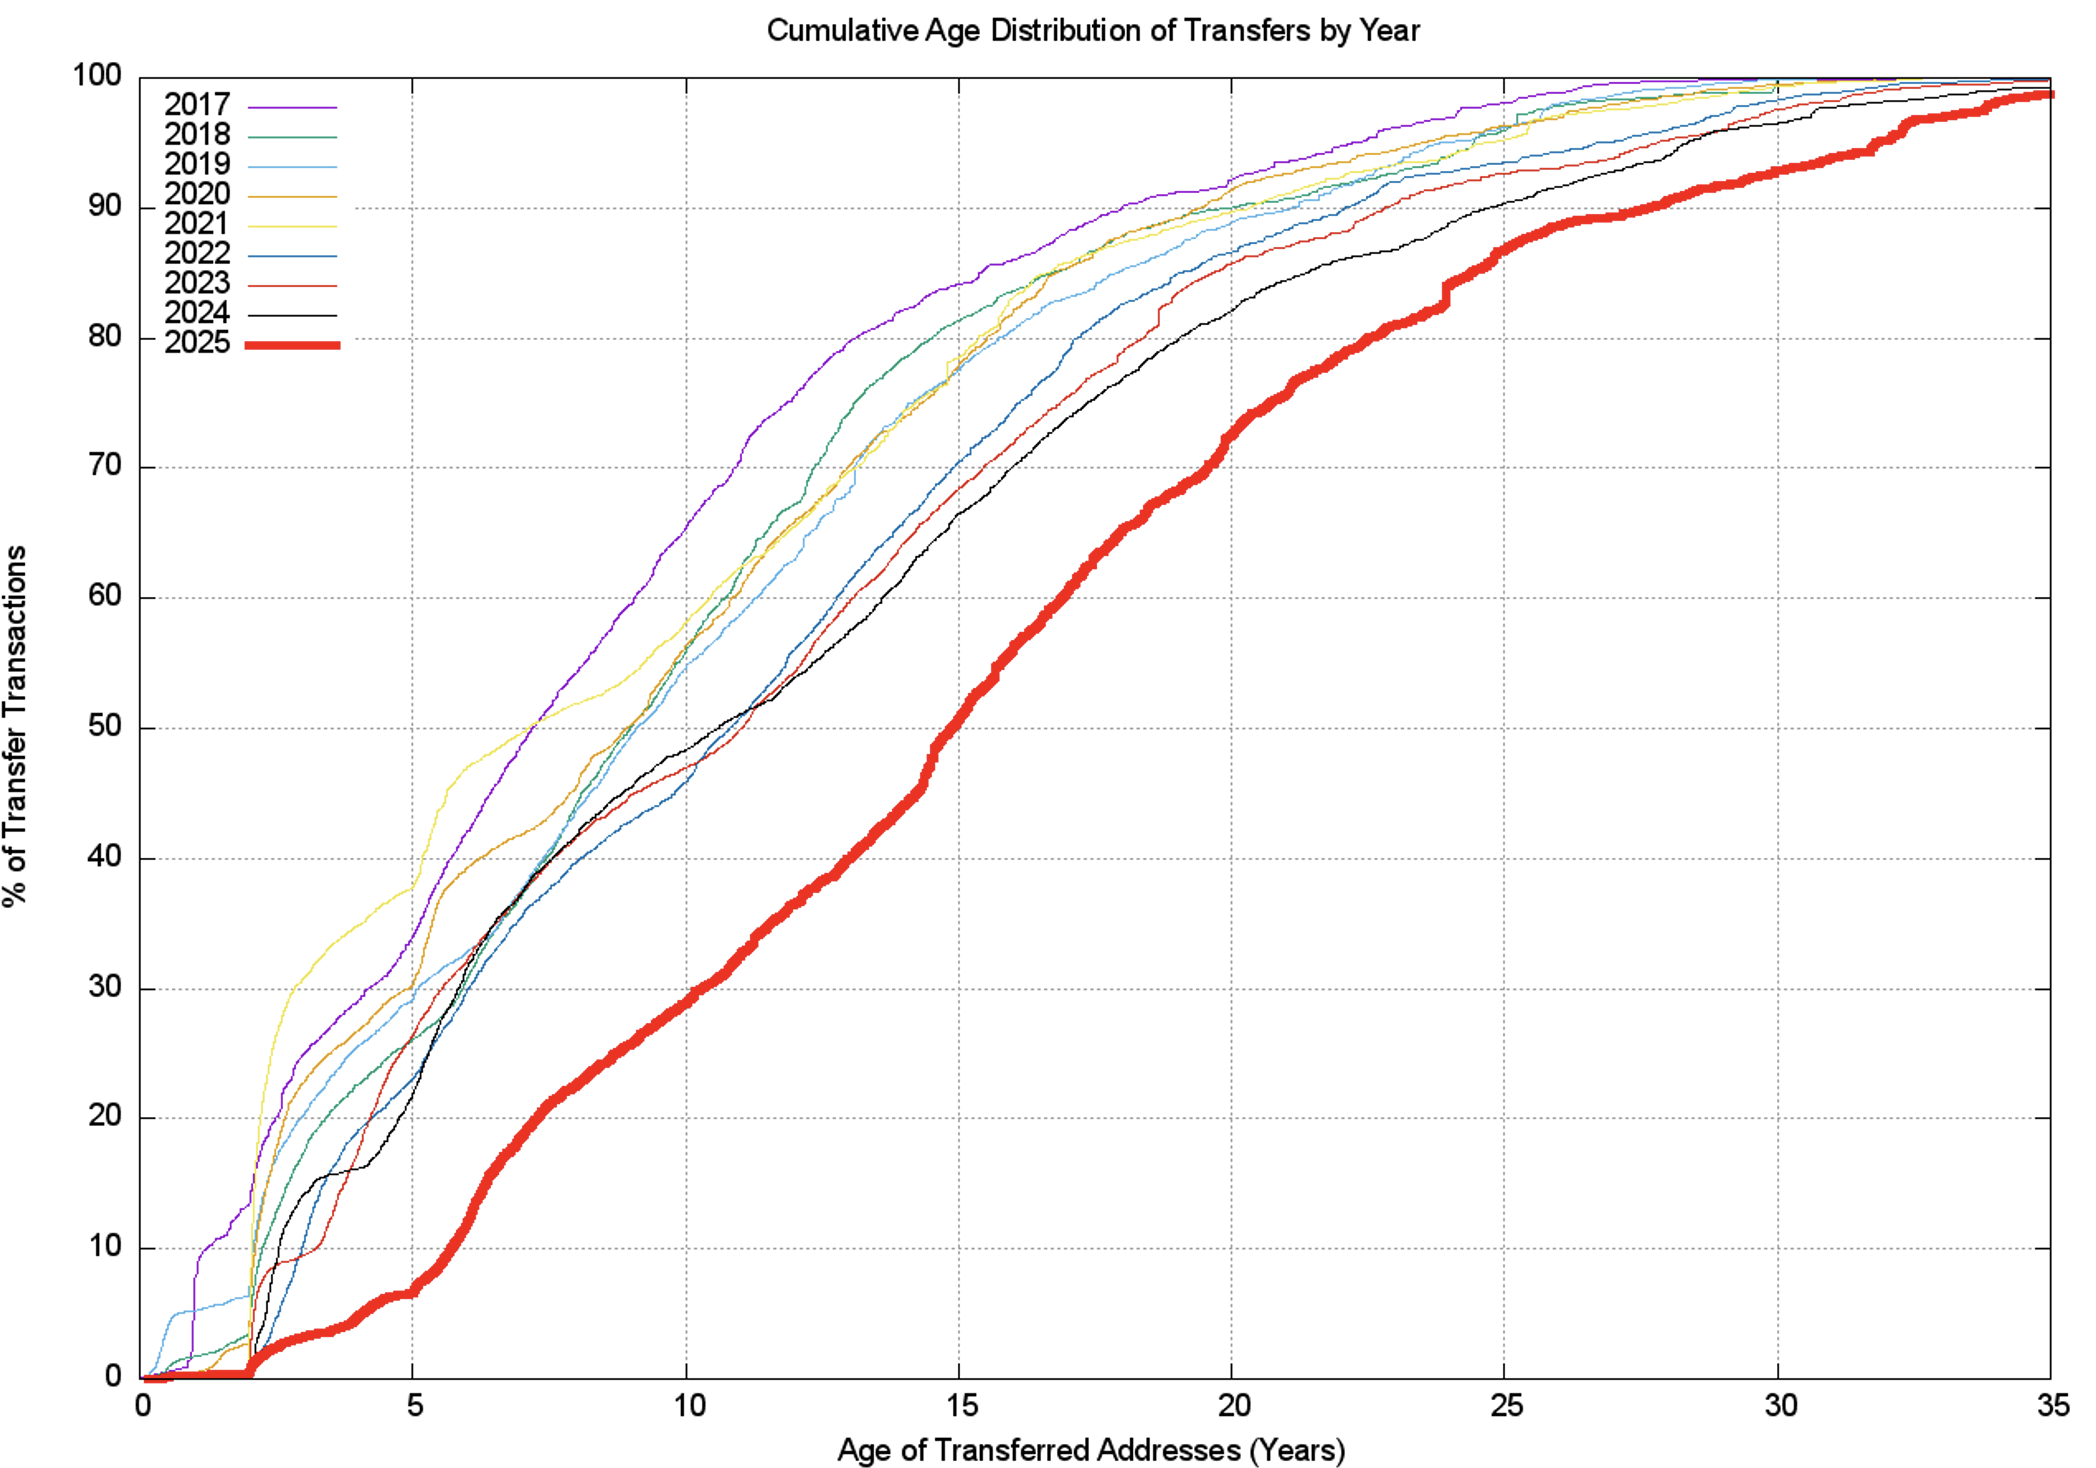
Are there any supply-side issues in the market? Is the supply of tradable IPv4 addresses declining? One way to provide some insight into answering this question is to look at the registration age of transferred addresses. Are such addresses predominantly recently allocated addresses? Or are they longer held address addresses, where the holder wants to realize the inherent value in otherwise unused assets? The basic question concerns the age distribution of transferred addresses, where the age of an address reflects the period since it was first allocated or assigned by the RIR system.
The cumulative age distribution of transferred addresses by transaction is shown on a year-by-year basis in Figures 12 and 13.
In the period of 2019 to 2021, a visible subset of address holders appeared to hold recently allocated addresses for the policy-mandated minimum holding period of two years, and then transfer these addresses on the market. In previous years, about 5% of addresses that were transferred were originally allocated up to five years before the transfer.
In 2022, this number fell to 4% which is presumably related to the smaller volumes of address allocations in 2022 rather than any change in the behaviour of address holders.
In 2023 and 2024, this behaviour has all but disappeared, due to the very small volume of address allocations by the RIRs rather than any change in the behaviour of address holders.
The bulk of transferred addresses in 2025 (more than 55% of the total volume) were originally allocated between 13 and 25 years ago, or between 2000 and 2012.
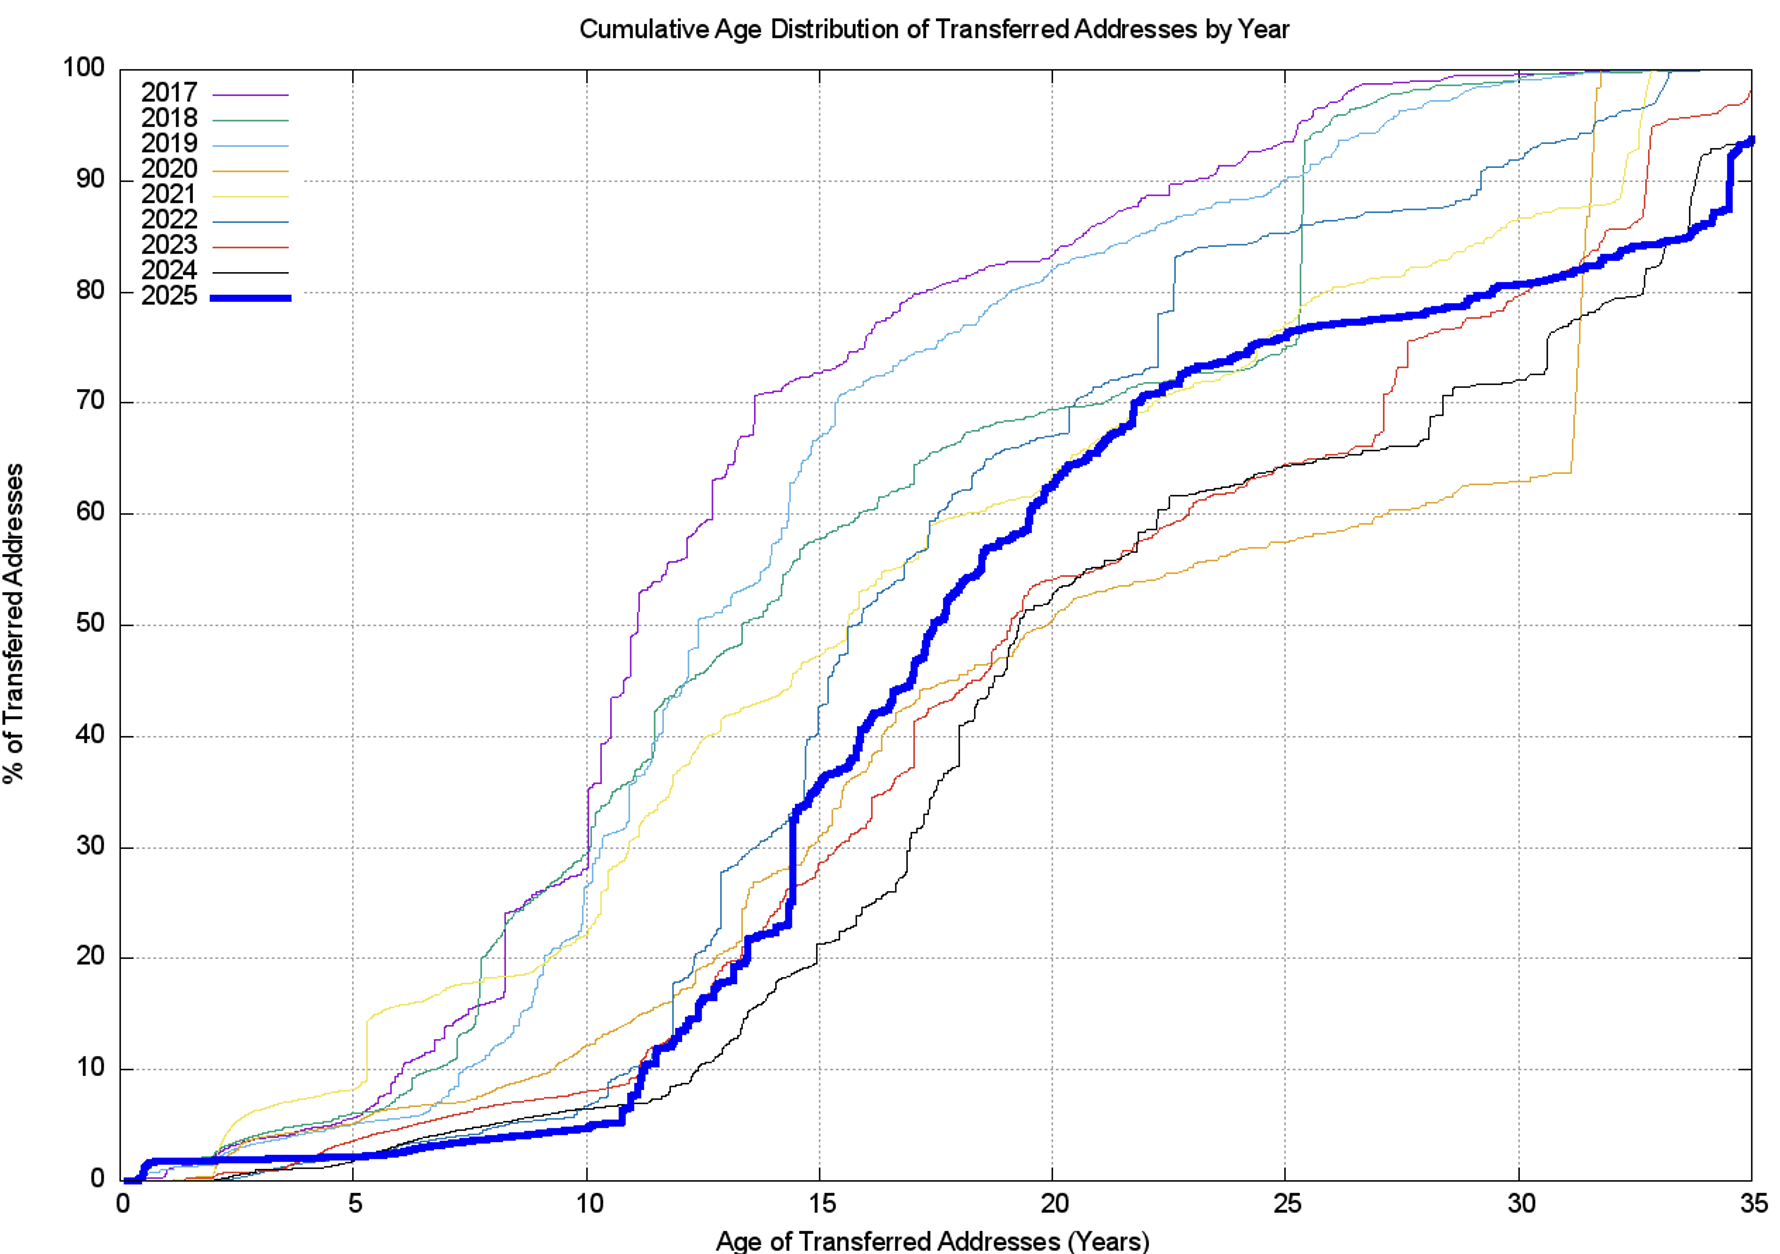
Figure 13 shows the cumulative age distribution of transfer transactions (as distinct from the volume of transferred addresses). The disparity between the two distributions for 2025 shows that recent individual allocations have been far smaller in size, but are still being traded. About 20% of the recorded transfer transactions in 2025 refer to an address prefix that was allocated within the past seven years, yet these transactions encompass less than 2% of the inventory of transferred addresses in 2025. About 40% of the volume of transferred addresses were originally allocated 20 or more years ago, while these transactions are recorded in just 28% of the transfers recorded in 2025.
There appear to be several motivations driving the transfer process.
One is that when demand outstrips supply, price escalation is an inevitable consequence. This may motivate some network operators to purchase addresses early, in the expectation that they will encounter higher prices if they delay. This factor may motivate some address holders to defer the decision to sell their addresses, in that delay will improve the price. Taken together, these motivations can impair market liquidity and create a feedback loop that causes price escalation. This factor appeared to be a major issue in the period between 2019 and 2022, but these days the opposite is the case, and supply far outstrips demand in the address market.
The second factor is IPv6 deployment. Many applications prefer to use IPv6 over IPv4 if they can, thanks to the so-called ‘Happy Eyeballs’ algorithm for protocol selection. In dual-stack networks, applications preferring IPv6 lead to lower IPv4 traffic volume, and lower the consumption pressure on their IPv4 Carrier Grade Network Address Translation (CGNAT) address pools. This reduces their ongoing demand for IPv4 address space. Reduced demand for additional IPv4 addresses has an impact on the market price. A falling market price acts as a motivation for sellers to bring their unused address inventory to market sooner, as further delay will only result in a lower price.
The overriding feature of this address market is the level of uncertainty within the market over the state of the IPv6 transition, coupled with the uncertainty over the further growth of the network. This high degree of uncertainty may lie behind the high variance of individual transfer transaction prices, as shown in Figure 10 for 2025. Have we managed to deploy enough network infrastructure in both IPv4 and IPv6 to get ahead of the demand pressures? Are we now looking at a market saturated with enough addresses and associated service platform infrastructure?
Do transfers fragment the address space?
The next question is whether the transfer process is further fragmenting the address space by splitting up larger address blocks into successively smaller address blocks. There are 56,629 transactions described in the RIR transfer registries from the start of 2012 until the start of 2026. Of these, 14,831 entries list transferred address blocks that are smaller than the original allocated block. In other words, about 26% of transfers implicitly fragment the original allocation.
These 14,831 transfer entries that have fragmented the original allocation are drawn from 9,231 original allocations. On average, the original allocation is split into 1.9 smaller address blocks. This data implies that the address blocks are being fragmented as a result of address transfers, but in absolute terms, this is not a major issue. There are 253,021 distinct IPv4 address allocation records in the RIRs registries as of the end of 2025, and the fragmentation reflected in 14,831 more specific entries of original allocation address blocks represents around 5.9% of the total pool of allocated address prefixes.
Imports and exports of addresses
The next question concerns the international flow of transferred addresses. Let’s look at the:
- Ten economies that sourced the greatest volume of transferred addresses, no matter their destination (including ‘domestic’ transfers within the same economy) (Table 6).
- Ten largest recipients of transfers (Table 7).
- Ten largest international address transfers (Table 8).
We will use the RIR-published transfer data for the year 2024 as the basis for these tables.
| Rank | CC | Addresses | Source economy |
| 1 | US | 11,747,840 | USA |
| 2 | BR | 7,113,216 | Brazil |
| 3 | DE | 4,375,552 | Germany |
| 4 | GB | 2,706,432 | Ukraine |
| 5 | IT | 778,240 | Italy |
| 6 | ES | 655,872 | Spain |
| 7 | IR | 488,960 | Iran |
| 8 | NL | 479,232 | Netherlands |
| 9 | RU | 451,072 | Russian Federation |
| 10 | JP | 436,224 | Japan |
| 11 | AU | 369,408 | Australia |
| 12 | CN | 295,936 | China |
| 13 | UA | 283,136 | Ukraine |
| 14 | HK | 280,576 | Hong Kong (SAR) |
| 15 | IN | 277,248 | India |
| 16 | IE | 236,544 | Ireland |
| 17 | SE | 187,136 | Sweden |
| 18 | KR | 184,064 | Republic of Korea |
| 19 | FR | 182,272 | France |
| 20 | CZ | 180,224 | Czech Republic |
Table 6 — Top 10 economies sourcing transferred IPv4 addresses in 2025.
| Rank | CC | Addresses | Destination economy |
| 1 | GB | 7,581,696 | Ukraine |
| 2 | US | 5,460,736 | USA |
| 3 | DE | 5,201,664 | Germany |
| 4 | BR | 4,082,944 | Brazil |
| 5 | SG | 1,248,768 | Singapore |
| 6 | IT | 1,021,696 | Italy |
| 7 | RU | 777,216 | Russian Federation |
| 8 | ES | 669,184 | Spain |
| 9 | NL | 622,080 | Netherlands |
| 10 | SE | 482,816 | Sweden |
| 11 | IN | 381,952 | India |
| 12 | HK | 343,040 | Hong Kong (SAR) |
| 13 | FR | 329,728 | France |
| 14 | UA | 264,192 | Ukraine |
| 15 | SA | 256,512 | Saudi Arabia |
| 16 | AE | 256,256 | United Arab Emirates |
| 17 | KR | 250,368 | Republic of Korea |
| 18 | CN | 243,712 | China |
| 19 | ID | 240,128 | Indonesia |
| 20 | JP | 229,120 | Japan |
Table 7 — Top 10 economies receiving transferred IPv4 addresses in 2025.
There are many caveats about this data collection, particularly relating to the precise meaning of this economy-based geolocation. Even if we use only the CC entry in the RIR registry records, we get a variety of meanings.
Some RIRs use the principle that the CC corresponds to the physical location of the headquarters of the holder of the addresses, no matter where the addresses are used on the Internet. Other RIRs allow the holder to update this geolocation entry to match where the addresses will be used.
It’s generally not possible to confirm the holder’s assertion of location, so whether these self-managed records reflect the actual location of the addresses or reflect a location of convenience is not always possible to determine.
Geolocation services, like MaxMind, face similar challenges in providing a geographic location service. At times, this is not easy to establish, such as with tunnels used in VPNs. Is the ‘correct’ location the location of the tunnel ingress, or egress? Many of the fine-grained differences in geolocation services reflect how these location services have responded.
There’s also the issue of cloud-based services. If the cloud uses conventional unicast, the addresses used may be fluid across the cloud service’s points of presence based on distributing addresses to meet the demands for the service. The bottom line is that these location listings are a ‘fuzzy’ approximation rather than a precise location.
With that in mind, let’s now look at imports and exports of addresses in 2025 transfers, where the source and destination of the transfers are in different economies. About 2,421 transfers appear to result in a movement of addresses between economies, involving a total of 18,729,216 addresses. The 20 largest economy pairs are shown in Table 8.
| Rank | From | To | Addresses (M) | Source | Destination |
| 1 | US | GB | 5,880,576 | USA | UK |
| 2 | BR | US | 2,682,880 | Brazil | USA |
| 3 | US | DE | 935,936 | USA | Germany |
| 4 | DE | US | 560,384 | Germany | USA |
| 5 | BR | SG | 458,752 | Brazil | Singapore |
| 6 | US | SG | 454,400 | USA | Singapore |
| 7 | US | ES | 395,264 | USA | Spain |
| 8 | JP | US | 286,720 | Japan | USA |
| 9 | GB | SE | 273,408 | UK | Sweden |
| 10 | GB | US | 235,008 | UK | USA |
| 11 | US | SA | 232,704 | USA | Saudi Arabia |
| 12 | AU | US | 219,648 | Australia | USA |
| 13 | US | LT | 214,016 | USA | Lithuania |
| 14 | GB | DE | 213,248 | UK | Germany |
| 15 | US | IT | 202,752 | USA | Italy |
| 16 | US | PA | 196,864 | USA | Panama |
| 17 | US | RU | 196,608 | USA | Russian Federation |
| 18 | US | BR | 196,608 | USA | Brazil |
| 19 | US | NL | 187,136 | USA | Netherlands |
| 20 | US | HK | 180,224 | USA | Hong Kong SAR |
Table 8 — Top 20 economy-to-economy IPv4 address transfers in 2025.
The 2025 transfer logs also contain 3,198 domestic address transfers, with a total of 14,261,856 addresses. The largest activity by address volume in domestic transfers is in Brazil (4M), Germany (4M), the UK (1.5M), the US (1.1M), Italy (0.8M) and the Russian Federation (0.4M).
A question about this transfer data is whether all address transfers have been recorded in the registry system. Registered transfers require conformance to registry policies, and it may be the case that only a subset of transfers are being recorded in the registry as a result. This can be somewhat challenging to detect, particularly if such a transfer is expressed as a lease or other form of temporary arrangement, and if the parties agree to keep the details of the transfer confidential.
It might be possible to place an upper bound on the volume of address movements that have occurred in any period by looking at the Internet’s routing system. We can look at addresses that were announced in 2025 by comparing the routing stable state at the start of the year with the table state at the end of the year (Table 9).
| January 2025 | January 2026 | Delta | Unchanged | Rehomed | Removed | Added | ||
| Prefixes | 995,963 | 1,049,909 | 53,946 | 878,092 | 29,699 | 88,172 | 142,118 | |
| Root prefixes: | 469,272 | 505,731 | 36,459 | 411,634 | 20,623 | 30,321 | 59,826 | |
| Address span (M) | 3,117.65 | 3,106.37 | -11.28 | 2,944.99 | 37.97 | 127.86 | 95.77 | |
| More specifics: | 526,691 | 544,178 | 17,487 | 294,126 | 9,076 | 57,851 | 82,292 | |
| Address span (M) | 899.75 | 872.16 | -27.59 | 773.50 | 19.84 | 81.49 | 89.05 |
Table 9 — IPv4 BGP changes during 2025.
While the routing table grew by 53,946 entries during the year, the nature of the change is slightly more involved. At some time through the year, 88,172 prefixes that were announced at the start of the year were removed from the routing system. By the end of the year, 142,118 prefixes were announced that were not announced at the start of the year. More transient prefixes may have appeared and been withdrawn throughout the year, of course, but here we are comparing two snapshots rather than looking at every update message. A further 29,699 prefixes had changed their originating Autonomous System Number (ASN), indicating some form of change in the prefix’s network location.
If we look at the complete collection of Border Gateway Protocol (BGP) updates seen from an individual BGP vantage point (AS131072) across all of 2025, we see a larger collection of transient address prefixes. A total of 1,270,968 distinct prefixes were observed through 2025. That implies that 221,059 additional prefixes were seen at some point through the year, starting from the initial set in January 2025.
We can compare these prefixes that changed in 2025 against the transfer logs for the two years 2024 and 2025. Table 10 shows the comparison of these routing numbers against the set of transfers that were logged in these two years.
| Type | Listed | Unlisted | Ratio |
| Rehomed | |||
| All | 1,991 | 26,722 | 6.9% |
| Root prefixes | 927 | 12,711 | 6.8% |
| Removed | |||
| All | 3,172 | 85,000 | 3.6% |
| Root prefixes | 1,869 | 285 | 86.8% |
| Added | |||
| All | 14,547 | 127,571 | 10.2% |
| Root prefixes | 12,686 | 47,140 | 21.2% |
Table 10 — Routing changes across 2024 compared to the transfer log entries for 2023 to 2024.
These figures show that 7% of changes in advertised addresses from the beginning to the end of the year are reflected as changes as recorded in RIR transfer logs. This shouldn’t imply that the remaining changes in advertised prefixes reflect unrecorded address transfers. There are many reasons for changes in the advertisement of an address prefix — a change in the administrative controller of the address is only one potential cause. It does establish some notional upper ceiling on the number of address movements in 2025, some of which relate to the transfer of operational control of an address block, that have not been captured in the transfer logs.
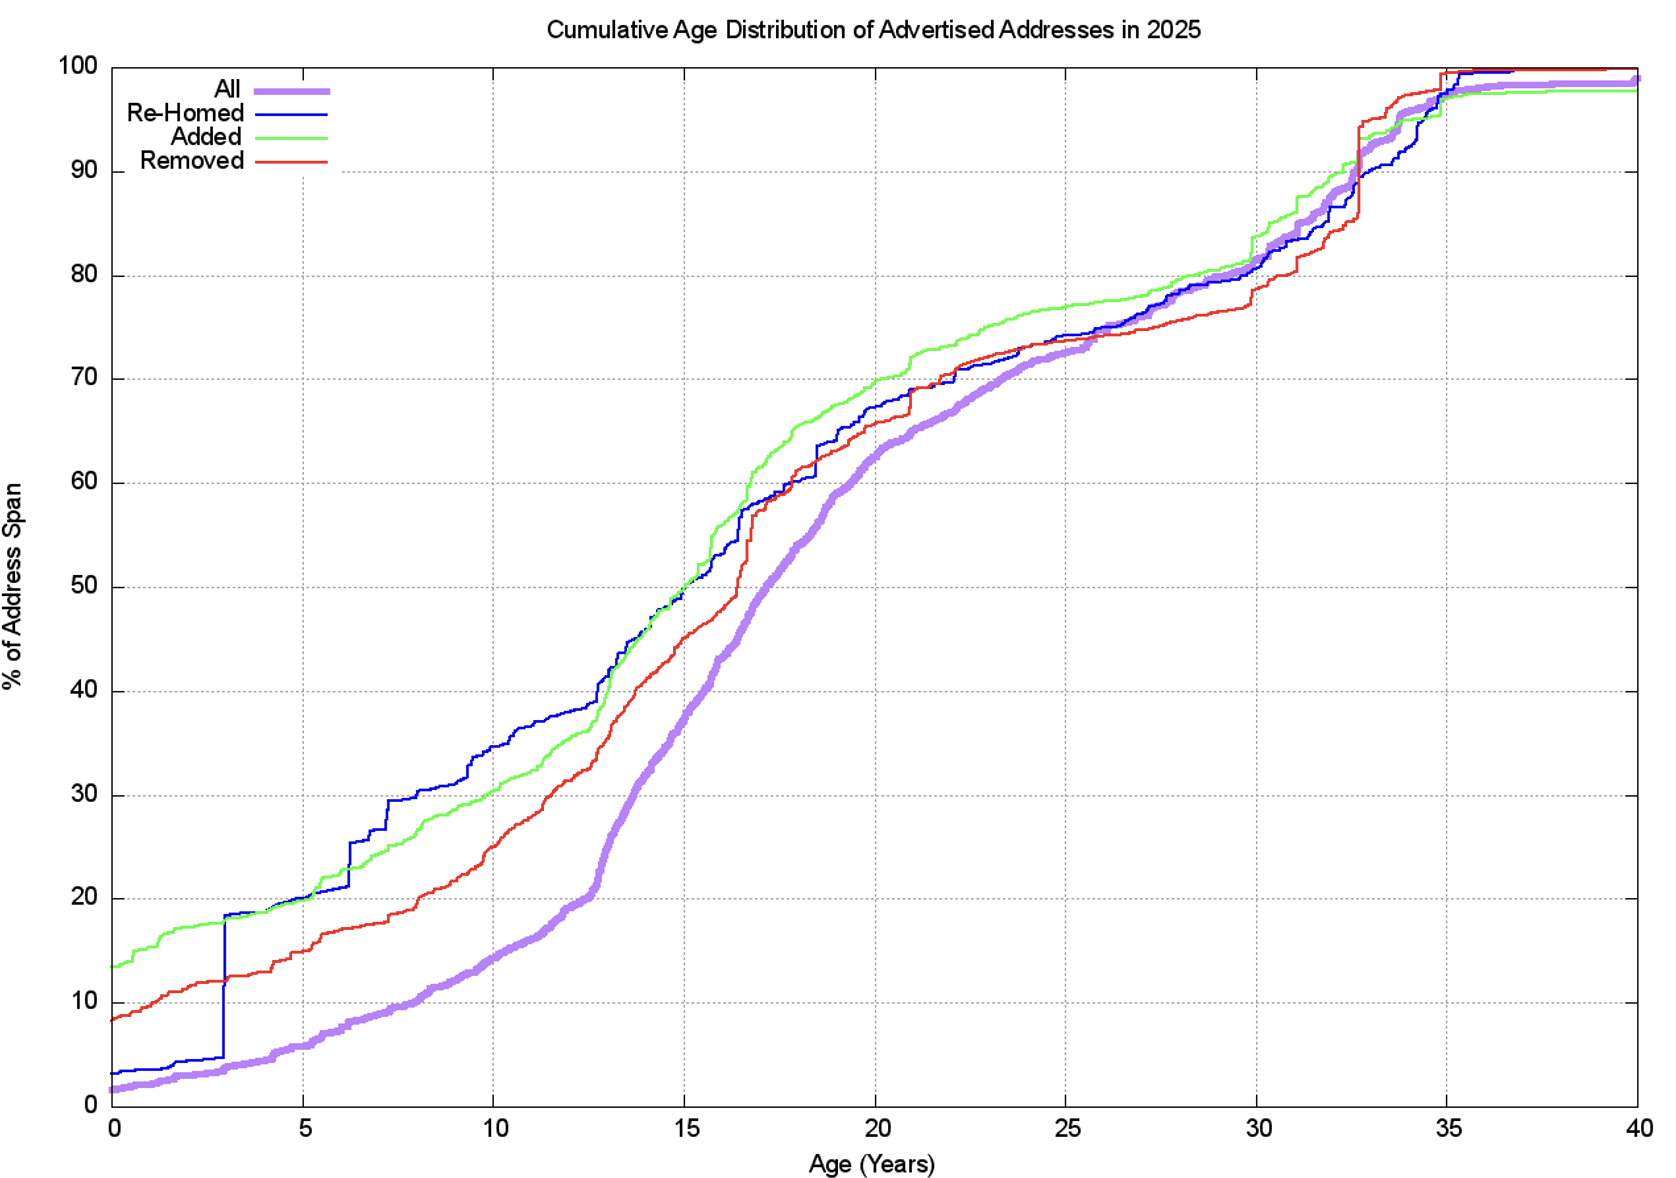
Finally, we can perform an age profile of the addresses that were added, removed, and rehomed during 2025, and compare it to the overall age profile of IPv4 addresses in the routing table. Figure 14 shows that address prefixes added to the routing table tend to be ‘younger’ than average. One half of all added address prefixes are 15 years old or less, while for all advertised address prefixes, 50% of such prefixes are 17 years old or younger. Prefixes that are changing their originating network (‘rehoming’) tend to be older than average, and 50% of all rehomed prefixes are 15 years old or older.
As IPv4 moves into its final stages, we are perhaps now in a position to take stock of the distribution of IPv4 addresses and look at where the addresses landed up. Table 11 shows the 20 economies that have the largest pools of allocated IPv4 addresses. I’ll note that a country code in an address registration reflects the economy where the address holder is located (the corporate location), and not necessarily the economy where the addresses will be deployed.
| Rank | CC | IPv4 pool | % Total | Per capita | Economy |
| 1 | US | 1,610,004,832 | 43.7% | 4.67 | USA |
| 2 | CN | 343,148,544 | 9.3% | 0.24 | China |
| 3 | JP | 188,742,464 | 5.1% | 1.55 | Japan |
| 4 | GB | 141,092,616 | 3.8% | 2.07 | UK |
| 5 | DE | 125,335,872 | 3.4% | 1.51 | Germany |
| 6 | KR | 112,490,496 | 3.1% | 2.18 | Republic of Korea |
| 7 | FR | 82,105,648 | 2.2% | 1.26 | France |
| 8 | BR | 79,973,120 | 2.2% | 0.36 | Brazil |
| 9 | CA | 67,666,432 | 1.8% | 1.71 | Canada |
| 10 | IT | 54,150,720 | 1.5% | 0.93 | Italy |
| 11 | NL | 47,845,216 | 1.3% | 2.70 | Netherlands |
| 12 | AU | 46,192,640 | 1.3% | 1.70 | Australia |
| 13 | RU | 44,887,360 | 1.2% | 0.31 | Russian Federation |
| 14 | IN | 41,819,648 | 1.1% | 0.03 | India |
| 15 | TW | 35,723,264 | 1.0% | 1.49 | Taiwan |
| 16 | ES | 32,186,752 | 0.9% | 0.68 | Spain |
| 17 | SE | 31,439,400 | 0.9% | 2.92 | Sweden |
| 18 | MX | 28,958,720 | 0.8% | 0.22 | Mexico |
| 19 | SG | 27,180,032 | 0.7% | 4.45 | Singapore |
| 20 | ZA | 27,145,216 | 0.7% | 0.44 | South Africa |
| Total | 3,687,097,368 | 100% | 0.45 | World |
Table 11 — IPv4 allocated address pools per economy as of January 2025.
If we divide this address pool by the current population of each economy, then we can derive an address per capita index. The global total of 3.69B allocated addresses, with an estimated global population of 8B people, gives 0.45 IPv4 addresses per capita.
| Rank | CC | IPv4 pool | % Total | Per capita | Economy |
| 1 | SC | 7,475,456 | 0.2% | 68.50 | Seychelles |
| 2 | VA | 10,752 | 0.0% | 20.10 | Holy See |
| 3 | GI | 235,264 | 0.0% | 7.18 | Gibraltar |
| 4 | VG | 166,144 | 0.0% | 5.18 | British Virgin Islands |
| 5 | US | 1,611,699,808 | 43.7% | 4.68 | USA |
| 6 | SG | 26,597,376 | 0.7% | 4.35 | Singapore |
| 7 | MU | 4,780,032 | 0.1% | 3.67 | Mauritius |
| 8 | SE | 31,078,888 | 0.8% | 2.89 | Sweden |
| 9 | CH | 25,444,472 | 0.7% | 2.85 | Switzerland |
| 10 | NO | 15,542,032 | 0.4% | 2.79 | Norway |
| Total | XA | 3,687,386,072 | 100.0% | 0.45 | World |
Table 12 — IPv4 allocated address pools ranked by per capita holdings.
IPv4 address leasing
The address market includes leasing as well as sales. Should an entity that requires IPv4 addresses enter the market and buy the addresses from an existing address holder? Or should they execute a timed lease, to have the use of these addresses for a specified period, and return these addresses at the end of the lease? This lease versus buy question is a conventional question in market economics, and there are well-rehearsed answers to it. They tend to relate to market information and scenario planning.
If a buyer believes that the market will endure, and the goods traded on the market are in finite supply while the demand is increasing, then the market will add an escalating scarcity premium to the price of those goods. A holder of these goods will see an increase in the value of the goods that they hold. A lessee will not.
If a buyer believes that the market has a short lifespan and that demand for the good will dissipate at the end of this lifespan, then leasing the good makes sense. The lessee is not left with a valueless asset when the market collapses.
Scarcity also has other consequences, one of which is the pricing of substitute goods. At some point, the price of the original good rises to the point that substitution looks economically attractive, even if the substitute good has a higher cost of production or use. In fact, this substitution price effectively sets a price ceiling for the original scarce good.
Some commentators have argued that an escalating price for IPv4 increases the economic incentive for IPv6 adoption, and this may indeed be the case. There are other potential substitutes, most notably NATs. While NATs do not eliminate the demand pressure for IPv4, they can go a long way to increase the address use efficiency of IPv4 addresses. NATs allow many customers to use the same address at different times. The larger the pool of customers that share a common pool of NAT addresses, the greater the achievable multiplexing capability.
The estimate of how long the market in IPv4 addresses will persist is based on how long IPv4 and NATs can last, and how long it will take IPv6 to be sufficiently deployed to be viable as an IPv6-only service. At that point, there is likely to be a tipping point where the pressure for all hosts and networks to support access to services over IPv4 collapses. The early IPv6-only adopters can dump all their remaining IPv4 resources onto the market as they have no further need for them. Existing IPv4 holders would be faced with the prospect of holding a worthless asset and would be under pressure to sell off their IPv4 assets while there are still buyers in the market.
A significant population of IPv4-only hosts and networks can stall this transition and increase scarcity pressure. If the scarcity pressure becomes too great, the motivation for IPv6-only adoption increases to the level that the IPv6-connected base achieves market dominance. When this condition is achieved, the IPv4 address market will quickly collapse.
The leasing market is opaque, as lease arrangements are not registered in a public registry but are the subject of a private contract. There’s one address broker, IPXO, that does publish data relating to its leasing activities. This enterprise has seen an increase in its total pool of leased addresses from 0.7M at the start of 2022 to 9.2M (Figure 15). Note that this does not reflect the total pool of leased addresses, but a view from one active address broker in this space.
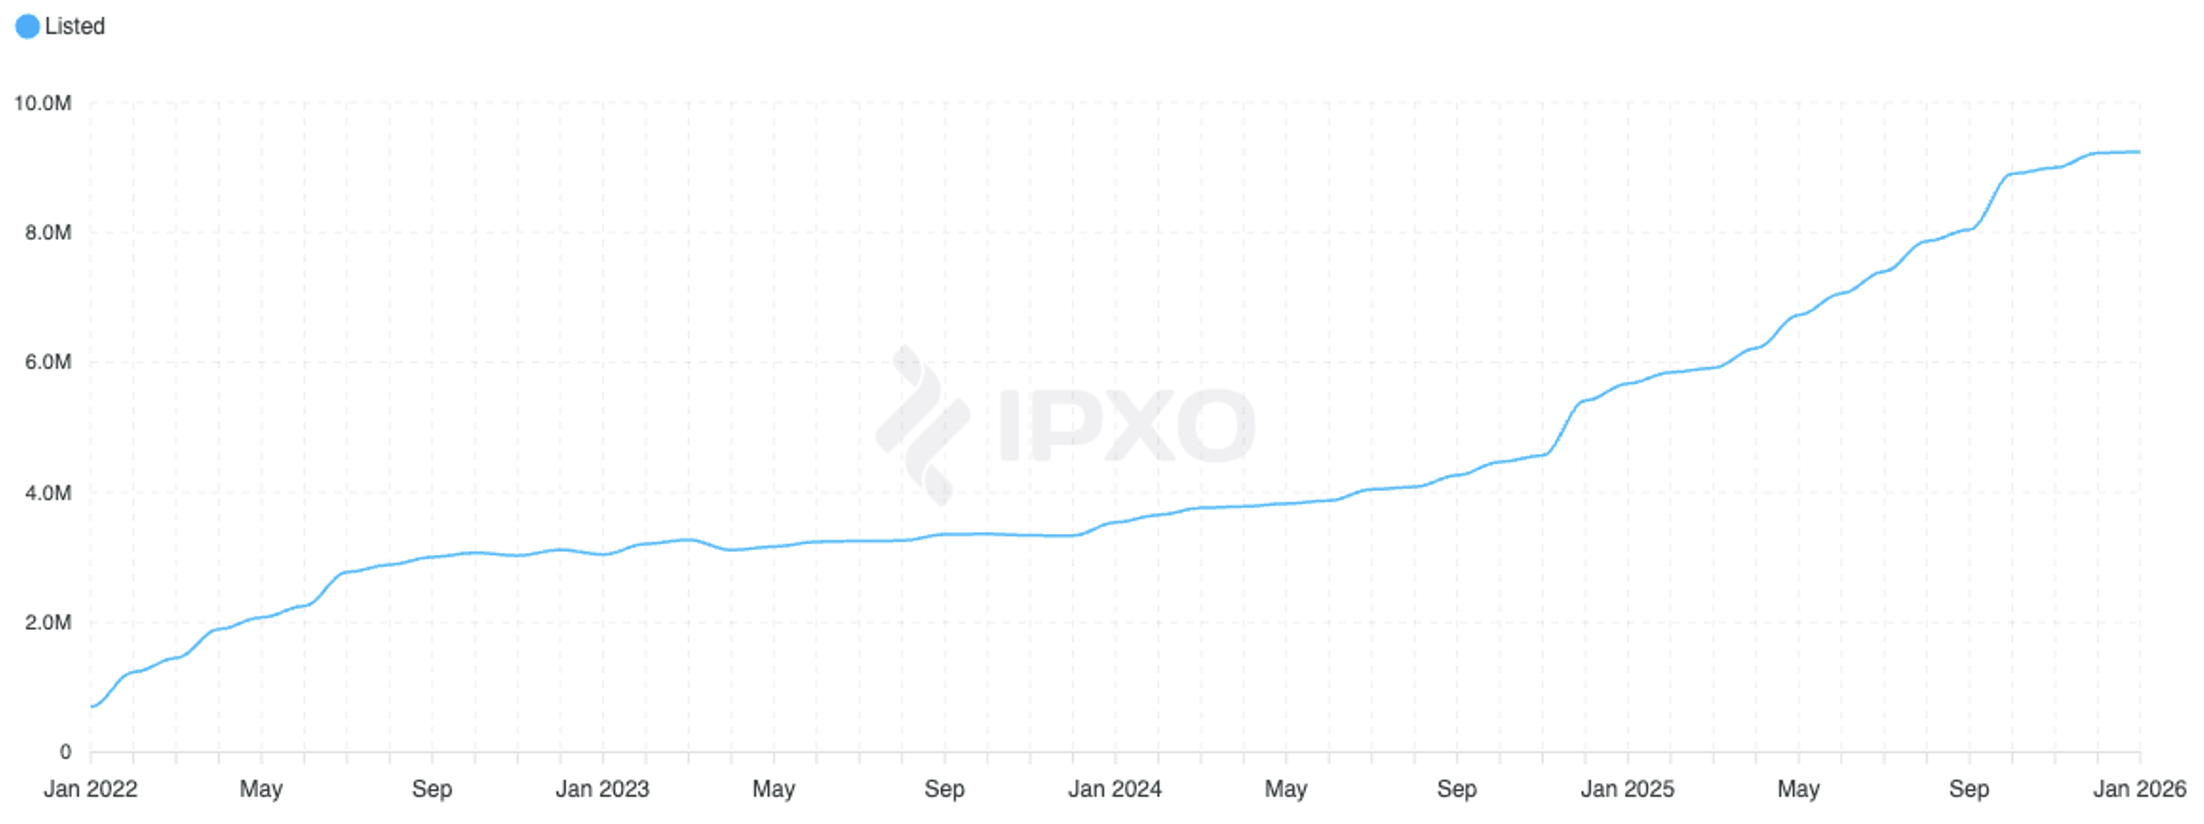
Figure 16 shows the average lease price and the price range for 2025 on a week-by-week basis.
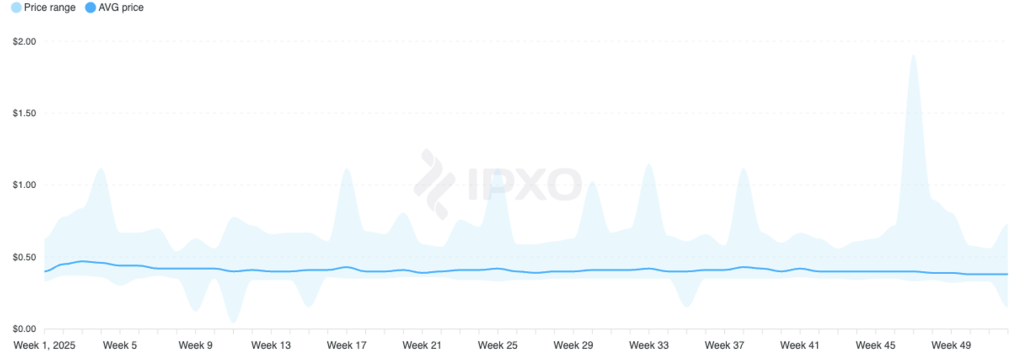
This lease price data is slightly at odds with the sale price data. During 2025, the average lease price declined by 15%, while the average sale price declined by 50%. The reasons for this discrepancy are unclear.
IPv6 in 2025
IPv4 address allocations are only half of the story, and to complete the picture, it’s necessary to look at how IPv6 has fared during 2025.
IPv6 uses a somewhat different address allocation methodology than IPv4. It’s a matter of choice for a service provider to decide how large an IPv6 address prefix is assigned to each customer.
The original recommendations published by the Internet Architecture Board (IAB) and Internet Engineering Steering Group (IESG) in 2001 (RFC 3177) envisaged the general use of a /48 prefix as a generally suitable end-site prefix. Subsequent consideration of long-term address conservation saw a more flexible approach being taken, with the choice of the end site prefix size being left to the service provider.
Today’s IPv6 environment has some providers using a /60 end site allocation unit, some using a /56, and some other providers using a /48 IPv6 address prefix. This variation makes a comparison of the count of allocated IPv6 addresses between ISPs somewhat misleading. An ISP using /48s for end sites will require:
- 256 times more address space to accommodate a similarly sized customer base as a provider who uses a /56 end site prefix.
- 4,096 times more address space than an ISP using a /60 end site allocation.
Let’s use both the number of discrete IPv6 allocations and the total amount of space that was allocated to see how IPv6 fared in 2025.
Comparing 2024 to 2025, the number of individual allocations of IPv6 address space has decreased by 7%, while the number of IPv4 allocation transactions has increased by 3% (Table 13).
| Allocations | 2012 | 2013 | 2014 | 2015 | 2016 | 2017 | 2018 | 2019 | 2020 | 2021 | 2022 | 2023 | 2024 | 2025 |
| IPv6 | 3,291 | 3,529 | 4,502 | 4,644 | 5,567 | 5,740 | 6,176 | 6,799 | 5,376 | 5,350 | 4,066 | 3,874 | 3,925 | 3,645 |
| IPv4 | 7,435 | 6,429 | 10,435 | 11,352 | 9,648 | 8,185 | 8,769 | 12,560 | 5,874 | 6,939 | 4,395 | 3,462 | 3,559 | 3,654 |
Table 13 — Number of individual address allocations, 2012 to 2025.
The amount of IPv6 address space distributed in 2025 is 80% less than what was allocated in 2023, while the corresponding IPv4 volume decreased by 11% (Table 14).
| Addresses | 2012 | 2013 | 2014 | 2015 | 2016 | 2017 | 2018 | 2019 | 2020 | 2021 | 2022 | 2023 | 2024 | 2025 |
| IPv6 (/32s) | 17,740 | 24,103 | 17,917 | 20,234 | 25,300 | 19,986 | 39,278 | 36,507 | 21,835 | 28,690 | 27,858 | 74,321 | 45303 | 11065 |
| IPv4 (/32s)(M) | 111.8 | 65.2 | 64 | 64.4 | 37.9 | 51.9 | 50.6 | 42.5 | 23.3 | 23.9 | 34.9 | 25.4 | 26.2 | 34.9 |
Table 14 — Volume of address allocations, 2012 to 2025.
Regionally, each of the RIRs saw IPv6 allocation activity in 2025 that was on a par with that seen in 2024, but well short of the peak period of IPv6 allocation activity in 2018 and 2019 (Table 15).
| Allocations | 2012 | 2013 | 2014 | 2015 | 2016 | 2017 | 2018 | 2019 | 2020 | 2021 | 2022 | 2023 | 2024 | 2025 |
| AFRINIC | 82 | 72 | 59 | 81 | 111 | 110 | 108 | 111 | 108 | 135 | 151 | 115 | 117 | 133 |
| APNIC | 599 | 540 | 528 | 777 | 1,680 | 1,369 | 1,460 | 1,484 | 1,498 | 1,392 | 1,317 | 1,381 | 1,265 | 1,239 |
| ARIN | 603 | 543 | 489 | 604 | 645 | 684 | 648 | 601 | 644 | 668 | 680 | 712 | 951 | 1,034 |
| LACNIC | 251 | 223 | 1,199 | 1,053 | 1,007 | 1,547 | 1,439 | 1,614 | 1,801 | 725 | 635 | 612 | 656 | 606 |
| RIPE NCC | 1,756 | 2,151 | 2,227 | 2,129 | 2,124 | 2,030 | 2,521 | 2,989 | 1,325 | 2,430 | 1,283 | 1,054 | 936 | 633 |
| Total | 3,291 | 3,529 | 4,502 | 4,644 | 5,567 | 5,740 | 6,176 | 6,799 | 5,376 | 5,350 | 4,066 | 3,874 | 3,925 | 3,645 |
Table 15 — IPv6 allocations by RIR, 2012 to 2025.
The address assignment data tells a slightly different story. Table 16 shows the number of allocated IPv6 /32s per year. There were no large IPv6 allocations in 2025, and the total volume of allocated IPv6 addresses was less than one quarter of the volume allocated in 2024.
| Addresses (/32s) | 2012 | 2013 | 2014 | 2015 | 2016 | 2017 | 2018 | 2019 | 2020 | 2021 | 2022 | 2023 | 2024 | 2025 |
| AFRINIC | 4,201 | 66 | 48 | 308 | 76 | 112 | 71 | 360 | 88 | 141 | 387 | 400 | 380 | 372 |
| APNIC | 3,807 | 4,462 | 2,663 | 2,108 | 1,235 | 4,228 | 19,681 | 7,945 | 7,365 | 10,185 | 4,856 | 599 | 33,257 | 4,457 |
| ARIN | 1,672 | 12,571 | 5,214 | 642 | 1,087 | 1,372 | 844 | 5,520 | 4,975 | 373 | 13,695 | 66,340 | 5,692 | 1,859 |
| LACNIC | 4,301 | 158 | 1,314 | 953 | 1,173 | 1,427 | 1,327 | 1,496 | 1,669 | 658 | 563 | 467 | 575 | 565 |
| RIPE NCC | 3,729 | 6,385 | 8,608 | 11,754 | 21,689 | 12,836 | 16,776 | 20,603 | 7,523 | 16,774 | 7,996 | 6,353 | 5,111 | 3,079 |
| Total | 17,710 | 23,642 | 17,847 | 15,765 | 25,260 | 19,975 | 38,699 | 35,924 | 21,620 | 28,131 | 27,497 | 74,159 | 45,015 | 10,332 |
Table 16 — IPv6 address allocation volumes by RIR.
Dividing addresses by allocations gives the average IPv6 allocation size in each region (Table 17). The average IPv6 allocation size in 2025 was smaller than a /30. The RIPE NCC and APNIC averaged larger individual IPv6 allocations than the other RIRs.
| 2012 | 2013 | 2014 | 2015 | 2016 | 2017 | 2018 | 2019 | 2020 | 2021 | 2022 | 2023 | 2024 | 2025 | |
| AFRINIC | /26.3 | /32.1 | /32.3 | /30.1 | /32.5 | /32.0 | /32.6 | /30.3 | /32.3 | /31.9 | /30.6 | /30.2 | /30.3 | /30.5 |
| APNIC | /29.3 | /29.0 | /29.7 | /30.6 | /32.4 | /30.4 | /28.2 | /29.6 | /29.7 | /29.1 | /30.1 | /33.2 | /27.3 | /30.2 |
| ARIN | /30.5 | /27.5 | /28.6 | /31.9 | /31.2 | /31.0 | /31.6 | /28.8 | /29.1 | /32.8 | /27.7 | /25.5 | /29.4 | /31.2 |
| LACNIC | /27.9 | /32.5 | /31.9 | /32.1 | /31.8 | /32.1 | /32.1 | /32.1 | /32.1 | /32.1 | /32.2 | /32.4 | /32.2 | /32.1 |
| RIPE NCC | /30.9 | /30.4 | /30.0 | /29.5 | /28.6 | /29.3 | /29.3 | /29.2 | /29.5 | /29.2 | /29.4 | /29.4 | /29.6 | /29.7 |
| Average | /29.6 | /29.3 | /30.0 | /30.2 | /29.8 | /30.2 | /29.4 | /29.6 | /30.0 | /29.6 | /29.2 | /27.7 | /28.5 | /30.5 |
Table 17 — Average IPv6 address allocation size by RIR.
Figures 17 and 18 show the number and volume of IPv6 allocations per RIR per year.
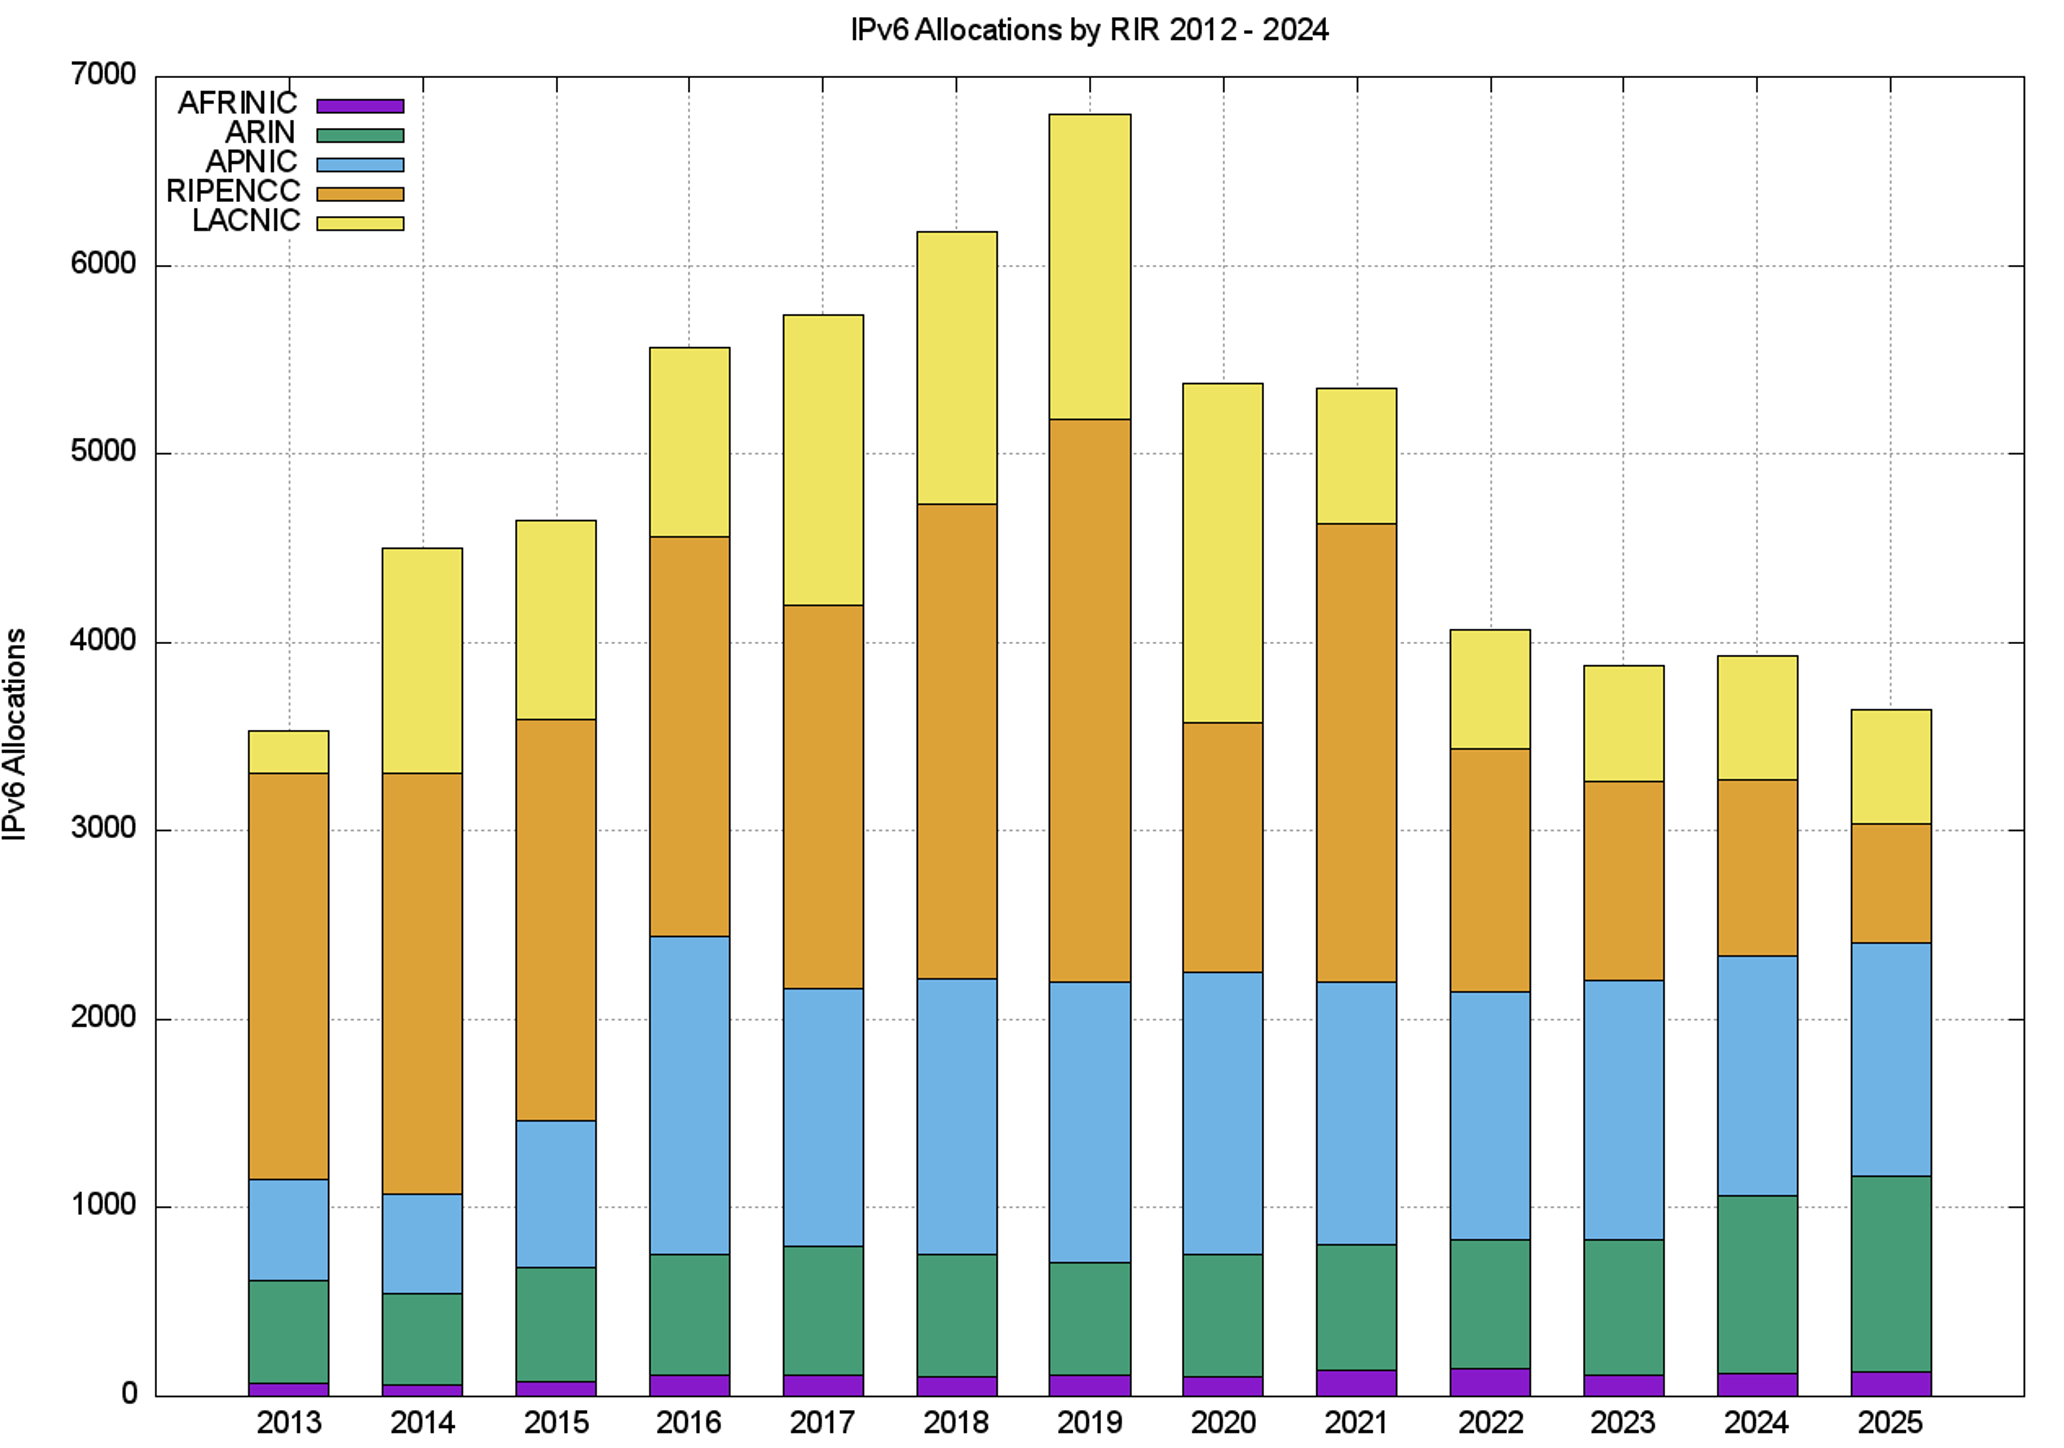
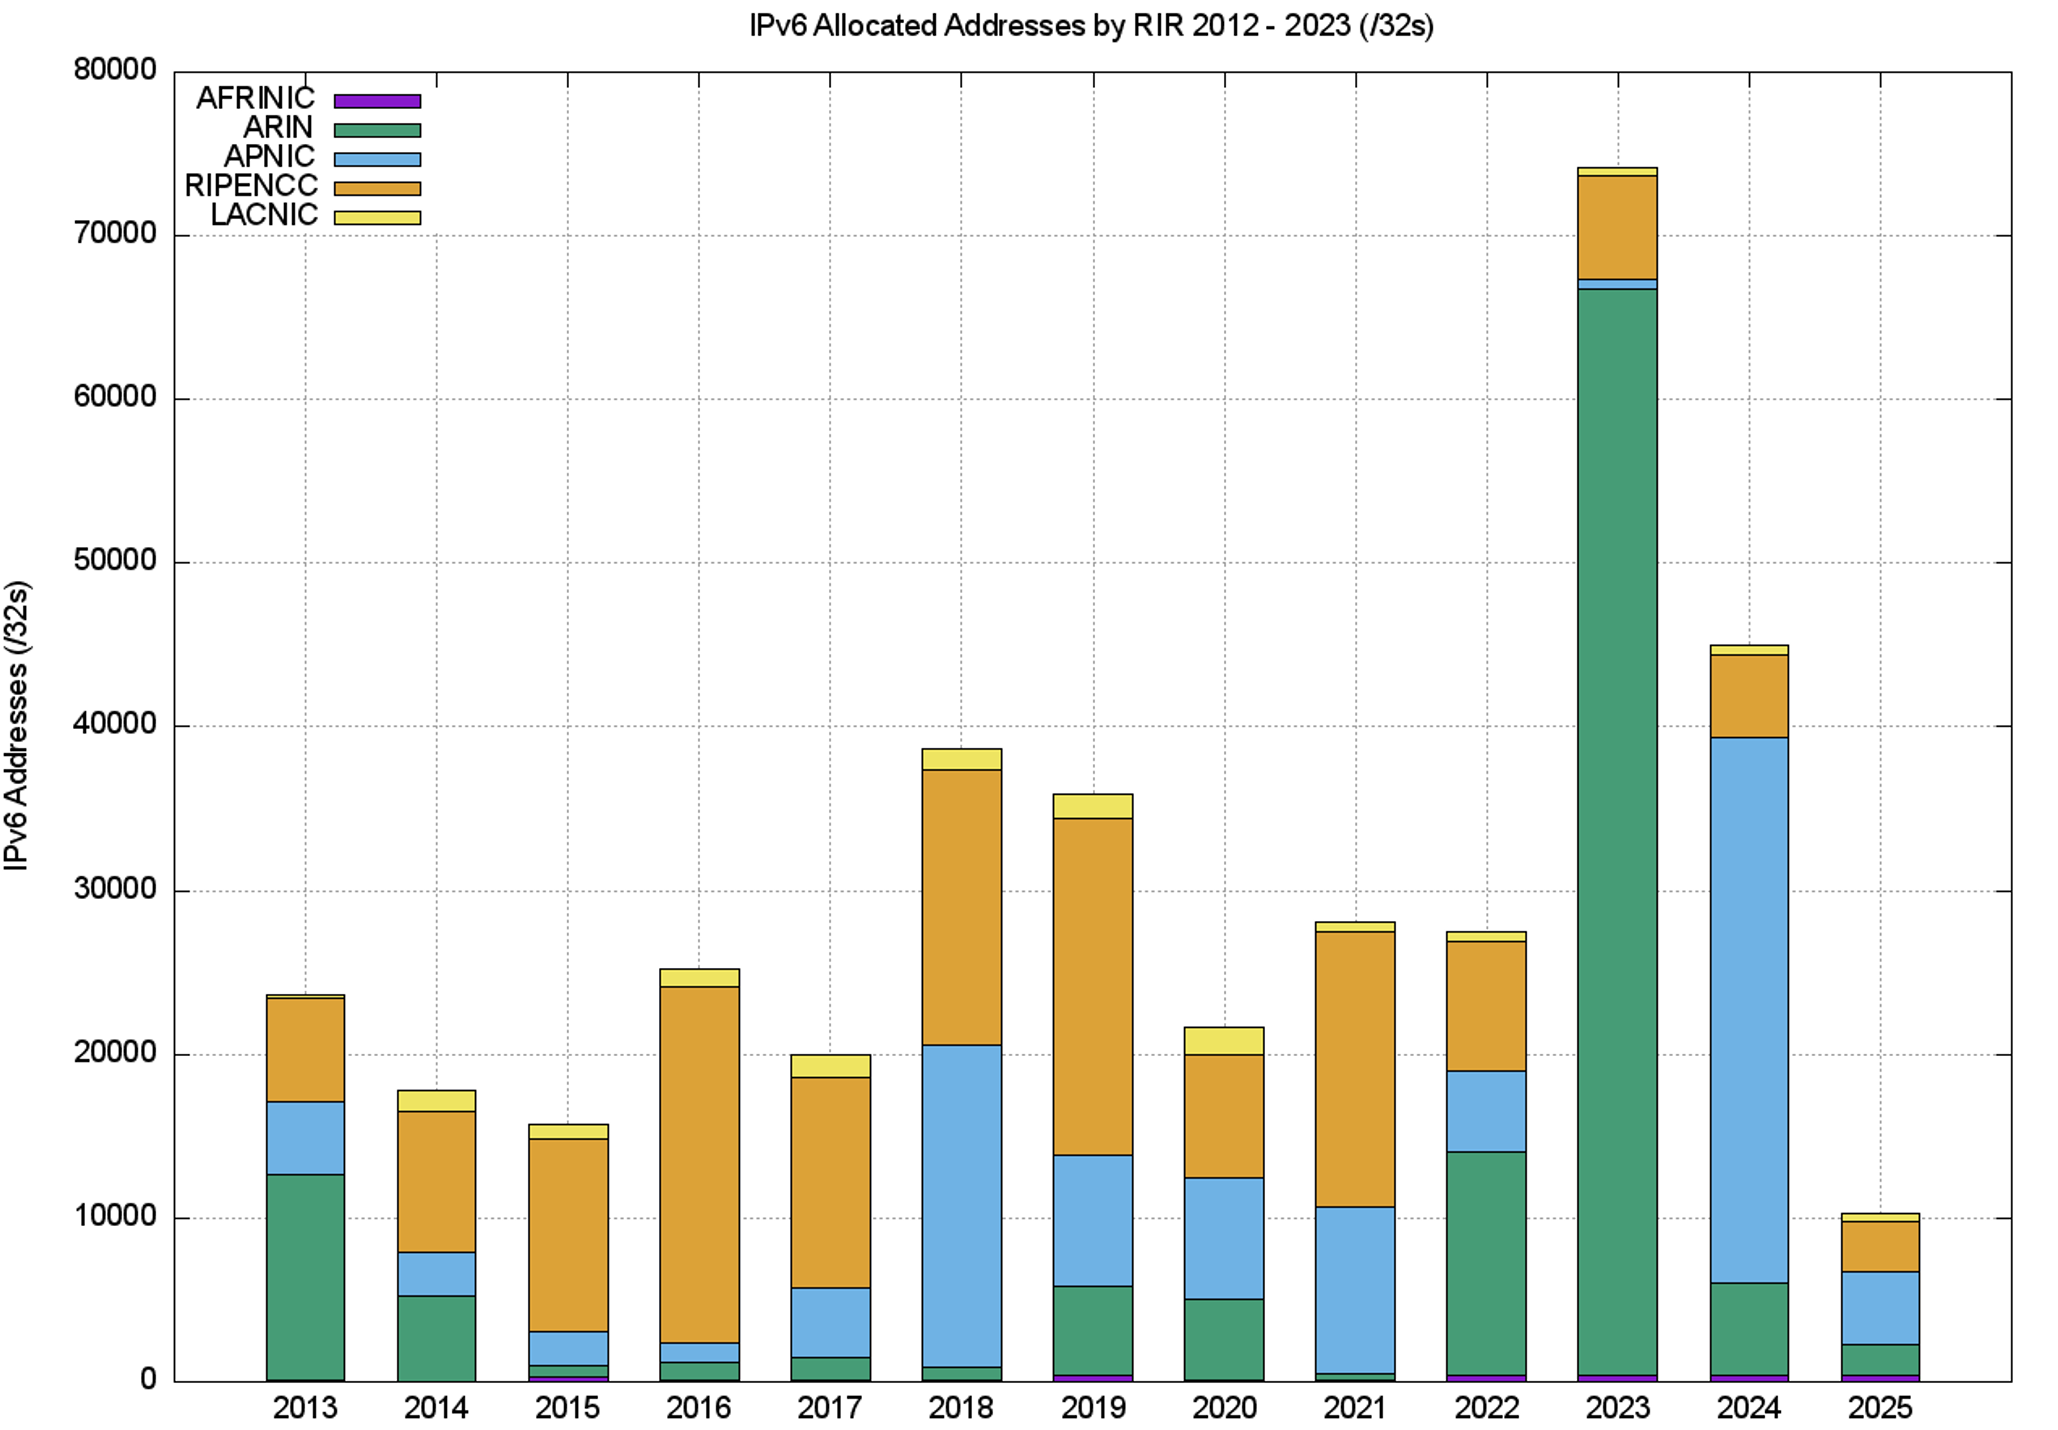
The number of IPv6 address allocations has been steadily falling since 2019, as shown in Figure 17. There was a more dramatic fall in the volume of allocated addresses in 2025, although single large allocations lifted the numbers in 2023 and 2024, by ARIN in 2023, and APNIC in 2024.
| Rank | 2020 | 2021 | 2022 | 2023 | 2024 | 2025 | ||||||
| 1 | Brazil | 1,394 | USA | 619 | USA | 638 | USA | 691 | USA | 889 | USA | 967 |
| 2 | USA | 588 | Russia | 576 | India | 377 | India | 424 | Brazil | 302 | Brazil | 310 |
| 3 | Indonesia | 389 | Brazil | 508 | Brazil | 339 | Brazil | 267 | India | 269 | Indonesia | 304 |
| 4 | India | 226 | Netherlands | 448 | Bangladesh | 239 | Indonesia | 198 | Vietnam | 233 | India | 268 |
| 5 | Netherlands | 199 | India | 390 | Germany | 158 | Bangladesh | 159 | Indonesia | 169 | Bangladesh | 167 |
| 6 | Germany | 192 | UK | 304 | Russia | 138 | Vietnam | 143 | Bangladesh | 156 | Germany | 104 |
| 7 | Bangladesh | 182 | Bangladesh | 213 | UK | 125 | Germany | 126 | Germany | 119 | Vietnam | 98 |
| 8 | Russia | 128 | Germany | 196 | Indonesia | 113 | Colombia | 99 | Iran (Islamic Republic of) | 86 | UK | 71 |
| 9 | Australia | 118 | Indonesia | 110 | Australia | 100 | Mexico | 96 | Australia | 83 | Canada | 68 |
| 10 | China | 115 | Hong Kong | 108 | Vietnam | 91 | UK | 85 | Mexico | 83 | Australia | 65 |
Table 18 — IPv6 allocations by year by economy, 2020 to 2025.
Table 18 shows the economies that received the largest number of individual IPv6 allocations, while Table 19 shows the amount of IPv6 address space assigned on a per-economy basis for the past four years (using units of /32s). Table 19 also shows the annual volume of allocated IPv6 addresses.
| Rank | 2020 | 2021 | 2022 | 2023 | 2024 | 2025 | ||||||
| 1 | China | 6,765 | China | 5,424 | USA | 13,919 | USA | 66,579 | Singapore | 32,792 | China | 4,139 |
| 2 | USA | 5,051 | Russia | 4,409 | China | 4,354 | Lithuania | 522 | USA | 5,533 | USA | 1,906 |
| 3 | Brazil | 1,358 | India | 4,281 | Russia | 925 | UK | 513 | Iran | 643 | Germany | 400 |
| 4 | Netherlands | 1,331 | Netherlands | 3,390 | UK | 734 | Germany | 478 | Germany | 426 | Iran | 382 |
| 5 | Germany | 716 | UK | 2,249 | Germany | 706 | Russia | 371 | Lithuania | 410 | Brazil | 295 |
| 6 | Russia | 715 | Germany | 896 | Moldova | 456 | Ukraine | 369 | UK | 352 | UK | 288 |
| 7 | UK | 552 | Ukraine | 651 | France | 404 | Iran (Islamic Republic of) | 314 | Turkey | 328 | Ghana | 261 |
| 8 | Italy | 391 | Lithuania | 633 | Netherlands | 397 | France | 276 | South Africa | 304 | Turkey | 248 |
| 9 | France | 390 | Brazil | 502 | Italy | 363 | Seychelles | 258 | Canada | 292 | France | 231 |
| 10 | Turkey | 290 | USA | 491 | Brazil | 328 | Rwanda | 256 | Brazil | 289 | Russia | 219 |
Table 19 — IPv6 address allocation volumes by year by economy (/32s).
We can also review the total IPv6 allocated address pools for the top 25 IPv6-holding economies as of the end of 2025 (Table 20).
While the United States tops this list of the total pool of allocated IPv6 addresses, with 31% of the total span of allocated IPv6 addresses, the per-capita number is lower than that of others in this list (the Netherlands, Sweden, and Switzerland). In 2023, ARIN allocated a /16 address block to Capital One Financial Corporation, one of the larger banks in the United States, with a large credit card base in retail operations. In 2024, APNIC allocated a /17 to Huawei International, with a corporate location in Singapore.
| Rank | CC | Allocated (/48s) | % Total | /48s per capita | Advertised /48s | Deployment | Name |
| 1 | US | 9,365,768,669 | 29.1% | 27.2 | 1,461,877,253 | 15.61% | USA |
| 2 | CN | 4,493,742,162 | 14.0% | 3.2 | 1,663,468,967 | 37.02% | China |
| 3 | SG | 2,259,174,127 | 7.0% | 369.8 | 10,160,967 | 0.45% | Singapore |
| 4 | DE | 1,589,183,275 | 4.9% | 19.1 | 1,058,252,137 | 66.59% | Germany |
| 5 | GB | 1,383,735,799 | 4.3% | 20.3 | 402,612,655 | 29.10% | UK |
| 6 | FR | 996,356,774 | 3.1% | 15.3 | 194,604,234 | 19.53% | France |
| 7 | NL | 716,964,426 | 2.2% | 40.4 | 268,864,861 | 37.50% | Netherlands |
| 8 | RU | 707,002,688 | 2.2% | 4.9 | 235,224,973 | 33.27% | Russia |
| 9 | IT | 697,438,251 | 2.2% | 11.9 | 441,473,076 | 63.30% | Italy |
| 10 | JP | 669,610,206 | 2.1% | 5.5 | 512,384,857 | 76.52% | Japan |
| 11 | AU | 622,466,380 | 1.9% | 23.0 | 311,339,826 | 50.02% | Australia |
| 12 | BR | 552,504,290 | 1.7% | 2.5 | 443,002,861 | 80.18% | Brazil |
| 13 | SE | 457,834,856 | 1.4% | 42.5 | 87,939,340 | 19.21% | Sweden |
| 14 | IN | 445,384,346 | 1.4% | 0.3 | 374,616,708 | 84.11% | India |
| 15 | PL | 405,012,749 | 1.3% | 10.3 | 213,105,000 | 52.62% | Poland |
| 16 | SC | 371,458,053 | 1.2% | 3,403.5 | 190,812,631 | 51.37% | Seychelles |
| 17 | ES | 370,671,667 | 1.2% | 7.8 | 115,409,593 | 31.14% | Spain |
| 18 | ZA | 350,950,578 | 1.1% | 5.7 | 311,555,526 | 88.77% | South Africa |
| 19 | AR | 347,215,986 | 1.1% | 7.5 | 288,372,923 | 83.05% | Argentina |
| 20 | KR | 346,493,198 | 1.1% | 6.7 | 2,608,311 | 0.75% | Korea |
| 21 | AE | 286,851,085 | 0.9% | 29.6 | 234,423,207 | 81.72% | United Arab Emirates |
| 22 | TR | 278,396,961 | 0.9% | 3.2 | 68,204,409 | 24.50% | Turkey |
| 23 | EG | 271,384,582 | 0.8% | 2.3 | 270,925,826 | 99.83% | Egypt |
| 24 | CH | 270,205,124 | 0.8% | 30.3 | 126,588,325 | 46.85% | Switzerland |
| 25 | IR | 267,517,963 | 0.8% | 2.9 | 52,436,571 | 19.60% | Iran |
Table 20 — IPv6 allocated address pools per economy in December 2025.
There are several visible outliers in this table. In terms of addresses per capita, the Seychelles and Singapore have IPv6 allocated addresses to entities that are based in that economy, which is a far greater address pool than their domestic population would suggest.
There are 503 address prefix allocations recorded against Singapore, but one allocation, 2410::/17 to Huawei International, a company whose corporate office is in Singapore, is the reason why Singapore’s address holdings are so large.
There are 731 IPv6 address prefix allocations recorded against the Seychelles, but 353 of these allocations, and one-half of the total allocated address pool for the Seychelles, are recorded by the RIPE NCC against a single account holder. This holding entity is an IP address broker, iNet Ltd, a company registered in the Seychelles, but with a primary UK point of contact, with leasing customers predominantly located in Europe.
IPv6 address prefixes advertised into the public Internet also show some anomalies. Korea has 181 IPv6 address allocation records, yet only 55 of these address prefixes are visible in the routing table, representing 0.75% of the address pool registered to that economy. Singapore is in a similar position. Conversely, the network operators in Japan, Brazil, India, South Africa, Argentina, the United Arab Emirates (UAE), and Egypt advertise more than 75% of their allocated IPv6 address pool.
Twenty years ago, common practice was to point out the inequities in the state of IPv4 address deployment. At the time, some US universities had more IPv4 addresses at their disposal than some highly populated developing economies, and the disparity was a part of the criticism of the address management practices used at the time.
Among a large set of objectives, the RIR system was intended to address this issue of predisposition to a biased outcome in address distribution. The concept behind the RIR system was that within each regional community, local stakeholders could develop their own address distribution policies. They could determine for themselves what they meant by such terms as ‘fairness’ and ‘equity’, and then direct their regional address registry to adopt address allocation policies that intended to achieve these objectives.
IPv4 had an evident early adopter reward. Address allocations in the original IPv4 class A, B, and C address plan could be extravagant. The hope was that in IPv6, where the address allocations were developed from the outset through local bottom-up policy frameworks, such evident inequities in outcomes would be avoided. It was also thought that, with such a vast address plan provided by 128 bits of address space, the entire concept of scarcity and inequity would be largely irrelevant. 2128 is a vast number, and the entire concept of comparison between two vast pools of addresses is somewhat irrelevant. So, when we look at the metric of /48s per head of population, don’t forget that a /48 is actually 80 bits of address space, which is massively larger than the entire IPv4 address space. Even India’s average of 0.3 /48s per capita is still a truly massive pool of IPv6 addresses!
Before we go too far down this path, it’s also useful to bear in mind that the 128 bits of address space in IPv6 has become almost a myth. We sliced off 64 bits in the address plan for no particularly good reason, as it turns out. We then sliced off a further 16 bits for again no particularly good reason. 16 bits for end-site addresses allows for 65,000 distinct networks within each site, which is somewhat outlandish in pretty much every case.
The result is that the vastness of the address space represented by 128 bits in IPv6 is, in fact, not so vast in practice. The usable address prefix space in IPv4 roughly equates a /32 end address in IPv4, with a /48 prefix in IPv6.
Perhaps this metric of /48s per capita is not entirely fanciful, and there is some substance to the observation that there are some inequities in the address distribution in IPv6. Unlike IPv4, the exhaustion of the IPv6 address space is still quite some time off. We still believe that there are sufficient IPv6 addresses to support a uniform address utilisation model across the entire world of silicon over time.
There’s a larger question about the underlying networking paradigm in today’s public network. IPv6 attempts to restore the 1980s networking paradigm of a true peer-to-peer network where every connected device is capable of sending packets to any other connected device.
Today’s networked environment regards such unconstrained connectivity as a liability. Exposing an end client device to unconstrained reachability is regarded as being unnecessarily foolhardy, and today’s network paradigm relies on client-initiated transactions.
This is well-suited to NAT-based IPv4 connectivity. The question regarding the long-term future of an IPv6 Internet is whether we want to bear the costs of maintaining end-client unique addressing plans, or whether NATs in IPv6 might prove to be a more cost-effective service platform for the client side of client/server networks.
To what extent are allocated IPv6 addresses visible as advertised prefixes in the Internet’s routing table?
Figure 19 shows the daily totals of advertised, unadvertised and total allocated address volumes for IPv6 since 2010, while Figure 20 shows the advertised address span as a percentage of the total span of allocated and assigned IPv6 addresses.
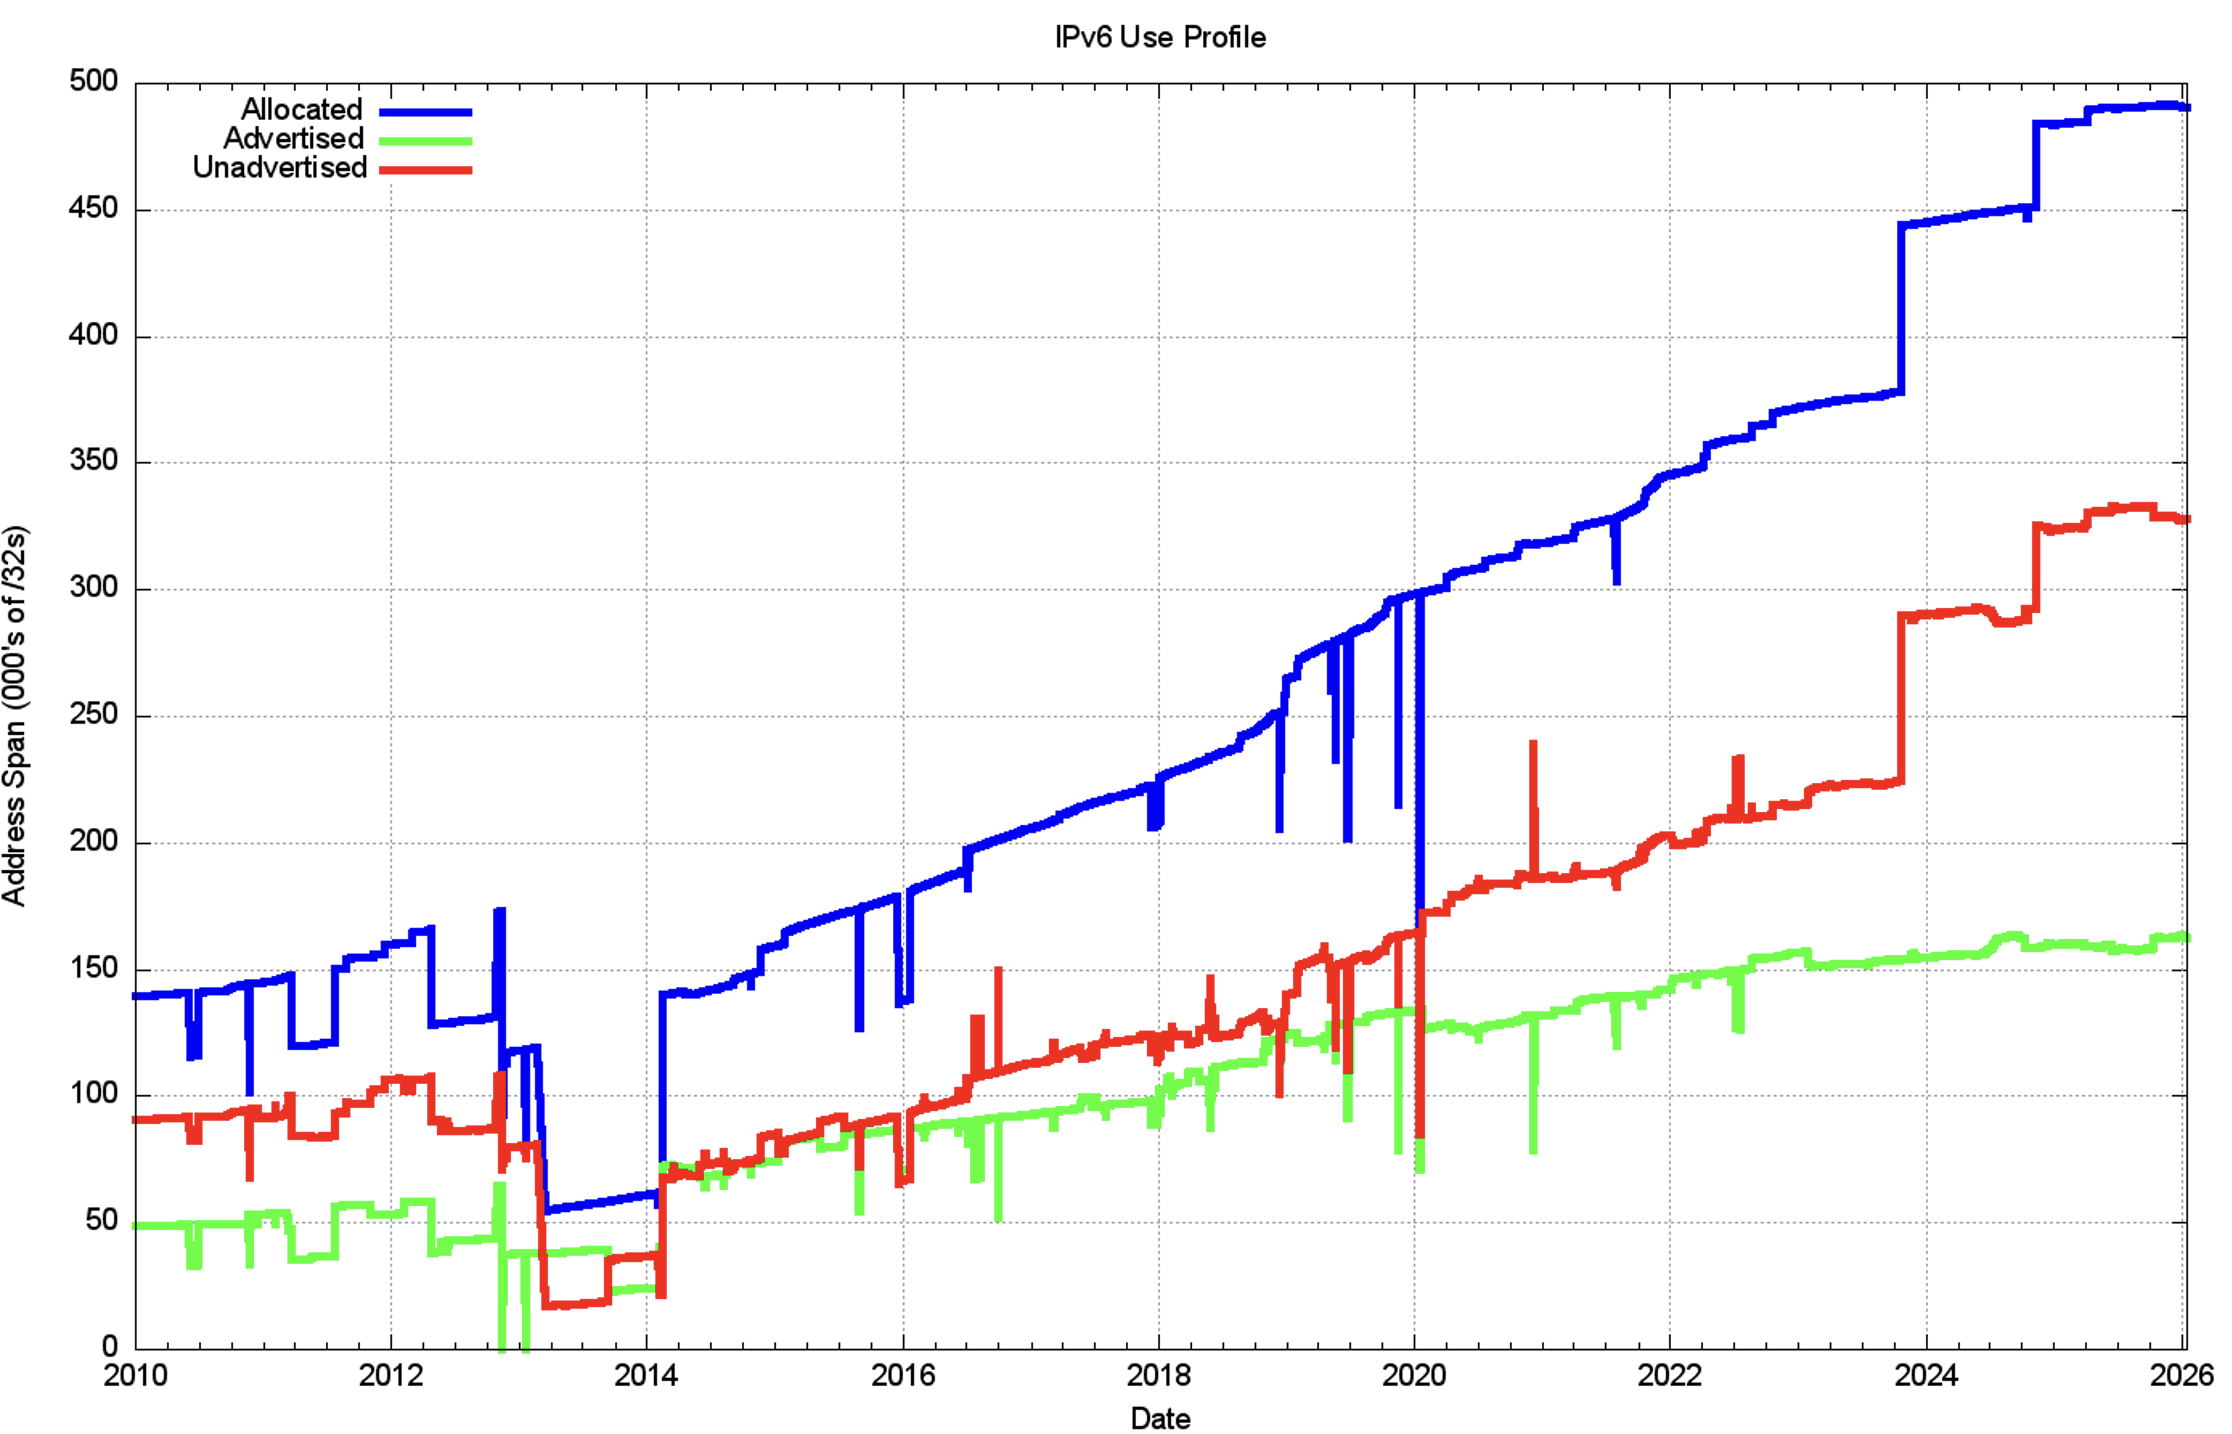
The drop in the allocated address span in 2013 is the result of a change in LACNIC, where a single large allocation into Brazil was replaced by the recording of direct allocation and assignments to ISPs and similar end entities.
It’s interesting to note that in IPv4, the longer-term trend in the ratio of unadvertised address space is falling, while in IPv6, the same metric is rising.
The IPv4 transfer market may be a relevant consideration in bringing otherwise unused IPv4 addresses back into circulation. Against the history of careful conservation of IPv4 addresses — where 85% of allocated or assigned IPv4 addresses are advertised in the BGP routing table — a comparable IPv6 figure of 34% does not look all that impressive.
But that’s not the point. We chose the 128-bit address size in IPv6 to allow the use of addresses without overriding conservation concerns. We’re allowed to be inefficient in address use in IPv6!
At the start of 2026, we’ve advertised an IPv6 address span of about 160,000 /32s, or 10.5B end-site /48 prefixes. That is 0.0037% of the total number of /48 prefixes in IPv6.
The outlook for the Internet
Once more, the set of uncertainties that surround the immediate future of the Internet is considerably greater than the set of predictions that we can be reasonably certain about.
The year 2017 saw a sharp rise in IPv6 deployment, majorly influenced by the deployment of IPv6 services in India. Notably, the Reliance Jio mobile service acted as a catalyst to prompt the other major Indian ISPs to also undertake similar deployment in their networks.
2018 was a quieter year, although the rise in the second half of the year was due to the initial efforts of mass-scale IPv6 deployment by some major Chinese service providers. This movement accelerated in 2019, and the further 5% increase in IPv6 deployment levels had a lot to do with the rapid rise of the deployment of IPv6 in China.
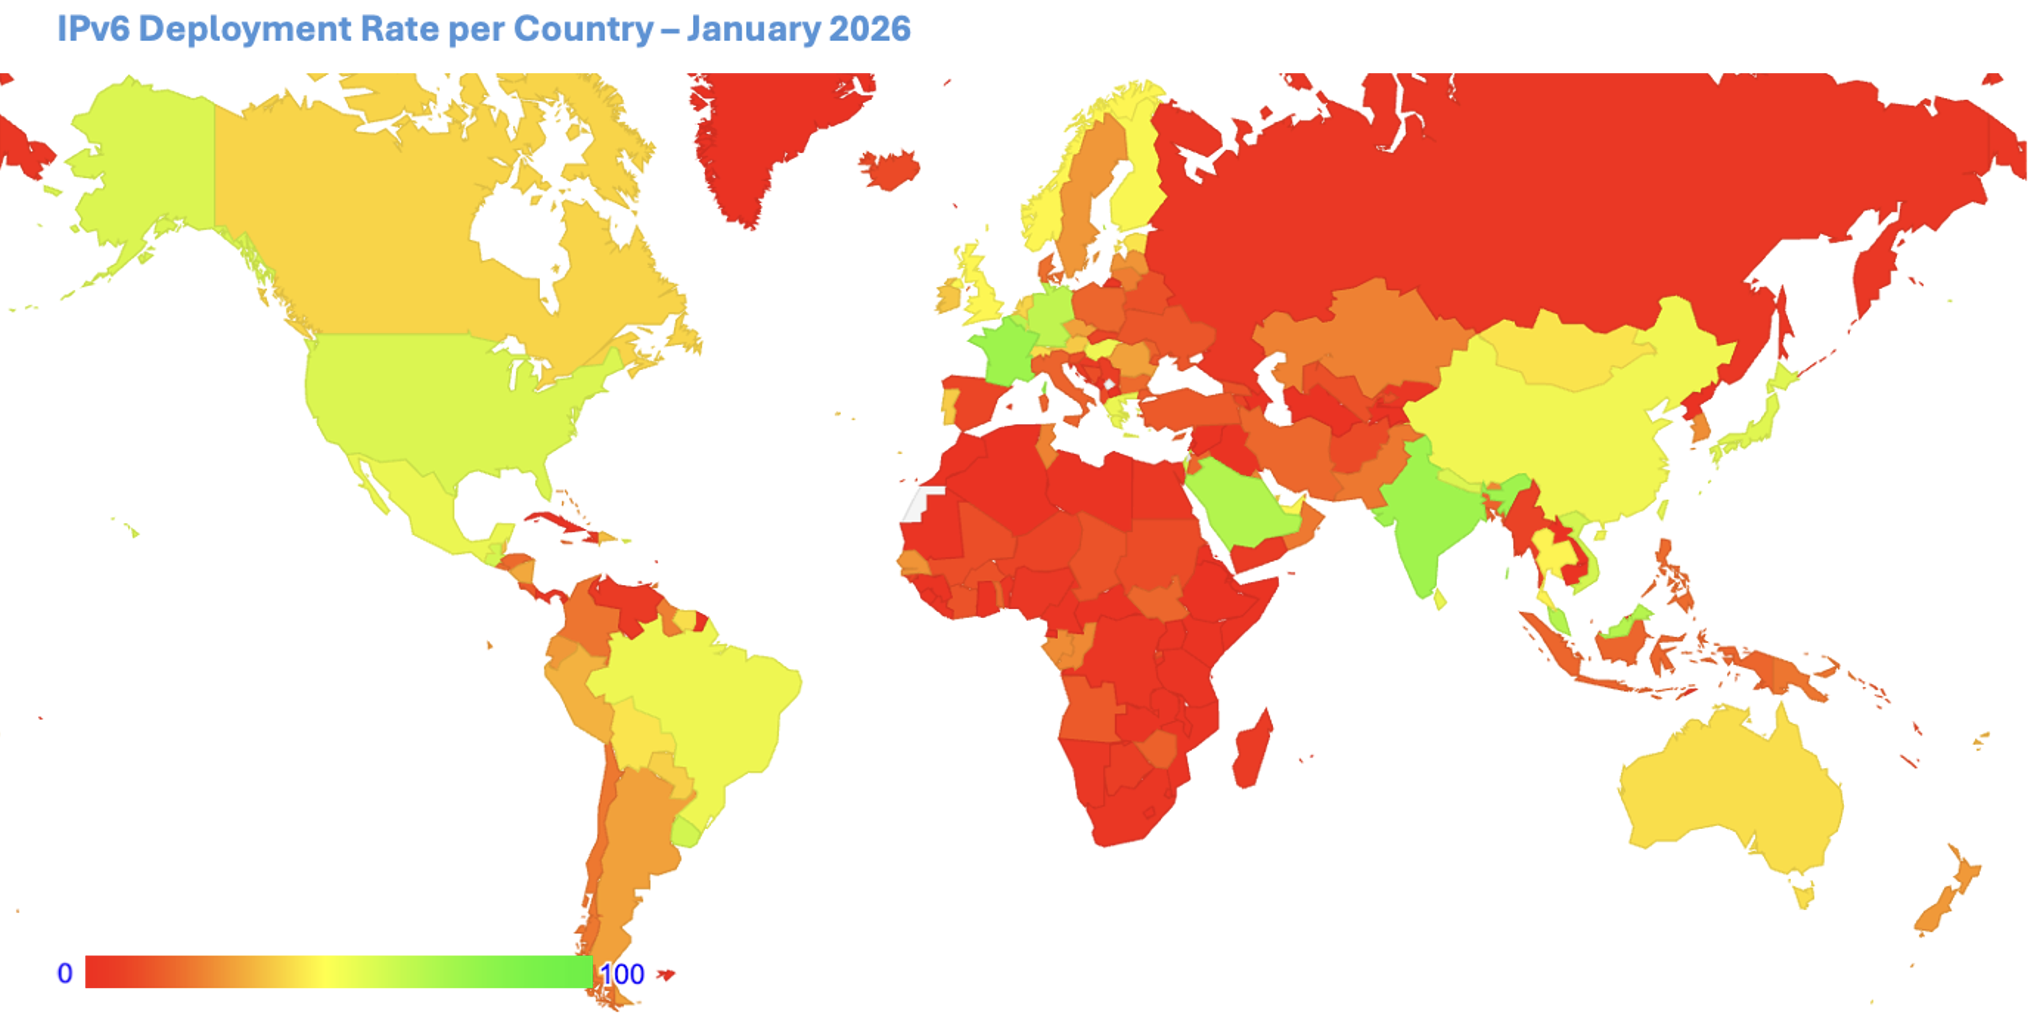
There has been an ongoing rise in the level of IPv6 within China. The measured level of IPv6 has risen from 32% of the user base at the start of 2024 to 54% at the end of 2025. The Chinese IPv6 user pool expanded by 94M end clients over the two years.
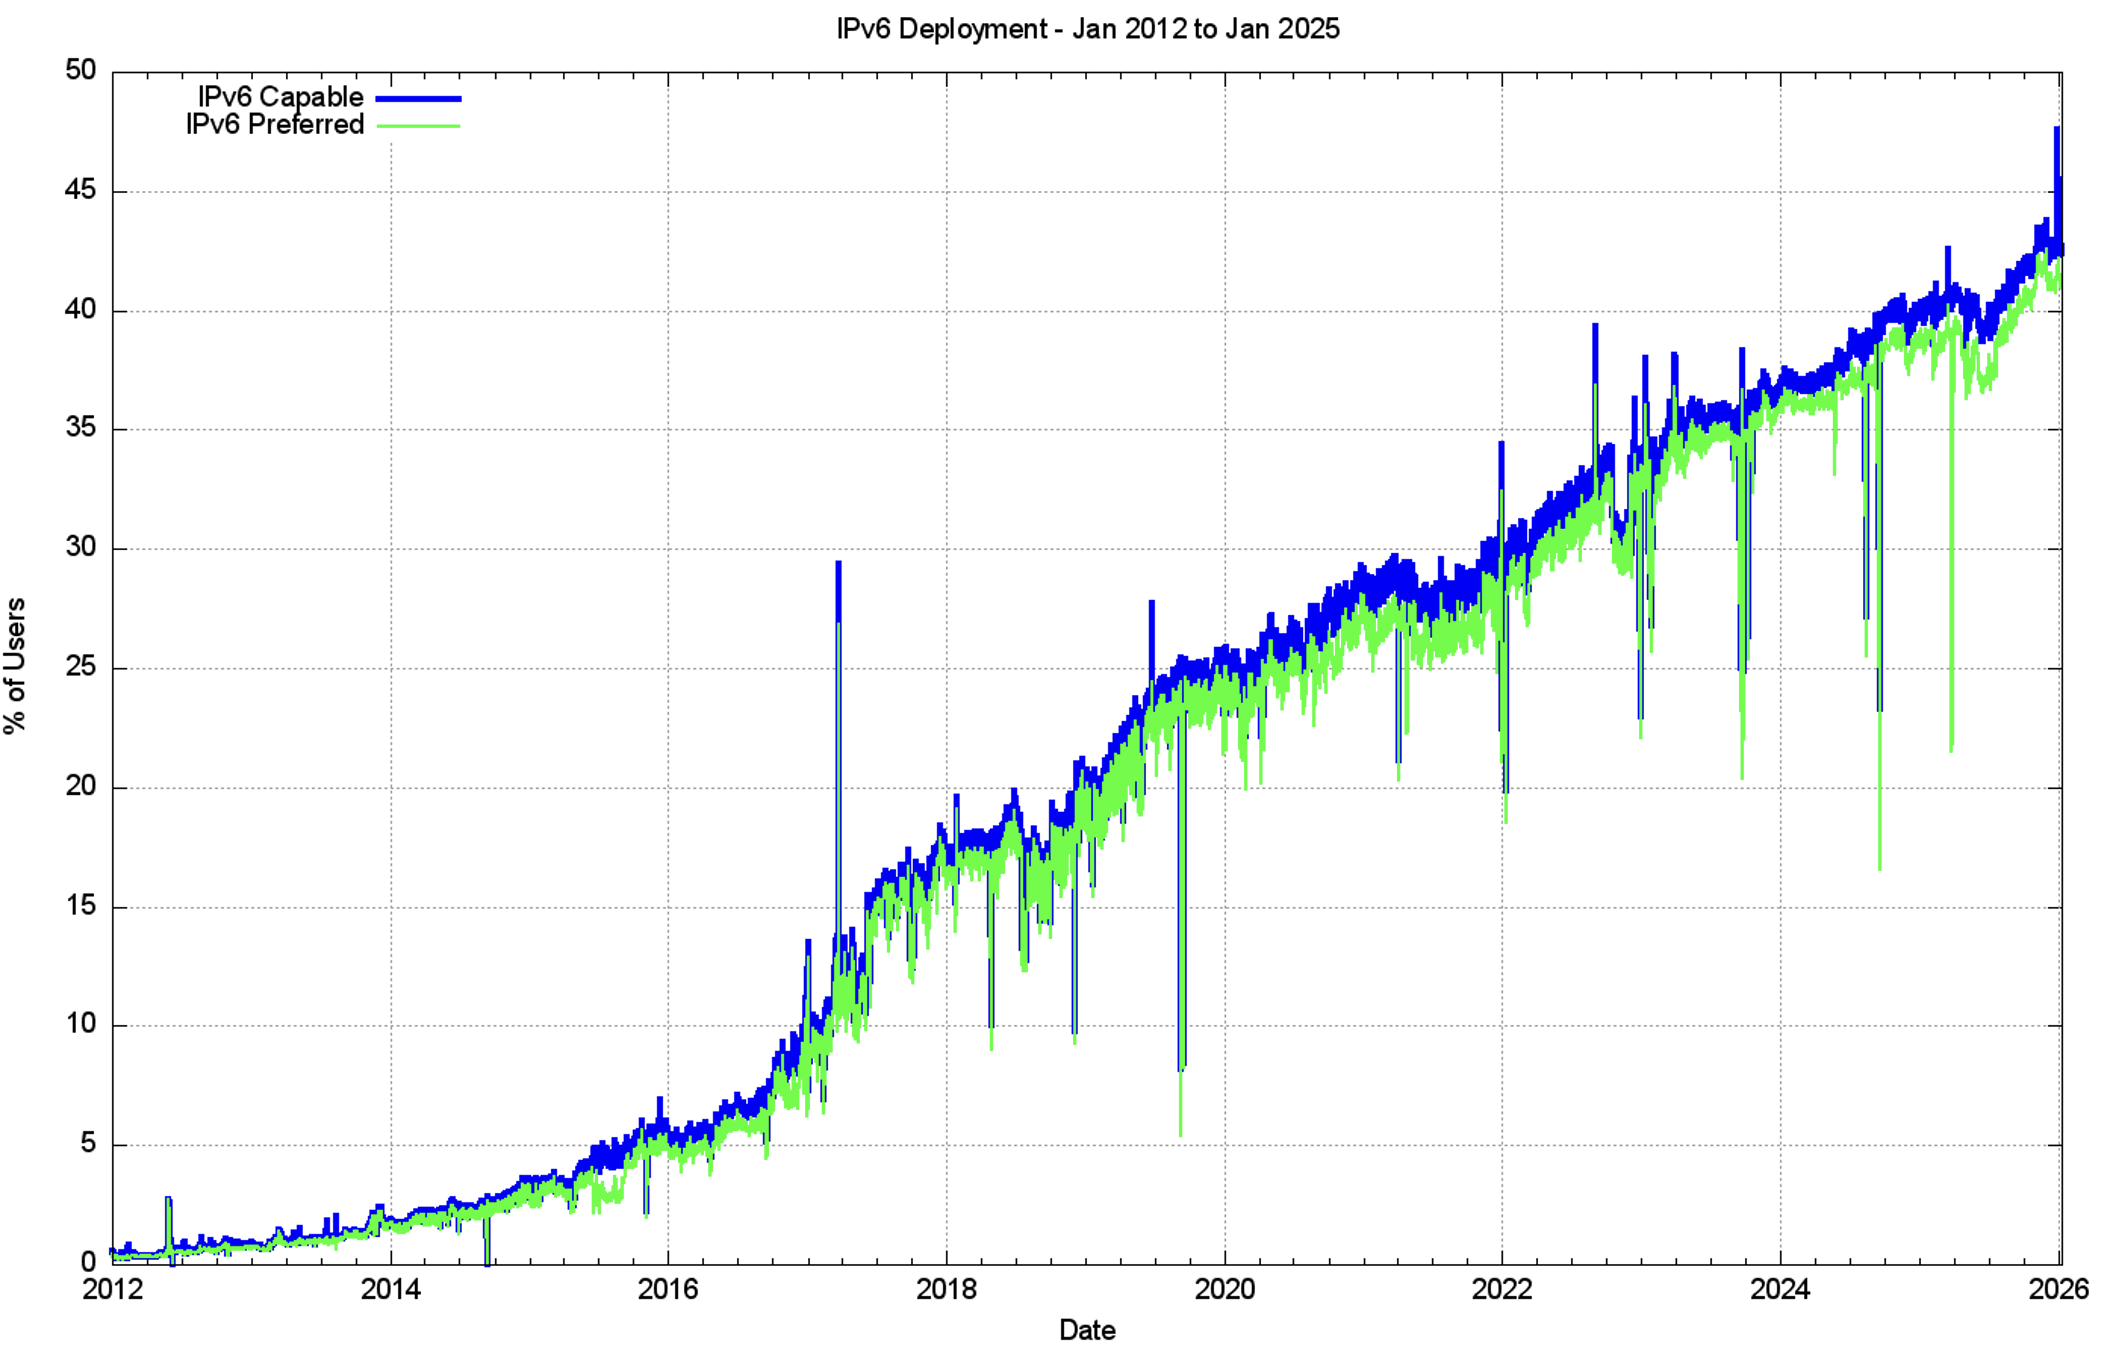
In 2025, the growth patterns of IPv6 were more diffuse around the world, with a 3.7% global growth rate (Figure 22).
Some service operators have reached the decision point that the anticipated future costs of NAT deployment are unsustainable for their service platform. There also remains a considerable body of opinion that says it’s cost-effective to use NATs to absorb further years of Internet growth. At least, that’s the rationale I can ascribe to a large number of service providers who are making no visible moves to deploy dual-stack services.
Given that the endpoint of this transition is not to turn on dual-stack everywhere, but to turn off IPv4, there is still some time to go. The uncertainty lies in trying to quantify what that time might be.
Mobile internet services have dominated the past decade, and the Internet’s growth rates from 2014 to 2016 have been the highest so far recorded. This would’ve been visible in the IP address deployment data were it not for the exhaustion of the IPv4 address pool. In address terms, this growth in the IPv4 Internet is being almost entirely masked by the use of CGNATs in the mobile service provider environment.
In IPv6, a single IPv6 /20 allocation to an ISP allows for 268M /48 allocations, or 68B /56 allocations. Much of the growth in IPv6-using networks hides behind the protocol’s massive address plan.
We assumed we would see IPv6 address demands for deployments of large-scale sensor networks and other deployments that encompassed the broad umbrella of the Internet of Things (IoT). This does not necessarily imply that the deployment is merely a product of an overhyped industry, although that is always a possibility. It’s more likely to assume that, so far, such deployments are taking place using IP addresses in a private context, using application-level gateways to interface to the public network.
On the private side, the protocol could be IPv4 or IPv6 — the choice does not matter — a private deployment relies on NATs in any case. We are told that NATs are not a good security device. In practice, NATs offer a reasonable front-line defence against network-side malware scanning and injection. There may be a larger story behind the use of NATs and device-based networks than a simple conservative preference to continue to use an IPv4 protocol stack.
More generally, we are witnessing an industry that is no longer using technical innovation, openness, and diversification as its primary means of expansion.
The widespread use of NATs in IPv4 limits the technical substrate of the Internet to a restricted model of simple client/server interactions using TCP and UDP. NATs force client-initiated transactions, and the model of an open network with considerable flexibility in the way in which communications take place is less relevant today.
Incumbents are entrenching their position. Innovation and entrepreneurialism are taking a backseat while we sit out this protracted IPv4/IPv6 transition.
You could argue that this is a sign of technical maturity, when all players use a small number of deployment models as being best suited to the environment of deployment. Our efforts to have hosts capable of countering all forms of hostile attack have somewhat worked. This form of masked deployment, where hosts sit behind some form of device that can deflect unsolicited traffic, may be mandatory on today’s Internet.
An ever-smaller number of large players provide today’s Internet carriage service, each of whom appears to be assuming a strong position within their respective markets. The drivers for such larger players tend towards risk aversion, conservatism, and increased levels of control across their scope of operation. The same trends of market aggregation are now appearing in content provision platforms, where a small number of platform operators are exerting a dominant position across the entire Internet.
The evolving makeup of the Internet industry has profound implications. It impacts network neutrality, the separation of functions of carriage and service provision, investment profiles, expectations of risk and returns on infrastructure investments, and the openness of the Internet itself.
Given the economies of volume in this industry, sustaining an efficient, fully open, and competitive industry platform that is capable of sustaining both large and small operators was always going to be a challenge. The challenge is even greater when the underlying platform has run out of the basic currency of IP addresses. The pressures on the larger players within these markets to leverage their incumbency into overarching control gain traction when the stream of new entrants with competitive offerings dries up. The solutions in such scenarios typically involve some form of public sector intervention directed to restore effective competition and revive the drive for more efficient and effective offerings in the market.
As the Internet continues to evolve, the technically innovative challenger is no longer pitted against venerable incumbents in telephony, print newspapers, television entertainment, and social interaction. The Internet is now the established norm. The days of the Internet as a disruptor in a deregulated space are long since over. These days, we appear to be increasingly looking further afield for a regulatory and governance framework that can challenge the increasing complacency of the small number of massive digital incumbents.
It’s unclear how successful we will be in this search for responses to this oppressive level of centrality in aspects of the digital environment. We can but wait and see.
The views expressed by the authors of this blog are their own and do not necessarily reflect the views of APNIC. Please note a Code of Conduct applies to this blog.