

It’s time for another annual roundup from the world of IP addresses. Let’s see what has changed in the past 12 months in addressing the Internet and how IP address allocation information can inform us of the changing nature of the network itself.
Back around 1992, the Internet Engineering Task Force (IETF) gazed into their crystal ball and tried to understand how the Internet was going to evolve and what demands that would place on the addressing system as part of the ‘IP Next Generation’ study. The staggeringly large numbers of connected devices that we see today were certainly within the range predicted by that exercise. Doubtless, these device numbers will continue to grow.
We continue to increase silicon chip production volumes and at the same time continue to refine the production process. But, at that time, we also predicted that the only way we could make the Internet work across such a massive pool of connected devices was to deploy a new IP protocol that came with a massively larger address space. It was from that reasoning that IPv6 was designed, as this world of abundant silicon processors was the issue that IPv6 was primarily intended to solve. The copious volumes of address space were intended to allow us to uniquely assign a public IPv6 address to every such device, no matter how small, or in whatever volume they might be deployed.
But while the Internet has grown at such amazing speed, the deployment of IPv6 continues at a more measured pace. There is still no evidence of any common sense of urgency about the deployment of this protocol, and still, there is no common agreement that the continued reliance on IPv4 is failing us.
Much of the reason for this apparent contradiction between the designed population of the IPv4 Internet and the actual device count, which is many times larger, is that the Internet rapidly changed from a peer-to-peer architecture to a client/server paradigm. Clients can initiate network transactions with servers but are incapable of initiating transactions with other clients.
Network Address Translators (NATs) are a natural fit for this client / server model, where pools of clients share a smaller pool of public addresses, and only require the use of an address while they have an active session with a remote server. NATs are the reason why more than 30 billion connected devices can be squeezed into some three billion advertised IPv4 addresses. Applications that cannot work behind NATs are no longer useful and no longer used.
However, the pressures of this inexorable growth in the number of deployed devices in the Internet means that even NATs cannot absorb these growth pressures forever. NATs can extend the effective addressable space by up to 32 ‘extra’ bits, and they enable the time-based sharing of addresses. Both of these measures are effective in stretching the IPv4 address space to encompass a larger client device pool, but they do not transform the address space into an infinitely elastic resource.
The inevitable outcome of this process is that we may see the fragmenting of the IPv4 Internet into a number of disconnected parts, probably based on the service ‘cones’ of the various points of presence of the content distribution servers, so that the entire concept of a globally unique and coherent address pool layered over a single coherent packet transmission realm will be foregone.
Alternatively, we may see these growth pressures motivate the further deployment of IPv6, and the emergence of IPv6-only elements of the Internet as the network itself tries to maintain a cohesive and connected whole. There are commercial pressures pulling the network in both directions, so it’s entirely unclear what path the Internet will follow in the coming years, but my (admittedly cynical and perhaps jaded) personal opinion lies in a future of highly fragmented networks.
Can address allocation data help us to shed some light on what is happening in the larger Internet? Let’s look at what happened in 2023.
IPv4 in 2023
It appears that the process of exhausting the remaining pools of unallocated IPv4 addresses is proving to be as protracted as the process of the transition to IPv6, although by the end of 2021, the end of the old registry allocation model had effectively occurred with the depletion of the residual pools of unallocated addresses in each of the Regional Internet Registries (RIRs).
It is difficult to talk about ‘allocations’ in today’s Internet. There is still a set of transactions where addresses are drawn from the residual pools of RIR-managed available address space and allocated or assigned to network operators, but at the same time, there are also a set of transactions where addresses are traded between networks in what is essentially a sale. These address transfers necessarily entail a change of registration details, so the registry records the outcome of a transfer, or sale, in a manner that is like an allocation or assignment.
If we want to look at the larger picture of the amount of IPv4 address space that is used or usable by Internet network operators, then perhaps the best metric to use is the total span of allocated and assigned addresses, and the consequent indication of annual change in the change in this total address span from year to year.
What is the difference between ‘allocated’ and ‘assigned’?
When a network operator or sub-registry has received an allocation, it can further delegate that IP address space to its customers along with using it for their own internal infrastructure. When a network operator has received an assignment, this can only be used for their own internal infrastructure.
I personally find the distinction between these two terms somewhat of a distracting artifice these days, so from here on I’ll use the term ‘allocation’ to describe both allocations and assignments.
For the first time in the IPv4 Internet, the total IPv4 allocated address pool contracted by some 400 thousand addresses in 2023, with some 3.685 billion allocated addresses at the end of the year. This represents a contraction of some 0.01% for the total allocated IPv4 public address pool (Table 1).
| 2010 | 2011 | 2012 | 2013 | 2014 | 2015 | 2016 | 2017 | 2018 | 2019 | 2020 | 2021 | 2022 | 2023 | |
| Address span (billions) | 3.227 | 3.395 | 3.483 | 3.537 | 3.593 | 3.624 | 3.643 | 3.657 | 3.657 | 3.682 | 3.684 | 3.685 | 3.687 | 3.686 |
| Annual change (millions) | 241.7 | 168.0 | 88.4 | 53.9 | 55.9 | 30.6 | 19.4 | 13.2 | 0.6 | 24.9 | 2.2 | 1.1 | 1.6 | -0.4 |
| Relative growth | 8.1% | 5.2% | 2.6% | 1.5% | 1.6% | 0.85% | 0.53% | 0.36% | 0.02% | 0.68% | 0.06% | 0.03% | 0.04% | 0.01% |
Table 1 — IPv4 allocated addresses by year.
Have we exhausted all the available sources of IPv4 addresses? The address management model is that unallocated addresses are held in a single pool by the Internet Assigned Numbers Authority (IANA), and blocks of addresses are passed to RIRs who then allocate them to various end entities, either for their own use or for further allocation. But, IANA exhausted the last of its available address pools some years ago, and these days it holds just three /24 address prefixes. Because the option of dividing this tiny address pool into five equal chunks of 153.6 individual addresses is not viable, then these addresses are likely to sit in the IANA recovered address registry for some time.
That is, until one or more of the RIRs return more prefixes recovered from the old ‘legacy’ allocated addresses to IANA, who would then be able to divide the pool equally and distribute them to each of the five RIRs. This is unlikely to occur.
Some addresses have been marked by IANA as reserved. This includes blocks of addresses reserved for multicast use. At the top end of the IPv4 address space registry there is a set of addresses that are anomalously marked as reserved for future use. This is a relatively large pool of 268,435,456 addresses (the old former ‘Class E’ space) and if ever there was a ‘future’ for IPv4 then it has well and truly come and gone. But exactly how to unlock this space and return it to the general use pool is a problem that, so far, has not found a generally workable solution, although efforts to do so have surfaced in the community from time to time.
The topic of releasing the Class E space for use in the public Internet as a globally routable unicast address space has been raised from time to time over the past 15 years or so. Some Internet drafts were published for the IETF’s consideration that either directly proposed releasing this space for use, or outlined the impediments in various host and router implementations that were observed to exist in 2008 when these drafts were being developed.
The proposals lapsed, probably due to the larger consideration at the time that the available time and resources to work on these issues were limited and the result of effort spent in ‘conditioning’ this IPv4 space for general use was only going to obtain a small extension in the anticipated date of depletion of the remaining IPv4 address pools, while the same amount of effort spent on working on advancing IPv6 deployment was assumed to have a far larger beneficial outcome.
From time to time this topic reappears on various mailing lists, but the debates tend to circle around the same set of topics one more time, and then lapse.
As IANA is no longer a source of addresses, then we need to look at the RIR practices to see the life cycle of addresses from the registry’s perspective. When IP address space is returned to the RIR or reclaimed by the RIR according to the RIR’s policies it is normally placed in a RIR-reserved pool for a period and marked as reserved by the RIR. Marking returned or recovered addresses as reserved for a period allows various address prefix reputation and related services, including routing records, some time to record the cessation of the previous state of the address prefix, before any subsequent allocation. Following this quarantine period, which has been between some months and some years, this reserved space is released for reuse.
The record of annual year-on-year change in allocated addresses per RIR over the same thirteen-year period is shown in Table 2. There are some years when the per-RIR pool of allocated addresses shrunk in size. This is generally due to inter-RIR movement of addresses, due to administrative changes in some instances and inter-RIR address transfers in others.
| 2010 | 2011 | 2012 | 2013 | 2014 | 2015 | 2016 | 2017 | 2018 | 2019 | 2020 | 2021 | 2022 | 2023 | |
| APNIC | 119.5 | 101.0 | 0.6 | 1.2 | 4.6 | 7.4 | 6.7 | 3.2 | 0.4 | 10.5 | 1.7 | 1.5 | 0.8 | -1.1 |
| RIPE NCC | 52.3 | 40.5 | 37.8 | 1.0 | 33.8 | 4.7 | 4.1 | 3.7 | 0.3 | 12.0 | 0.4 | 2.5 | 4.7 | 6.2 |
| ARIN | 27.2 | 53.8 | 24.3 | 19.0 | -14.1 | 2.3 | -4.8 | -2.3 | -0.3 | -10.1 | -0.9 | -1.7 | -3.8 | -5.5 |
| LACNIC | 17.1 | 13.6 | 17.3 | 26.3 | 18.7 | 1.2 | 1.5 | 1.4 | 0.1 | 2.4 | 1.2 | -0.2 | -0.3 | -0.1 |
| AFRINIC | 8.8 | 9.4 | 8.5 | 6.3 | 12.8 | 15.0 | 11.9 | 7.1 | 0.2 | 10.1 | -0.2 | -0.9 | 0.2 | 0.1 |
| TOTAL | 224.9 | 218.3 | 88.5 | 53.8 | 55.8 | 30.6 | 19.4 | 13.1 | 0.7 | 24.9 | 2.2 | 1.2 | 1.6 | -0.4 |
Table 2 — Annual change in IPv4 allocated addresses (millions). Distribution by RIR.
Each of the RIRs is running through their final pools of IPv4 addresses. At the end of 2023, across the RIR system, there are some 3.6 million addresses in the available pool, held mainly in APNIC (2.5M) and AFRINIC (1.2M). Some 12.5M addresses are marked as reserved, with 5.2M held by ARIN and 4M addresses held by AFRINIC. As seen in Table 3, there has been some small net reduction in the reserved pool in ARIN (98K) and the RIPE NCC (26K), while the reserved pool in APNIC has risen by 687K addresses, with smaller increases in LACNIC and AFRINIC.
| Available | Reserved | |||||
| RIR | 2021 | 2022 | 2023 | 2021 | 2022 | 2023 |
| APNIC | 3,533,056 | 2,503,424 | 2,469,120 | 1,787,904 | 1,514,752 | 2,202,624 |
| RIPE NCC | - | - | 1,024 | 762,104 | 737,496 | 708,872 |
| ARIN | 4,608 | 8,448 | 8,960 | 5,244,160 | 5,311,488 | 5,213,184 |
| LACNIC | 7,168 | 1,024 | 256 | 224,768 | 148,480 | 151,296 |
| AFRINIC | 1,652,480 | 1,403,136 | 1,201,664 | 4,065,024 | 4,104,960 | 4,186,112 |
| TOTAL | 5,197,312 | 3,916,032 | 3,681,024 | 12,083,960 | 11,817,176 | 12,462,088 |
Table 3 — IPv4 available and reserved pools, December 2022.
The RIR IPv4 address allocation volumes by year are shown in Figure 1, but it is challenging to understand precisely what is meant by an allocation across the entire RIR system as there are some subtle but important differences between RIRs, particularly as they relate to the handling of transfers of IPv4 addresses.
In the case of ARIN, a transfer between two ARIN-serviced entities is conceptually treated as two distinct transactions — a return of the addresses to the ARIN registry and a new allocation from ARIN. The date of the transfer is recorded as the new allocation date in the records published by the RIR. Other RIRs treat an address transfer in a manner analogous to a change of the nominated holder of the already-allocated addresses, and when processing a transfer, the RIR’s records preserve the original allocation date for the transferred addresses. When we look at the individual transaction records in the published RIR data, and collect them by year, then in the case of ARIN the collected data includes the volume of transferred addresses that were processed in that year, while the other RIRs only include the allocations performed in that year.
To provide a view across the entire system it is necessary to use an analysis approach that can compensate for these differences in the ways RIRs record address transactions. In this study, an allocation is defined here as a state transition in the registry records from reserved or available to an allocated state. This is intended to separate out the various actions associated with processing address transfers, which generally involve no visible state change as the transferred address block remains allocated across the transfer from allocations. This is how the data used to generate Figure 1 has been generated from the RIR published data, comparing the status of the address pools at the end of each year to that of the status at the start of the year. An allocation in that year is identified if the allocated address block was not registered as allocated at the start of the year.
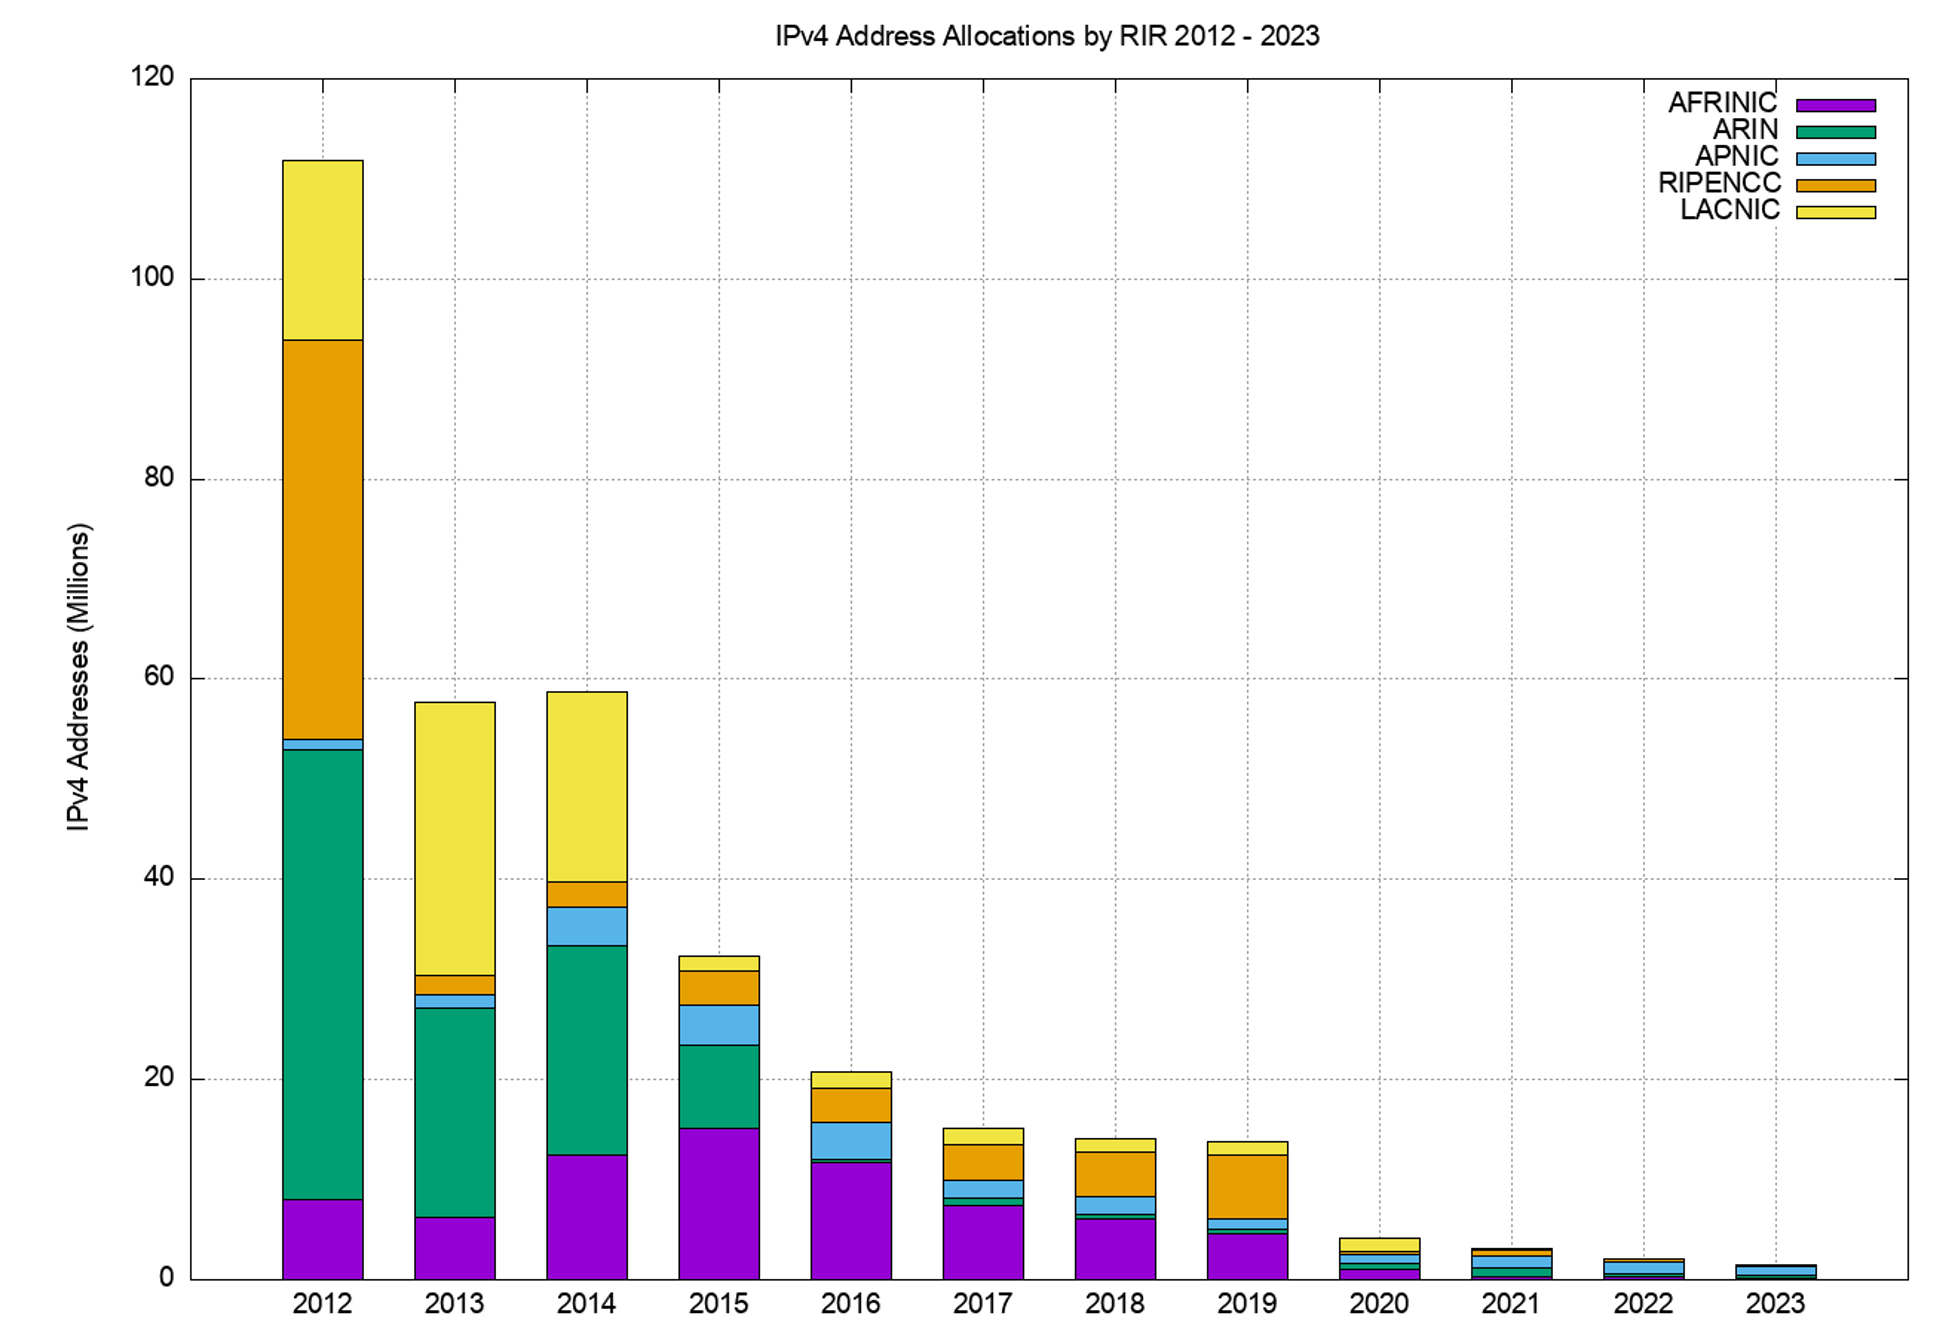
The number of RIR IPv4 allocations by year, once again generated by using the same data analysis technique as used for Figure 1, are shown in Figure 2.
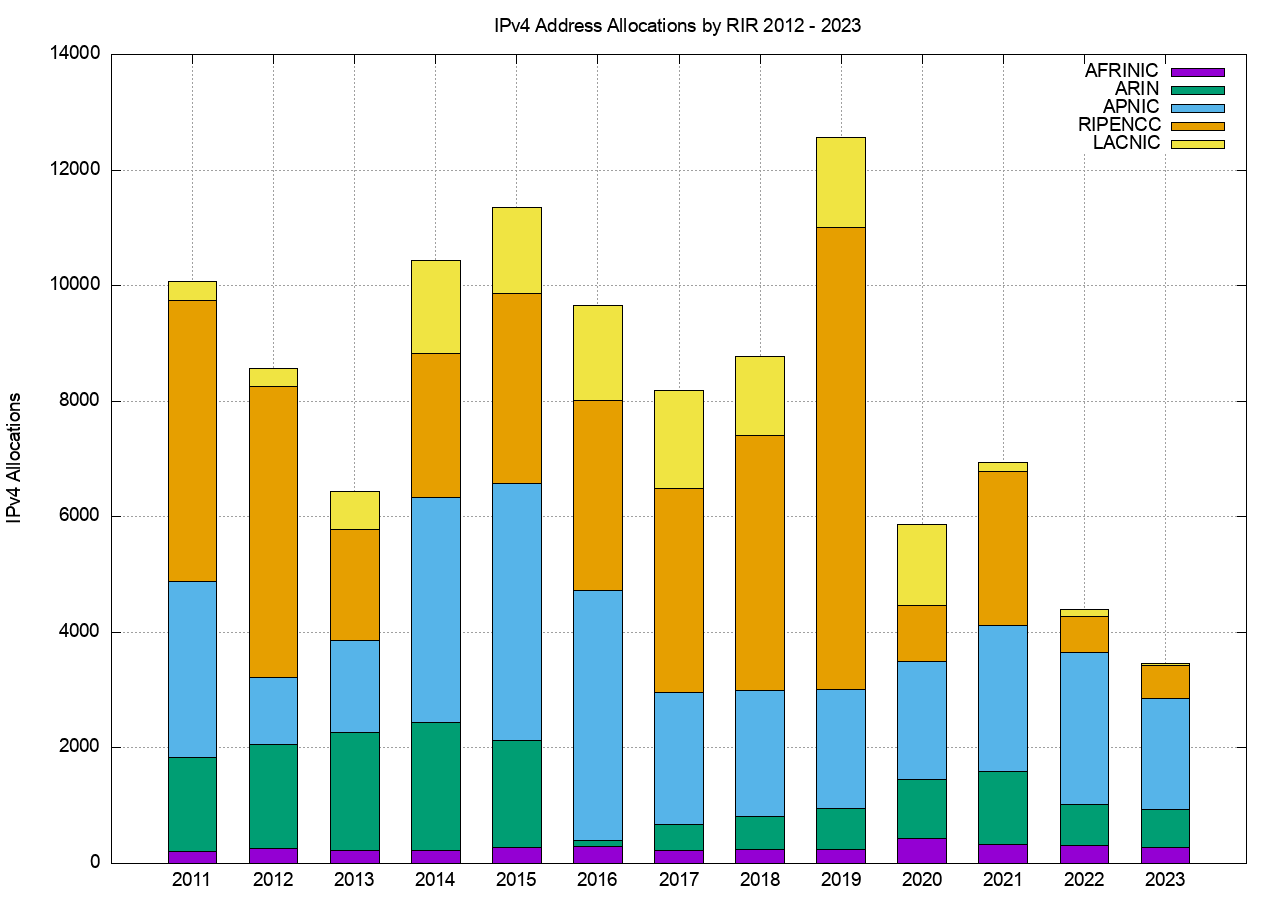
It is clear from these two figures that the average size of an IPv4 address allocation has shrunk considerably in recent years, corresponding to the various IPv4 address exhaustion policies in each of the RIRs.
IPv4 address transfers
In recent years, the RIRs have permitted the registration of IPv4 transfers between address holders, as a means of allowing secondary redistribution of addresses as an alternative to returning unused addresses to the registry. This has been in response to the issues raised by IPv4 address exhaustion, where the underlying motivation is to encourage the reuse of otherwise idle or inefficiently used address blocks through the incentives provided by a market for addresses and to ensure that such address movement is publicly recorded in the registry system.
The number of registered transfers in the past eleven years is shown in Table 4. This number of transfers includes both inter-RIR and intra-RIR transfers. It also includes both the merger and acquisition-based transfers and the other grounds for address transfers. Each transfer is treated as a single transaction, and in the case of inter-RIR transfers, this is accounted for in the receiving RIR’s totals.
| Recieving RIR | 2012 | 2013 | 2014 | 2015 | 2016 | 2017 | 2018 | 2019 | 2020 | 2021 | 2022 | 2023 |
| APNIC | 158 | 180 | 307 | 451 | 840 | 845 | 491 | 533 | 820 | 785 | 745 | 796 |
| RIPE NCC | 10 | 171 | 1,054 | 2,836 | 2,373 | 2,451 | 3,775 | 4,221 | 4,696 | 5,742 | 4,640 | 4,937 |
| ARIN | 3 | 22 | 26 | 26 | 68 | 94 | 150 | 141 | 97 | |||
| LACNIC | 2 | 3 | 9 | 17 | 20 | |||||||
| AFRINIC | 17 | 27 | 26 | 80 | 58 | 14 | ||||||
| Total | 168 | 351 | 1,361 | 3,290 | 3,235 | 3,322 | 4,311 | 4,849 | 5,639 | 6,766 | 5,601 | 5,864 |
Table 4 — IPv4 address transfers per year.
The differences between RIRs reported numbers are interesting. The policies relating to address transfers do not appear to have been adopted to any significant extent by address holders in AFRINIC and LACNIC serviced regions, while uptake in the RIPE NCC service region appears to be very enthusiastic!
A slightly different view is that of the volume of addresses transferred per year (Table 5).
| Recieving RIR | 2012 | 2013 | 2014 | 2015 | 2016 | 2017 | 2018 | 2019 | 2020 | 2021 | 2022 | 2023 |
| APNIC | 1.6 | 2.3 | 4.1 | 6.6 | 8.2 | 4.9 | 10.0 | 4.3 | 16.6 | 6.5 | 3.7 | 2.7 |
| RIPE NCC | 0.1 | 2.0 | 9.6 | 11.6 | 9.2 | 24.6 | 19.5 | 26.9 | 18.2 | 16.2 | 36.9 | 20.8 |
| ARIN | 0.1 | 0.3 | 0.2 | 0.3 | 0.2 | 0.2 | 3.1 | 1.6 | ||||
| LACNIC | ||||||||||||
| AFRINIC | 0.2 | 0.5 | 1.2 | 3.4 | 0.5 | 0.1 | ||||||
| Total | 1.7 | 4.3 | 13.7 | 18.2 | 17.6 | 29.7 | 29.7 | 31.9 | 36.2 | 26.4 | 44.3 | 25.3 |
Table 5 — Volume of transferred IPv4 addresses per year (millions of addresses).
A plot of these numbers is shown in Figures 3 and 4.
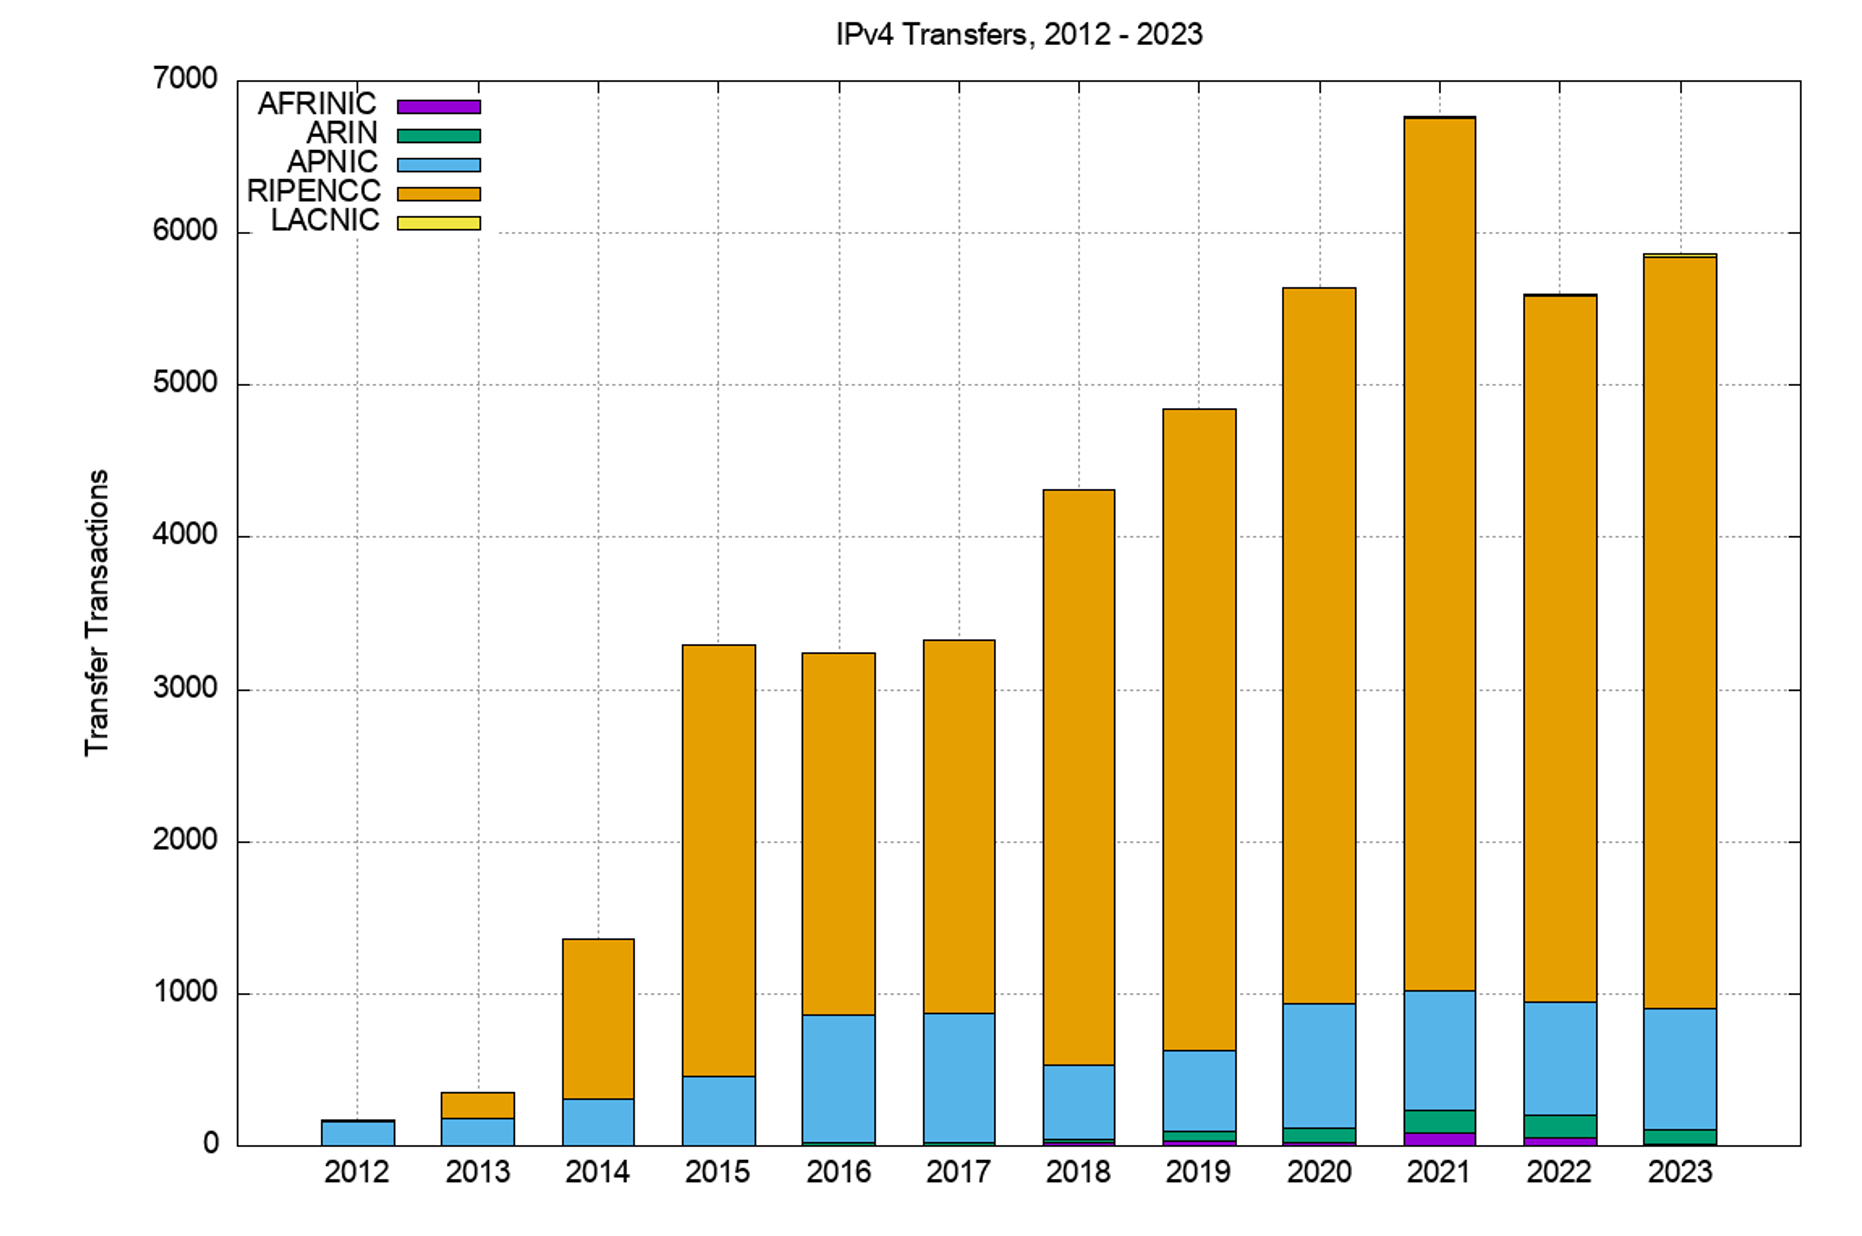
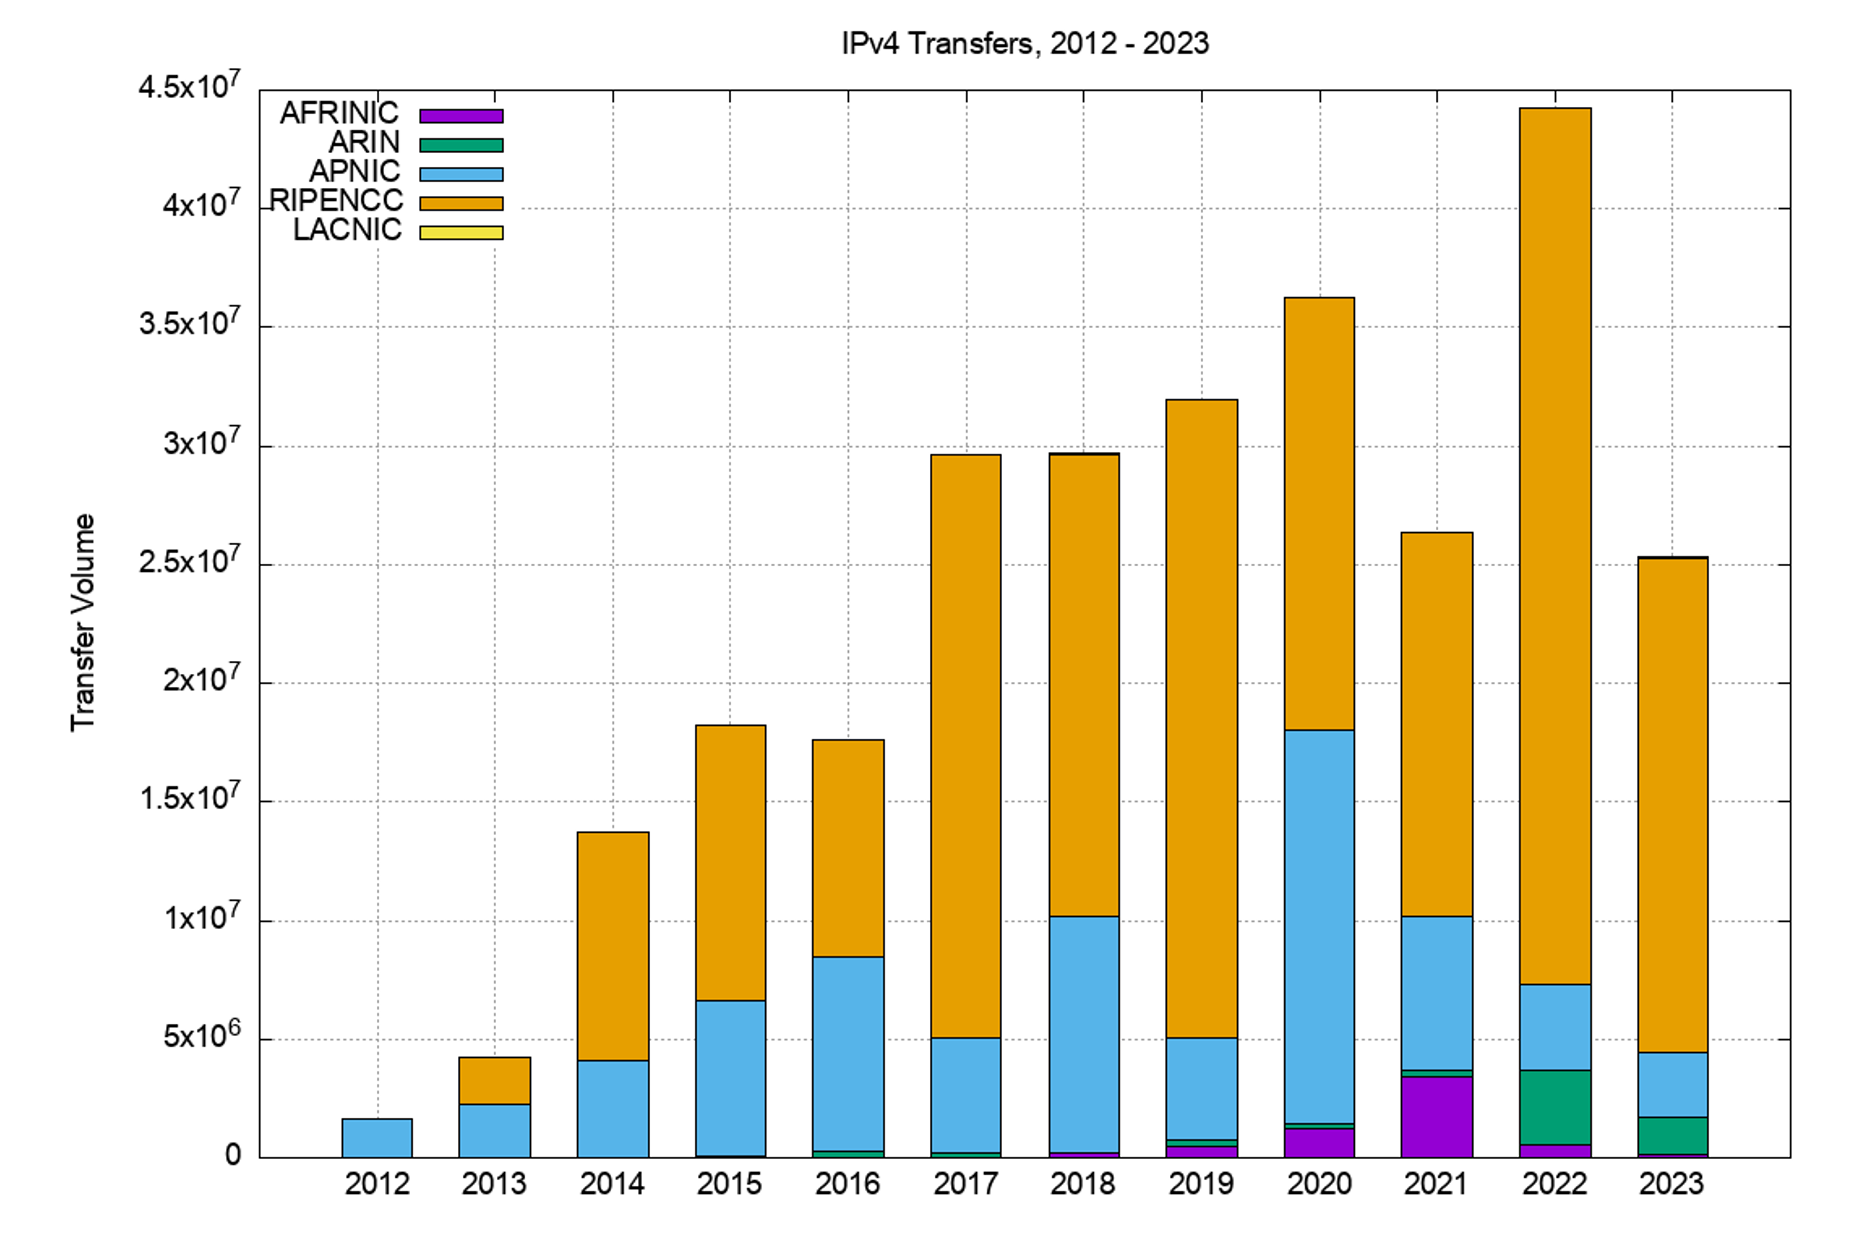
The volume of transferred addresses reached a peak in 2022 and declined in 2023. In the case of APNIC, the peak occurred in 2020, and the APNIC 2023 volume is comparable to the volume transferred in 2012. If address transfers are being used to perform a post-allocation address redistribution function, then the demand for this function appears to be waning across 2023.
The aggregate total of addresses that have been listed in these transfer logs since 2012 is 278M addresses, or the equivalent of 16.5 /8s, which is 7% of the total delegated IPv4 address space of 3.7 billion addresses. However, that figure is likely to be an overestimation, as several address blocks have been transferred multiple times over this period.
Are transfers performing unused address recovery?
This data raises some questions about the nature of transfers. The first question is whether address transfers have managed to be effective in dredging the pool of allocated but unadvertised public IPv4 addresses and recycling these addresses back into active use.
It was thought that by being able to monetize these addresses, holders of such addresses may have been motivated to convert their networks to use private addresses and resell their holding of public addresses. In other words, the opening of a market in addresses would provide an incentive for otherwise unproductive address assets to be placed on the market. Providers who needed addresses would compete with other providers who had a similar need in bidding to purchase these addresses. In conventional market theory, the most efficient (meaning based on the ability to use addresses to generate the greatest revenue) user of addresses would be able to set the market price. Otherwise, unused addresses would be put to productive use, and as long as demand outstrips supply the most efficient use of addresses is promoted by the actions of the market. In theory.
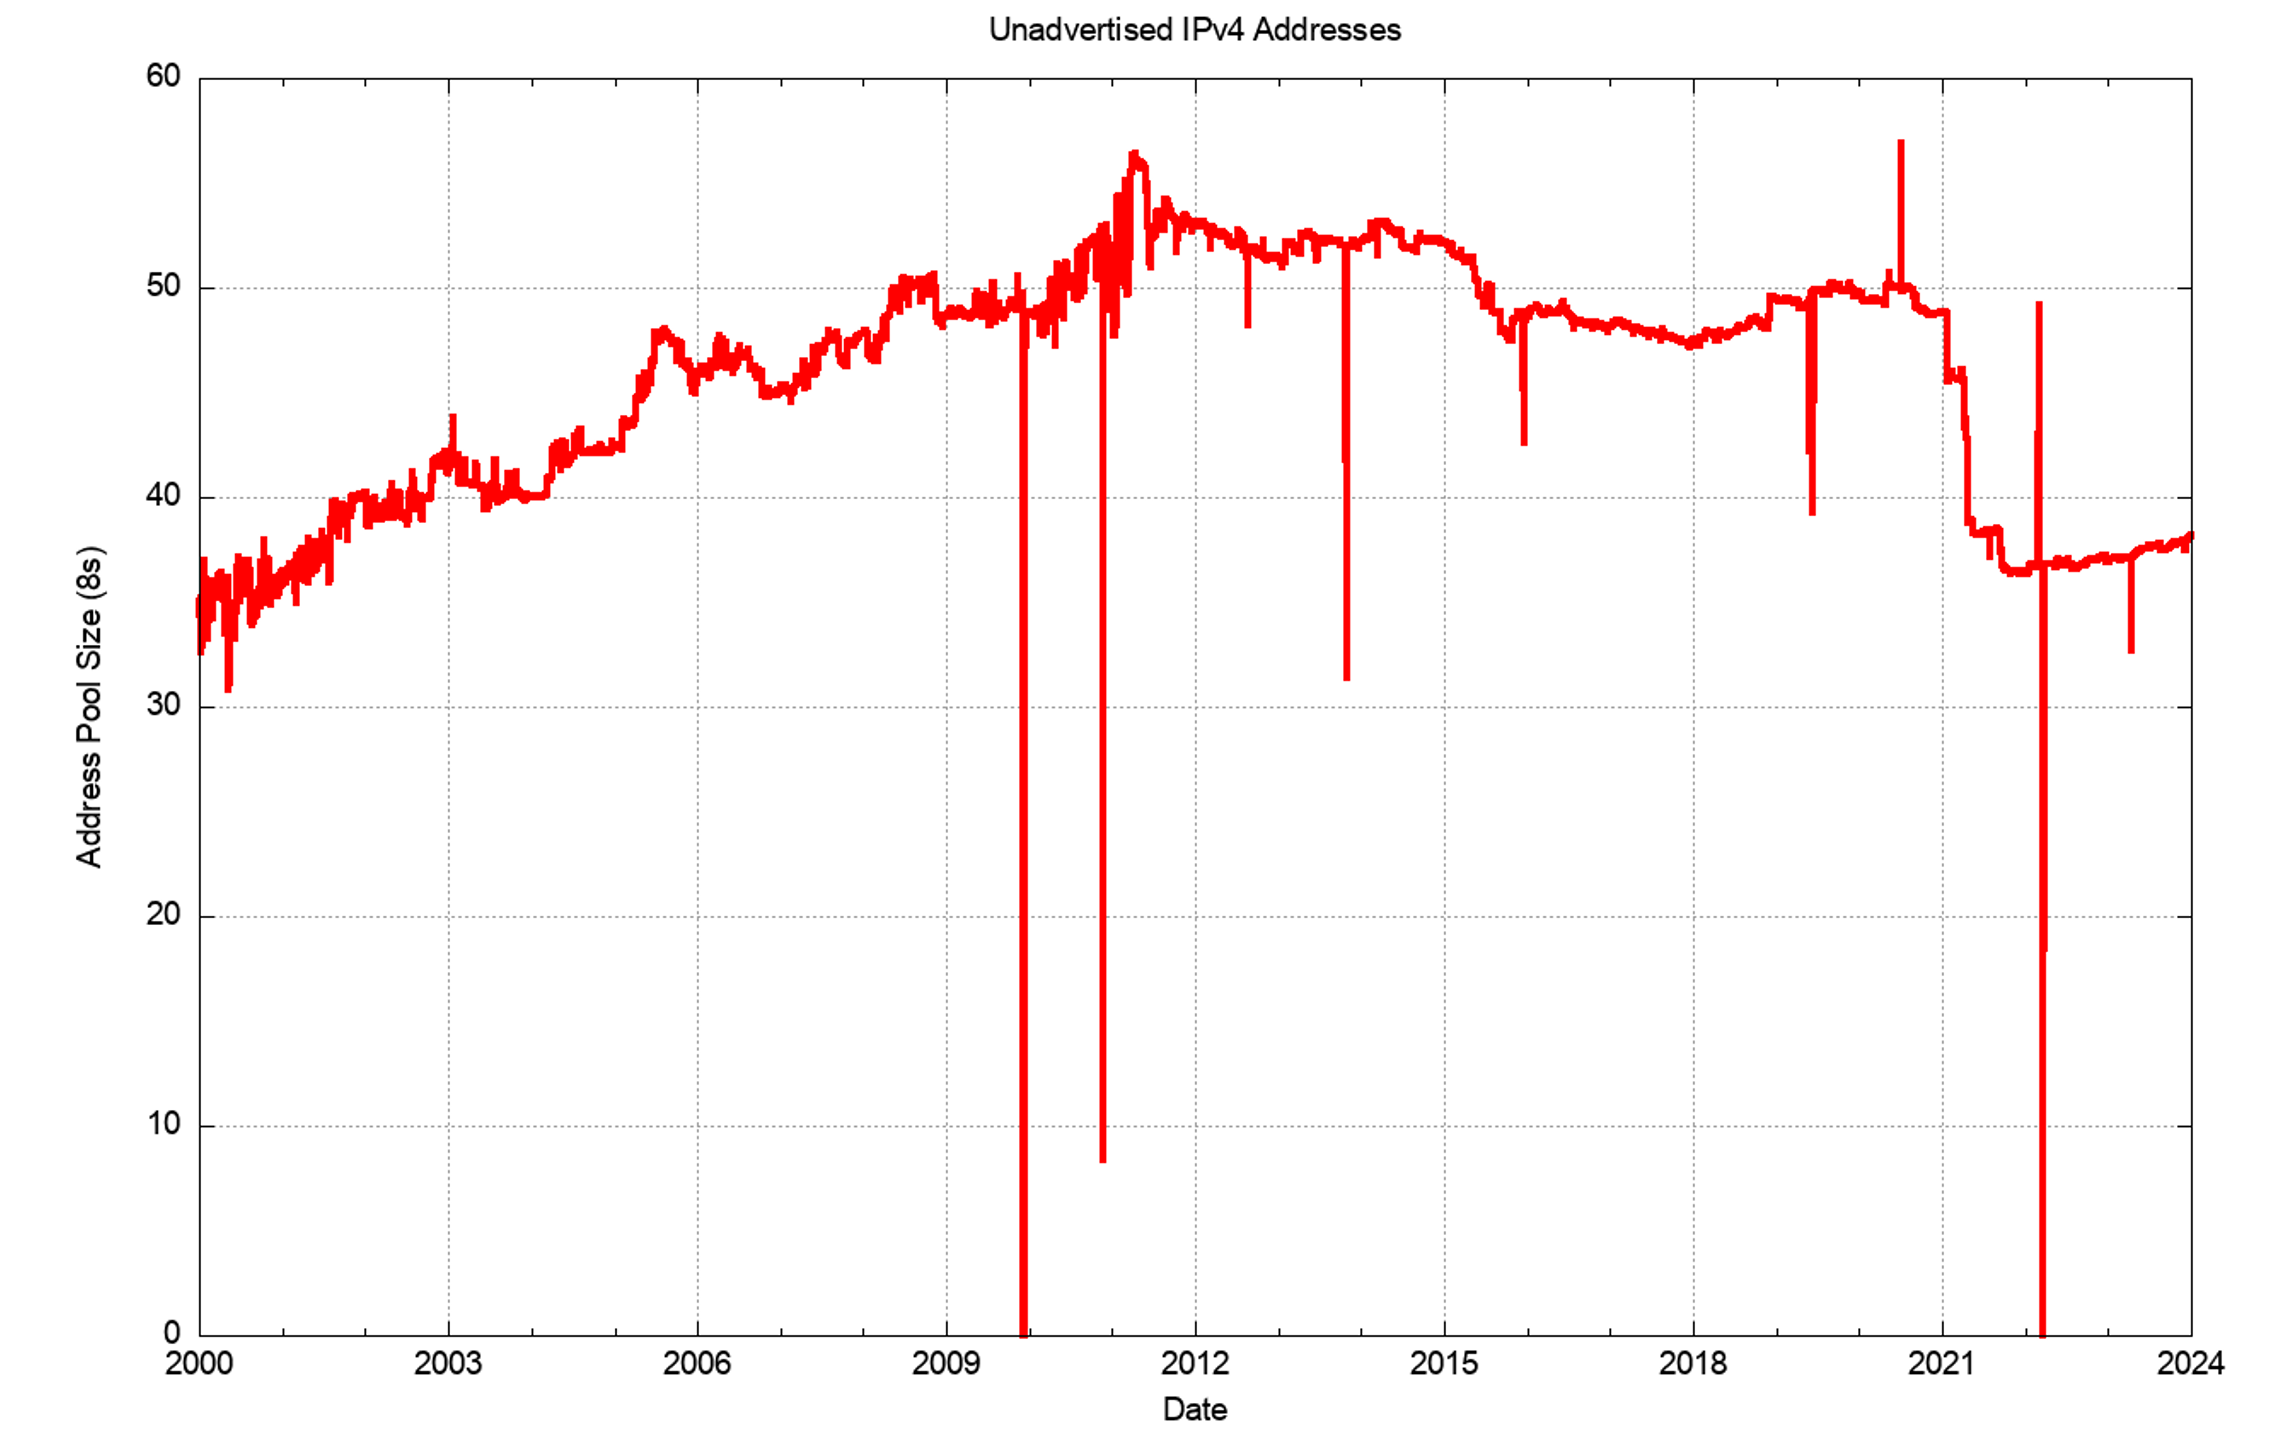
However, the practical experience with transfers is not so clear. The data relating to address recycling is inconclusive, in that between 2011 and late 2017 the pool of unadvertised addresses sat between 38 and 40 /8s. This pool of unadvertised addresses rose from the start of 2018 and by early 2020 there were just under 50 /8s that were unadvertised in the public Internet. This two-year period of increase in the unadvertised address pool appeared to be a period where IPv4 addresses were being hoarded, though such a conclusion from just this high-level aggregate date is highly speculative and probably unjustified.
There has been a substantial reduction in the size of this unadvertised address pool at the start of 2021. The major change in 2021 was the announcement in the Internet’s routing system of some seven /8s from the address space originally allocated to the US Department of Defence in the early days of the then ARPANET. At the end of 2021, AS749 originated more IPv4 addresses than any other network, namely 211,581,184 addresses, or the equivalent of a /4.34 in prefix length notation, or 5% of the total IPv4 address pool.
Across 2022 and 2023 the previous trend of an increasingly large pool of unadvertised addresses resumed its rise.
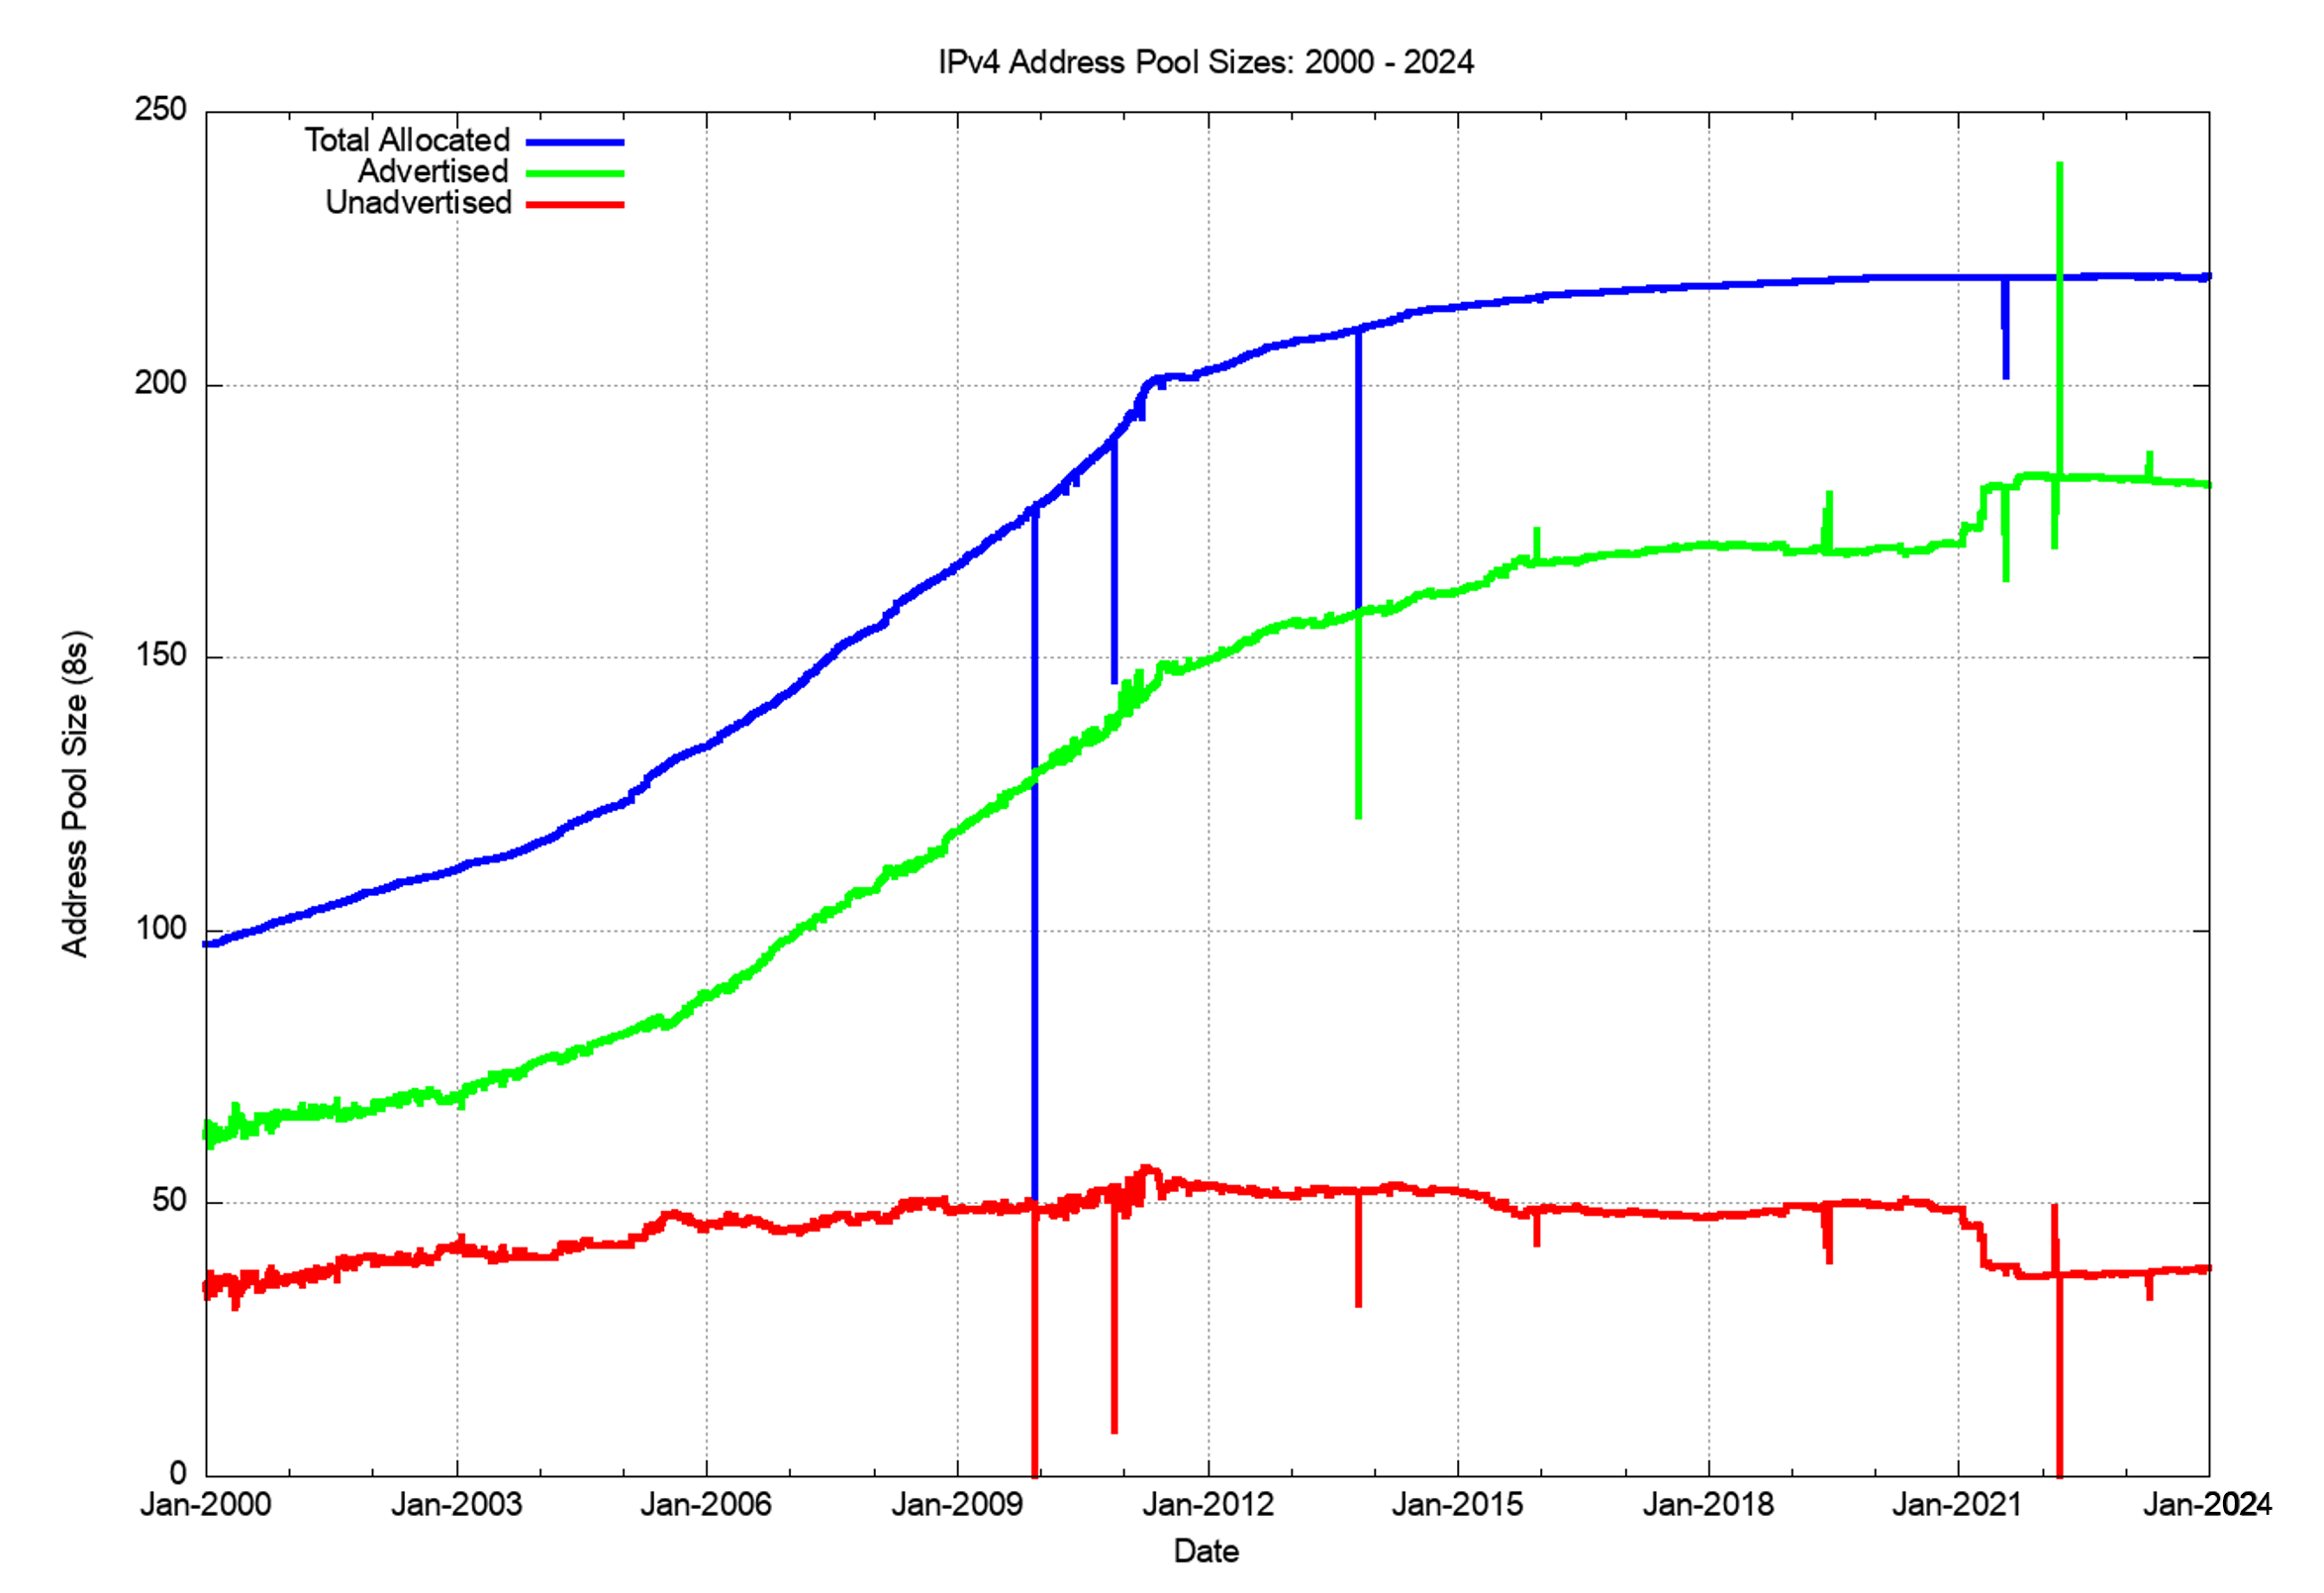
The larger picture of the three IPv4 address pool sizes, allocated, advertised and unadvertised address pools since the start of 2000 is shown in Figure 6a. The onset of more restrictive address policies coincides with the exhaustion of the central IANA unallocated address pool in early 2011, and the period since that date has seen the RIRs run down their address pools.
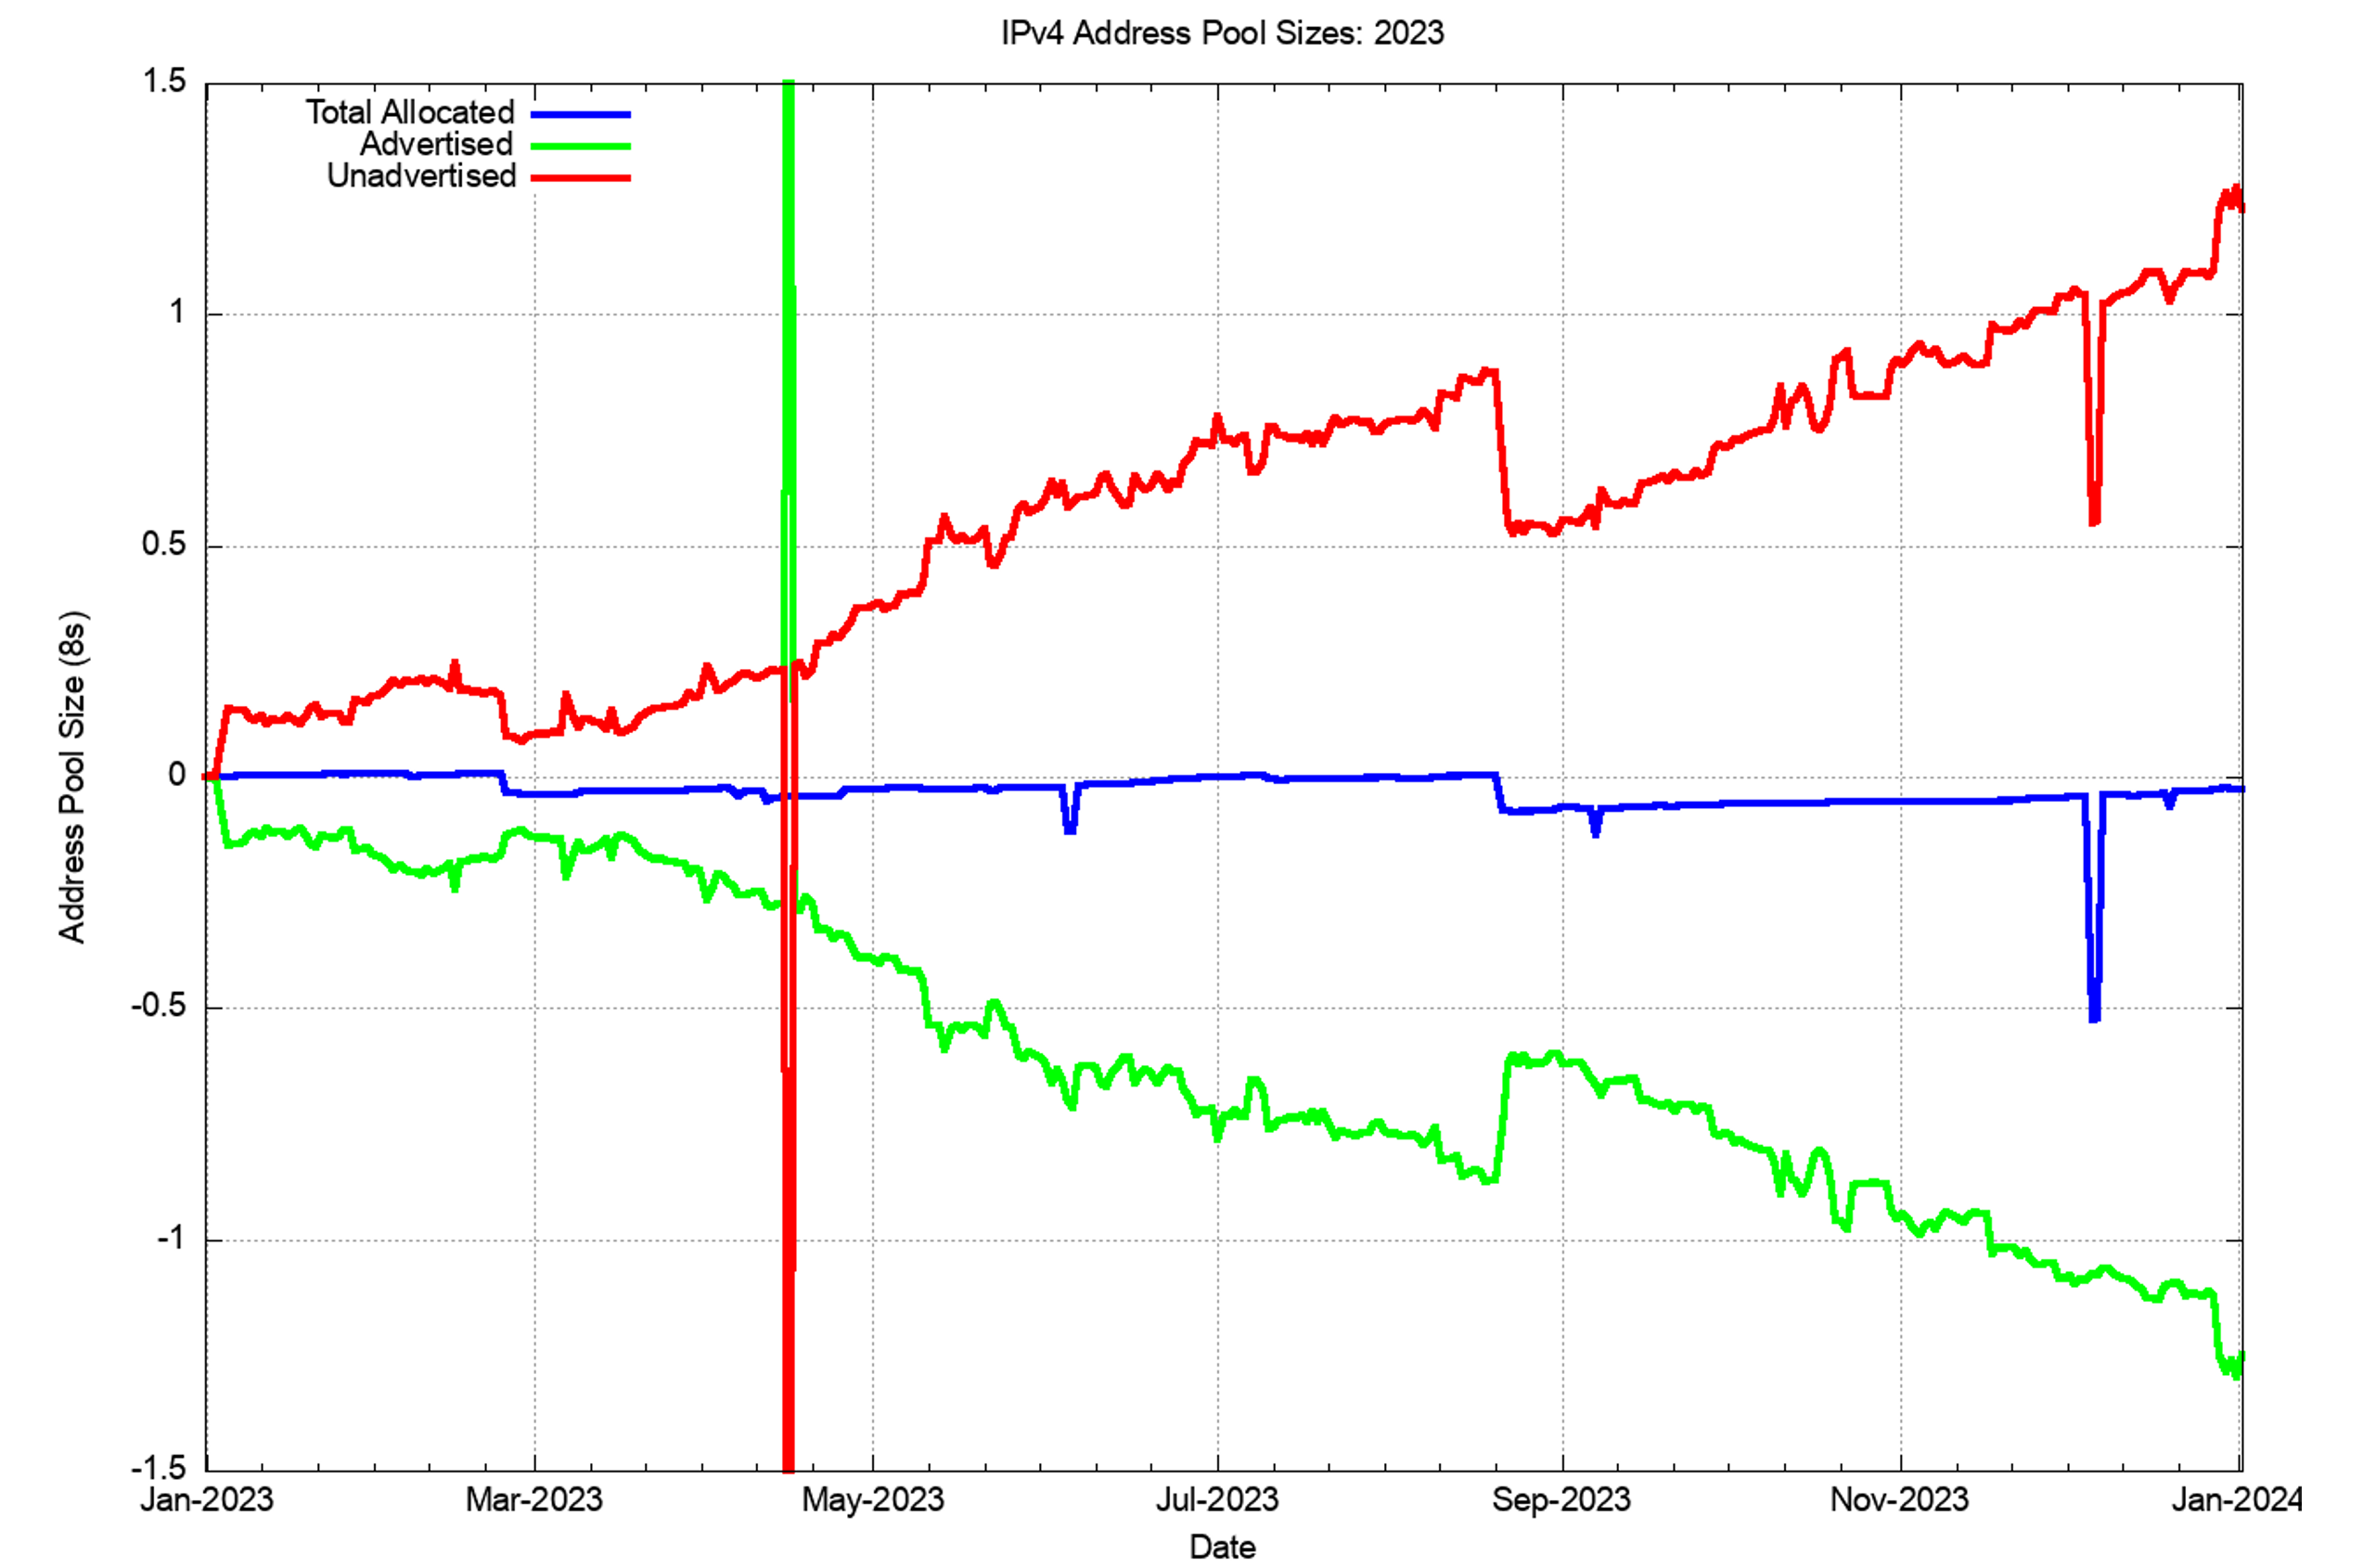
We can also look at 2023, looking at the changes in these address pools since the start of the year, as shown in Figure 6b. The total span of advertised addresses has fallen by some 22M addresses through the year. The RIRs also recorded a net decline of 236,000 allocated addresses for the year. The unadvertised address pool grew by 21M addresses through the year.
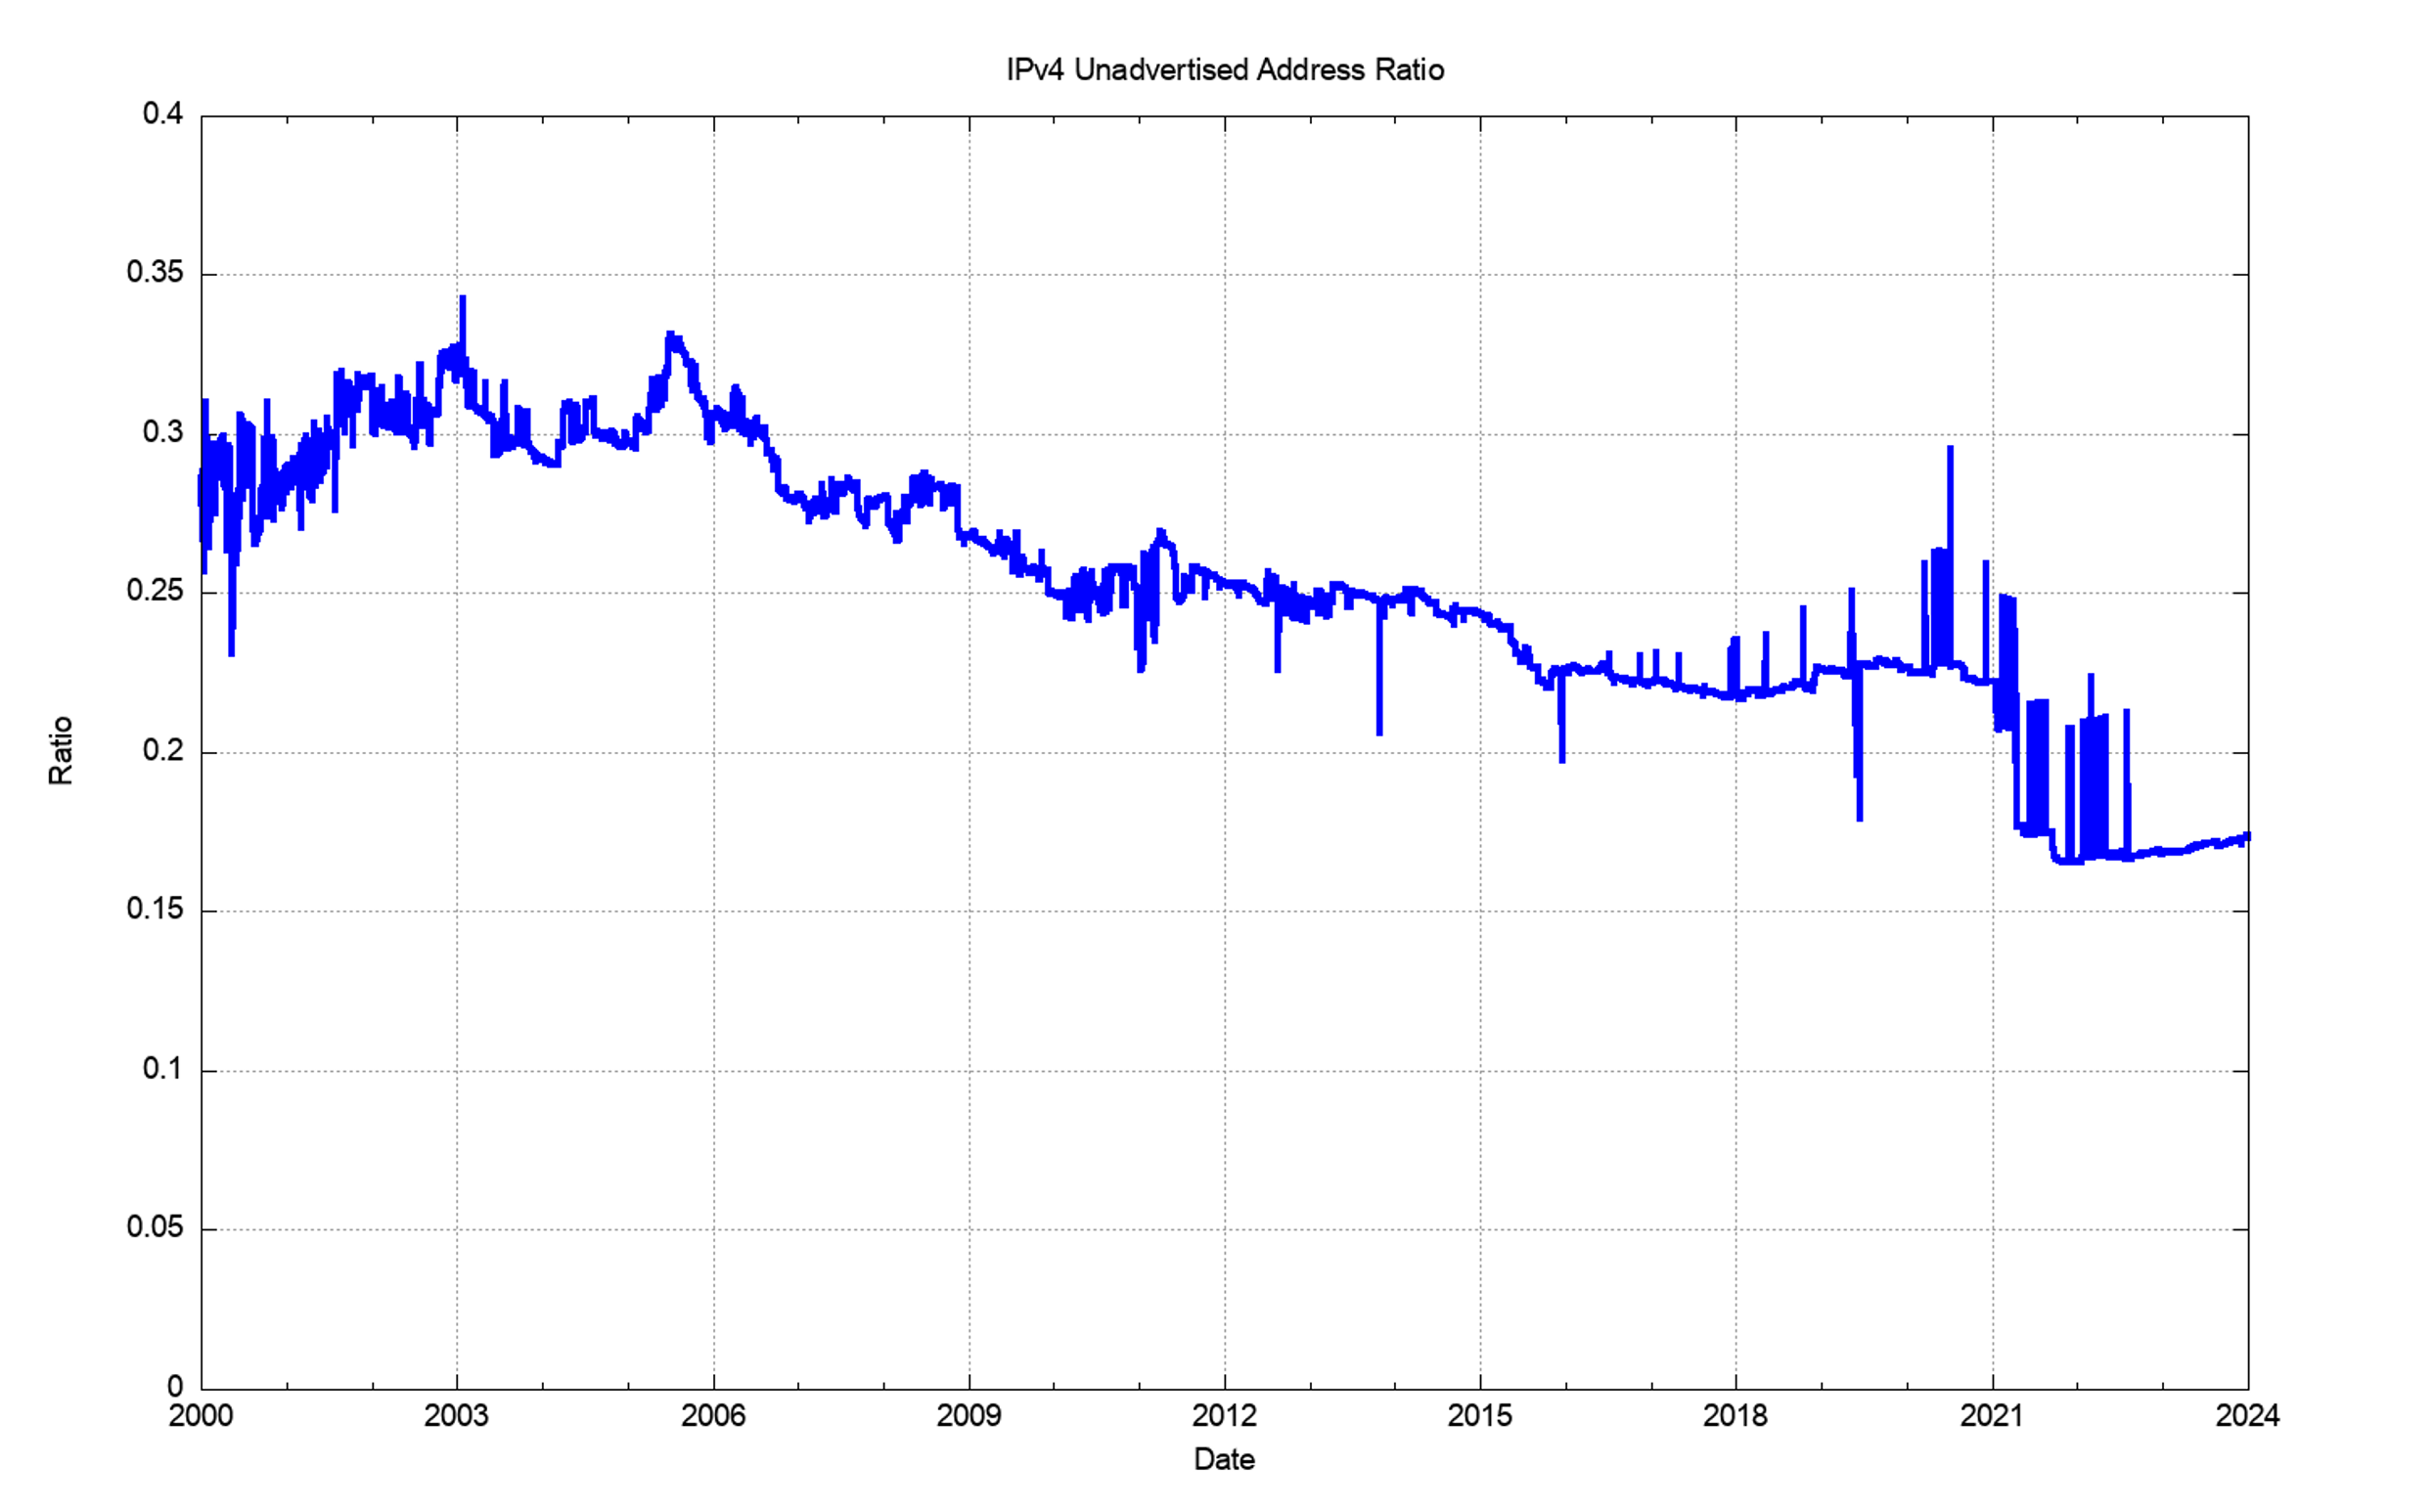
In relative terms, expressed as a proportion of the total pool of allocated IP addresses, the unadvertised address pool dropped from 25% of the total allocated address pool in 2011 to a low of some 22% at the start of 2016 and subsequently rose to 24% by the end of 2020. During 2021, this figure has dropped to 16%, largely due to the advertisement of the legacy US Department of Defence address space, rather than the activation of previously unadvertised address space. This points to the conclusion that address transfer activity has not made any net positive change to the overall picture of address utilization efficiency in the past 12 months (Figure 7).
This data also shows a somewhat sluggish transfer market. The number of transfer transactions is rising, but the total volume of transferred addresses is falling for most RIRs, except for the RIPE NCC (Tables 4 and 5) region. The address market does not appear to have been effective in flushing out otherwise idle addresses and redeploying them into the routed network.
However, as with all other commodity markets, the market price of the commodity reflects the balancing of supply and demand and the future expectations of supply and demand. What can be seen in the price of traded IPv4 addresses over the past eight years?
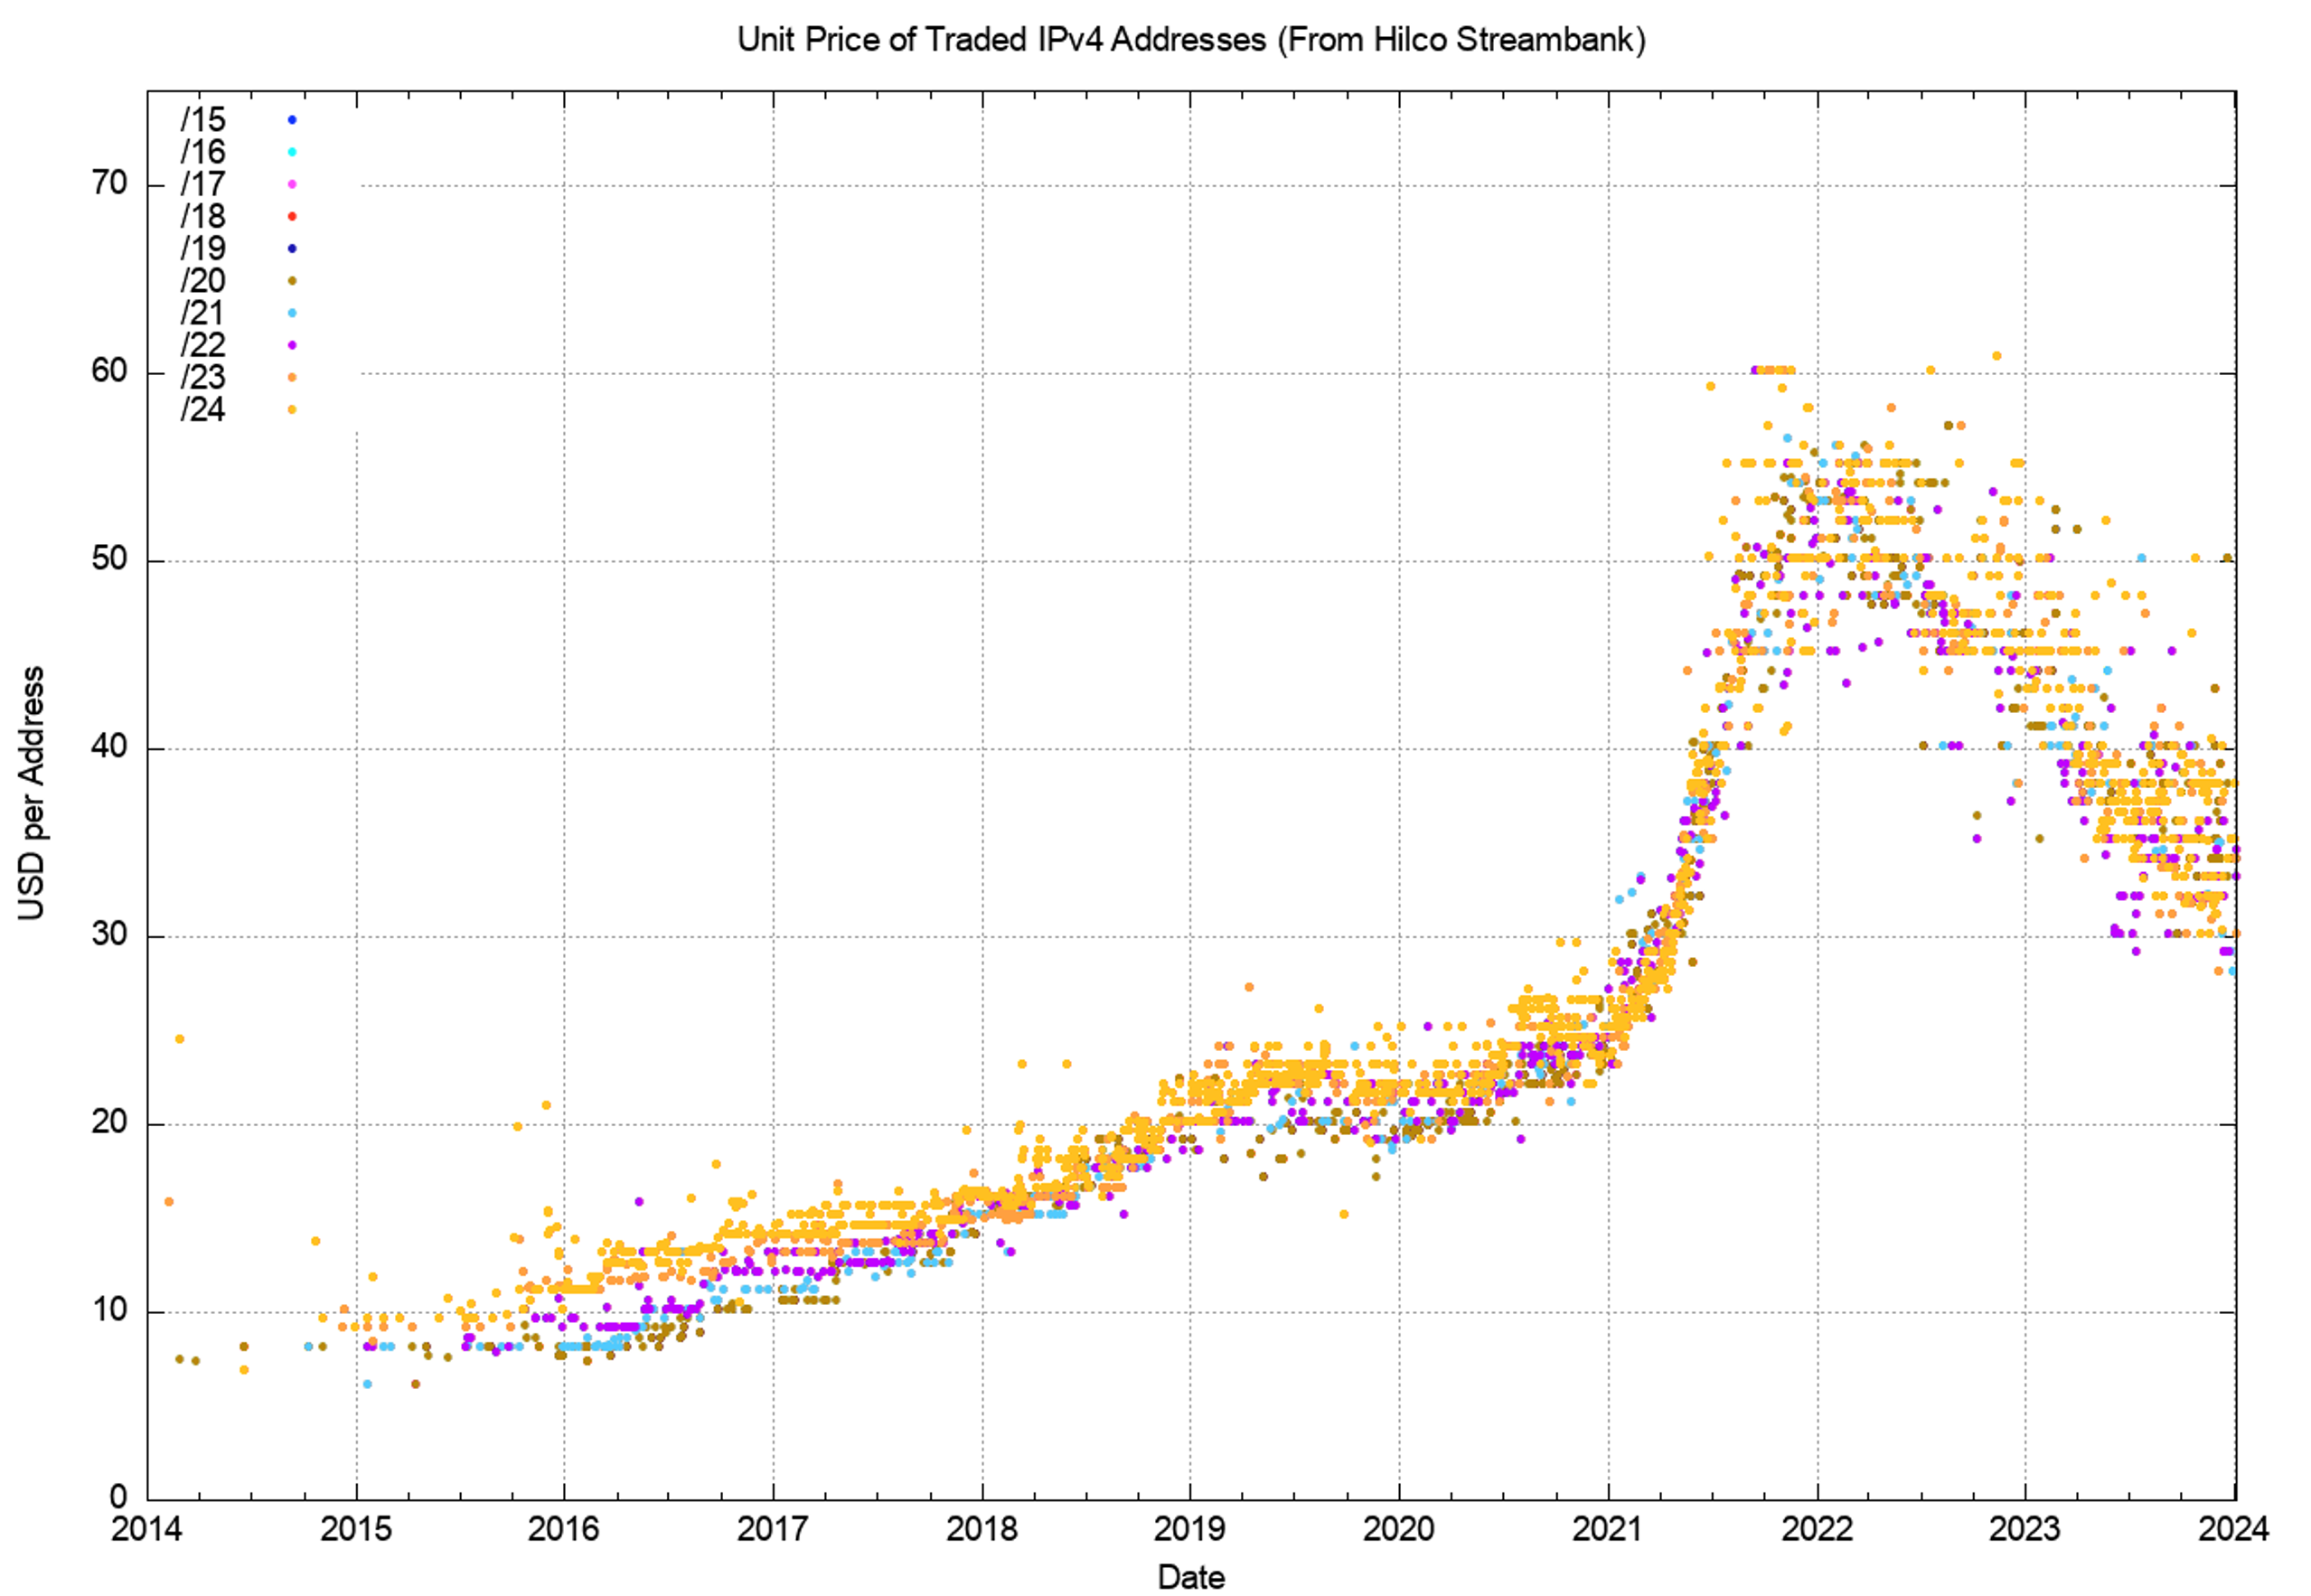
One of the address brokers, Hilco Streambank, publishes the historical price information of transactions (if only all the address brokers did the same, as a market with open price information for transactions can operate more efficiently and fairly than markets where price information is occluded). Figure 8 uses the Hilco Streambank transaction data to produce a time series of address prices.
There are several distinct behaviour modes in this data. The initial data before 2016 reflected a relatively low volume of transactions with stable pricing just below USD 10 per address. Over the ensuing four years, up to the start of 2019, the price doubled, with small blocks (/24s and /23s) attracting a price premium. The price stabilized for the next 18 months at between USD 20 to USD 25 per address, with large and small blocks trading at a similar unit price.
The 18 months up to the start of 2022 saw a new dynamic that was reflective of an exponential rise in prices, and the price lifted to between USD 45 and USD 60 per address by the end of 2021. The year 2022 saw the average market price drop across the year, but the variance in prices increased and trades at the end of the year were recorded at prices of between USD 40 to USD 60 per address. This price decline continued across 2023, and by the end of 2023, IPv4 addresses were traded at unit prices between USD 30 to USD 40. For an undistinguished commodity market where one address value is indistinguishable from any other this 30% price variation is unanticipated and somewhat unusual.
If prices are reflective of supply and demand it appears that demand has increased at a far greater level than supply, and the price escalation across 2021 reflects some form of scarcity premium being applied to addresses in recent times (Figure 8).
Is the supply of tradable IPv4 addresses declining? One way to provide some insight into answering this question is to look at the registration age of transferred addresses. Are such addresses predominately recently allocated addresses, or are they longer held addresses where the holder wants to realize the inherent value in otherwise unused assets? The basic question concerns the age distribution of transferred addresses where the age of an address reflects the period since it was first allocated or assigned by the RIR system.
The cumulative age distribution of transferred addresses by transaction is shown on a year-by-year basis in Figures 9 and 10. Some 15% of all transferred addresses in 2023 were drawn from legacy address holders, as shown in Figure 9. It appears that the effort to recycle the legacy address pool has all but run its course and the volume of transferred legacy addresses has declined sharply.
In the period 2019 to 2021, a visible subset of address holders appeared to hold recently allocated addresses for the policy-mandated minimum holding period of two years, and then transfer these addresses on the market. In previous years, 8% of addresses that were transferred were originally allocated up to five years before the transfer. In 2022, this number has fallen to 4%, which is presumably related to the smaller volumes of address allocations in 2022 rather than any change in the behaviours of address holders. In 2023, this behaviour has all but disappeared, due to the very small volume of address allocations by the RIRs rather than any change in the behaviour of address holders.
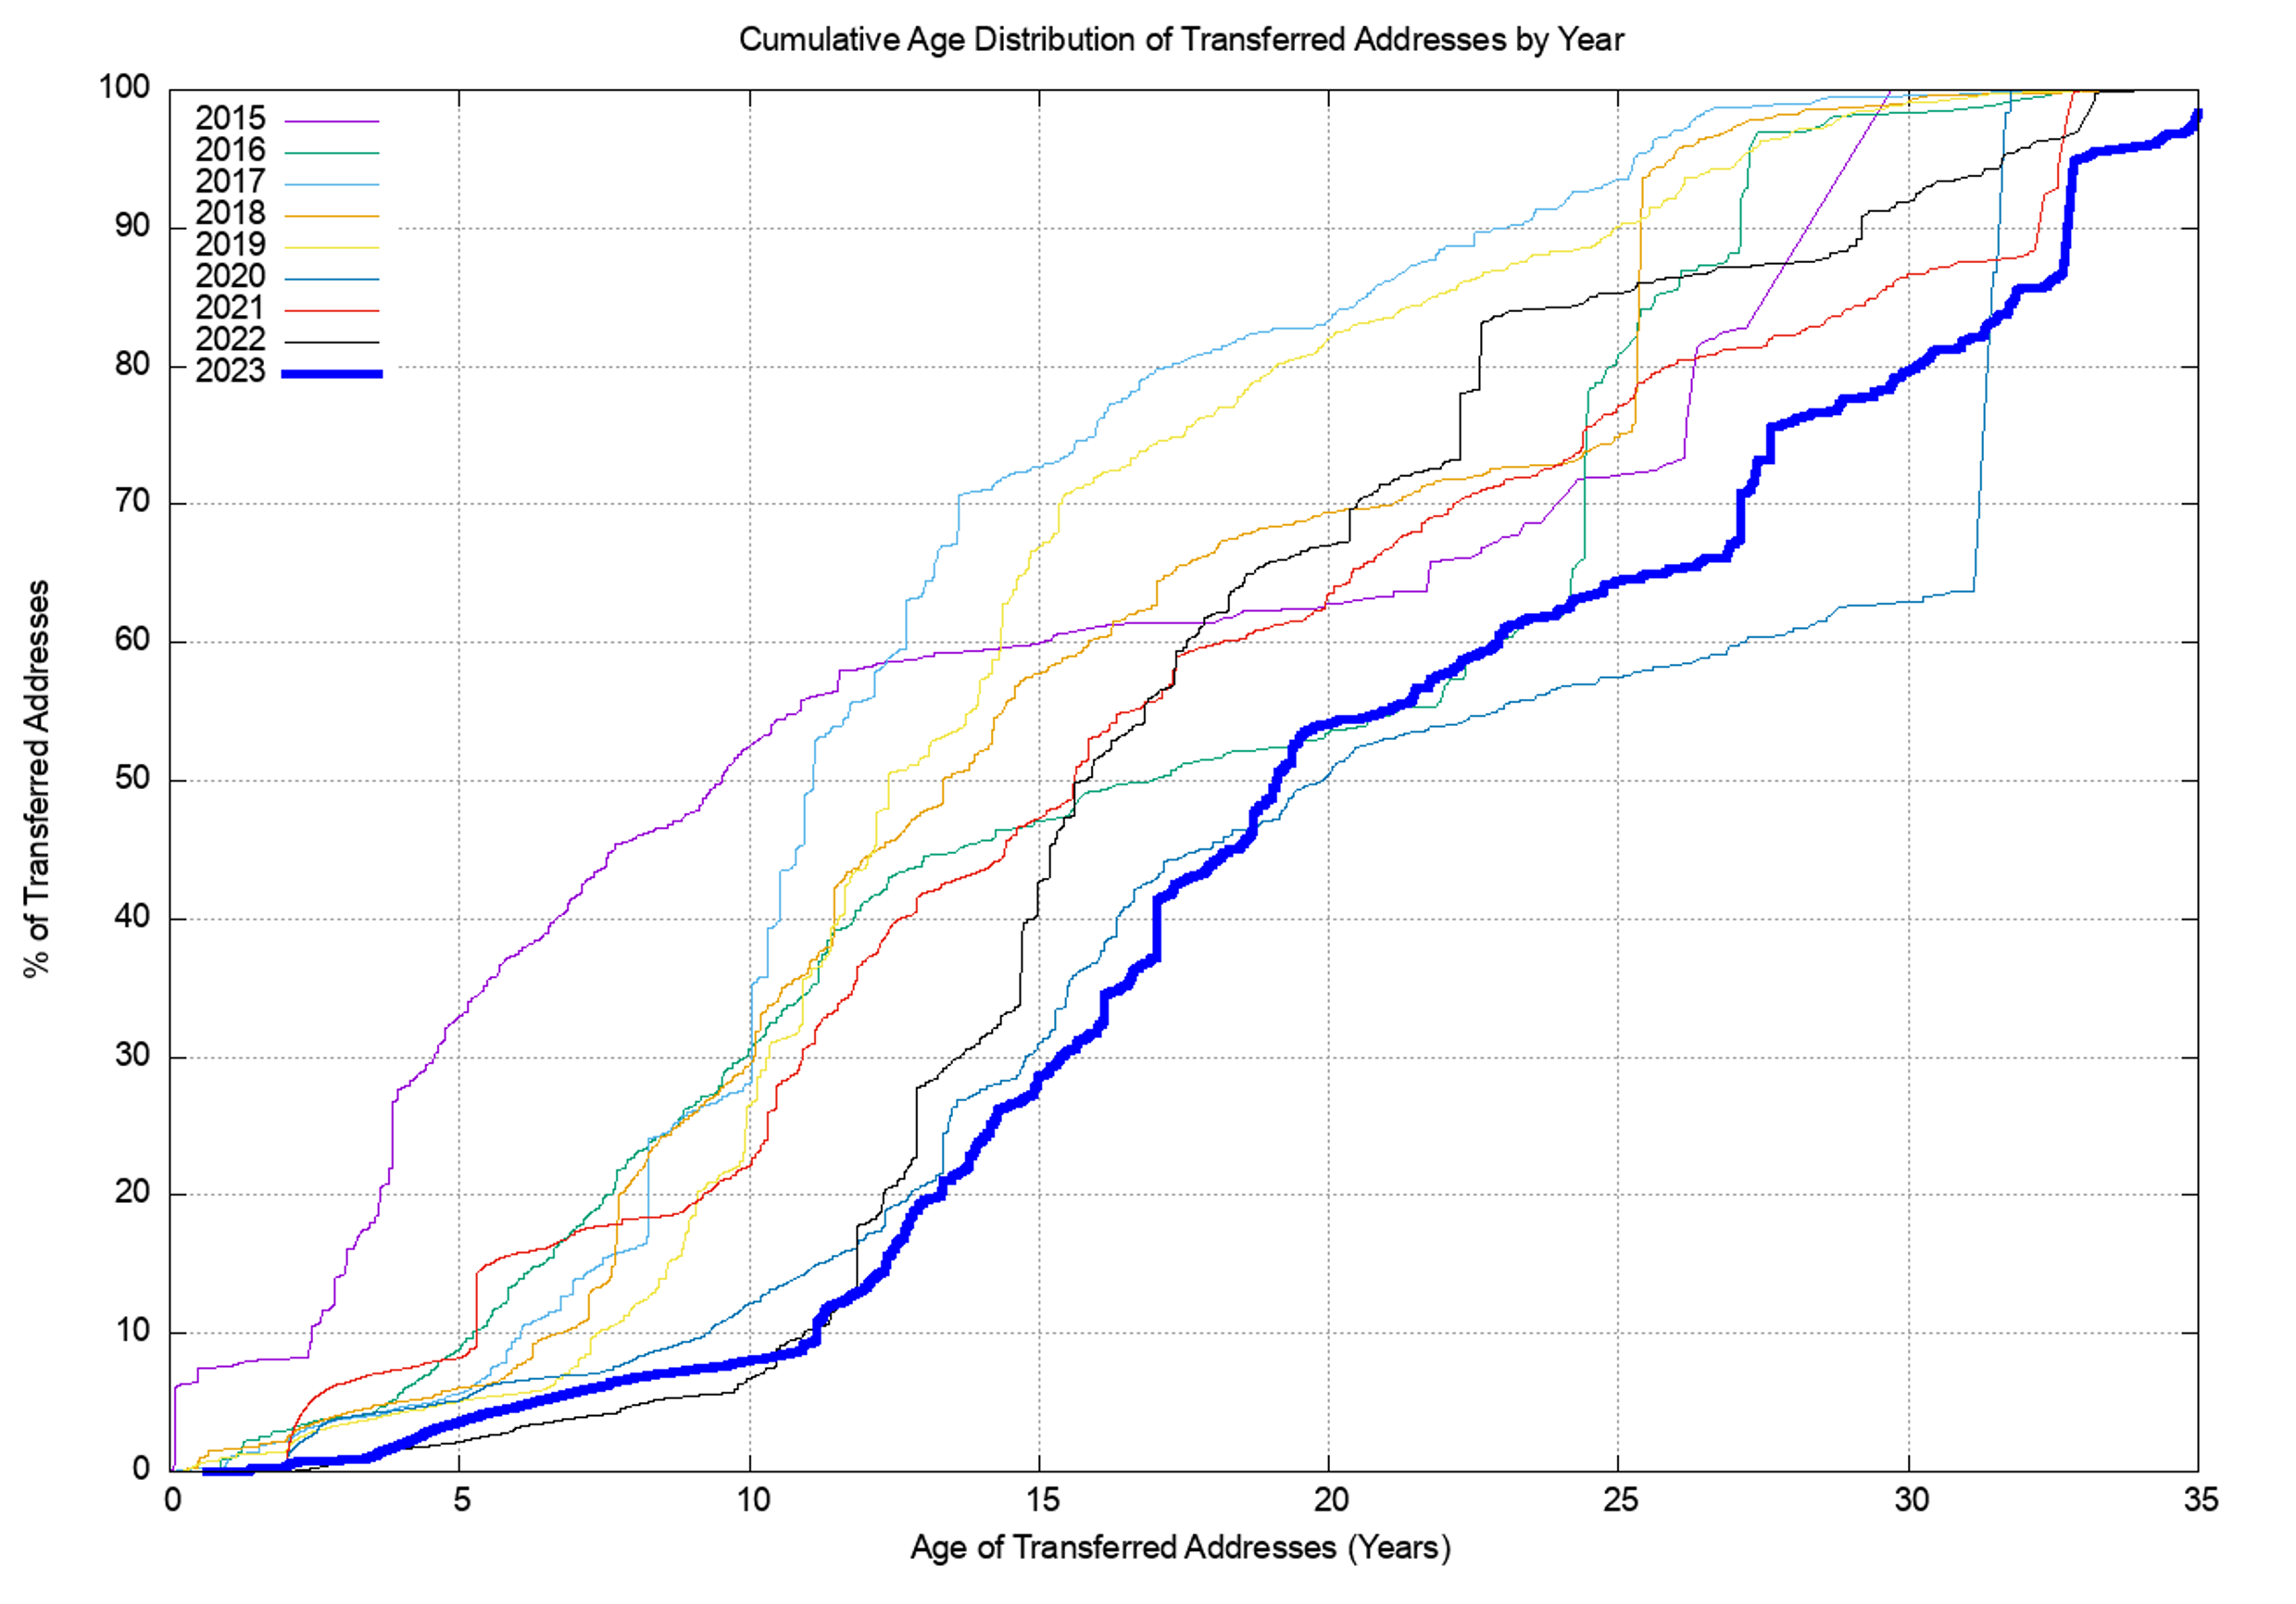
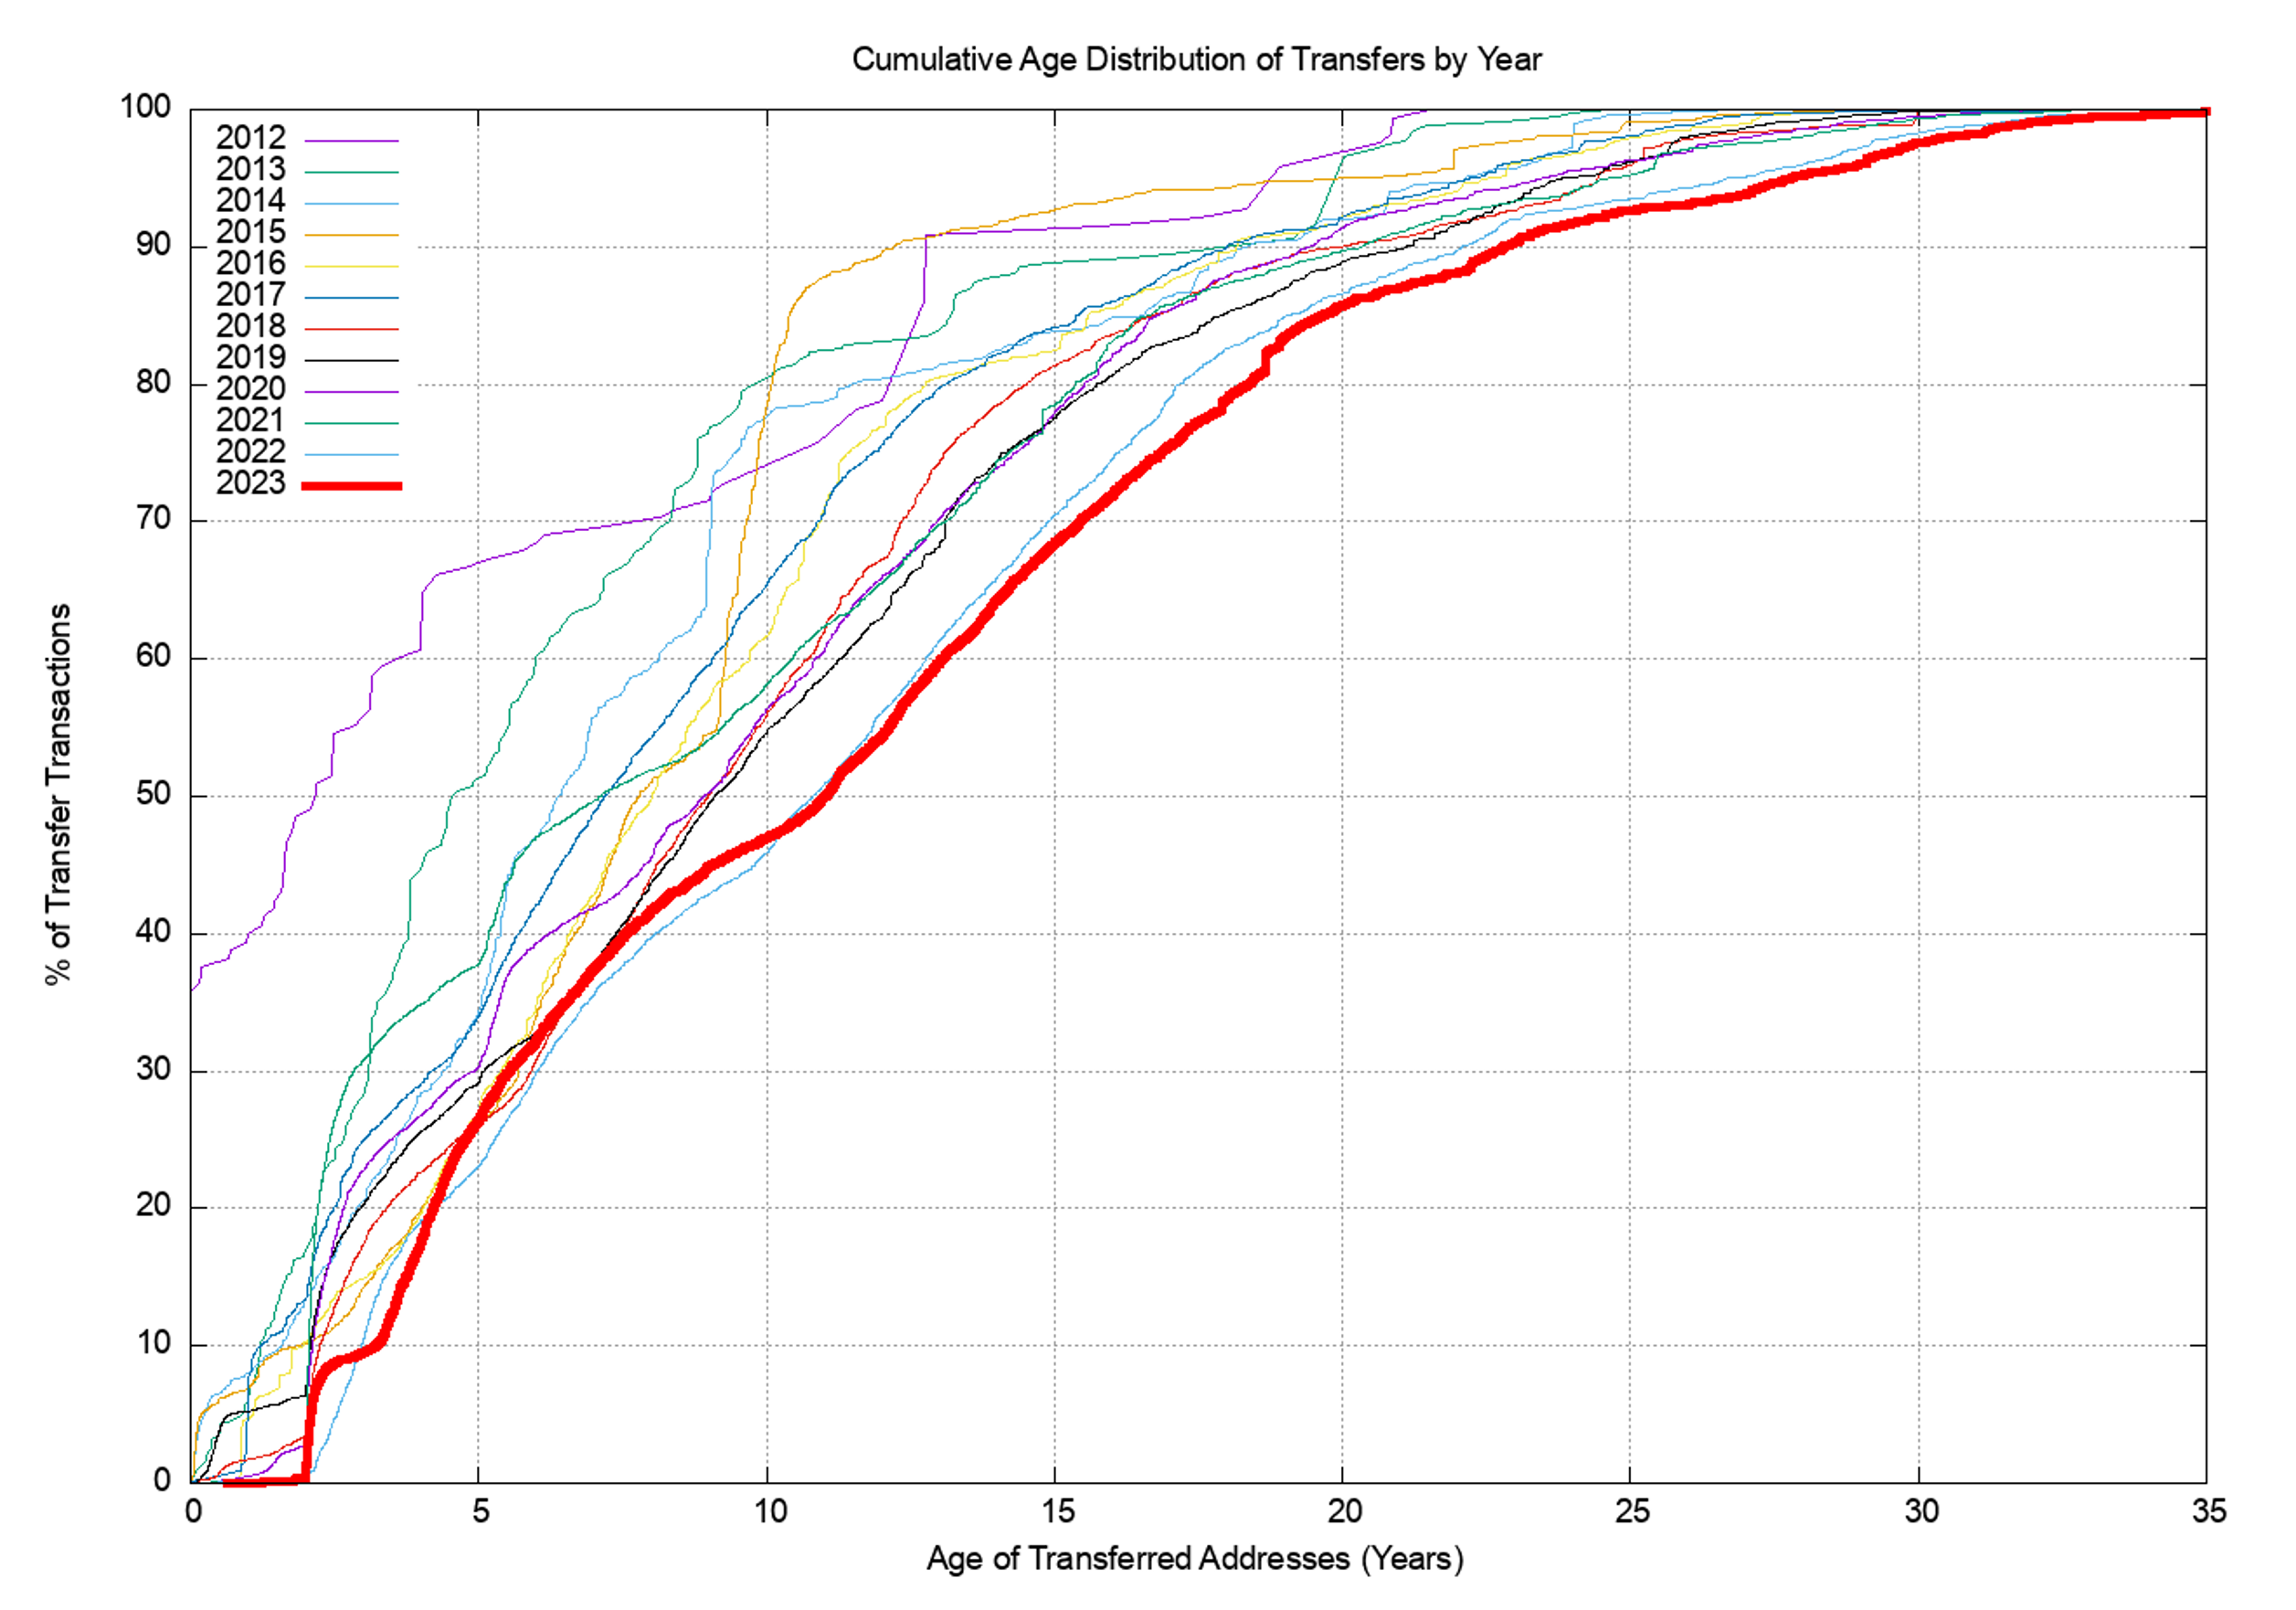
Figure 10 shows the cumulative age distribution of transfer transactions, and the disparity between the two distributions for 2022 shows that recent individual allocations have been far smaller in size but are still being traded. Twenty percent of the recorded transfer transactions in 2022 refer to an address prefix that was allocated within the past five years, yet these transactions encompass less than 2% of the inventory of transferred addresses in 2022. Some 30% of the volume of transferred addresses were originally allocated 20 or more years ago, while these transactions are recorded in just 12% of the transfers recorded in 2022.
Several motivations are driving the transfer process. One is when demand outstrips supply and price escalation is inevitable. This may motivate some network operators to purchase addresses early, in the expectation that further delay will cause higher prices. This factor also may motivate some address holders to defer the decision to sell their addresses as delay will improve the price. Taken together, these motivations can impair market liquidity and create a feedback loop that causes price escalation. This appears to be the case in 2021.
The second factor is IPv6 deployment. Many applications prefer to use IPv6 over IPv4 if they can (the so-called ‘Happy Eyeballs’ protocol for protocol selection). For a dual-stack access network, having more services provisioned with dual-stack decreases the traffic volume using IPv4. This reduces consumption pressure on their IPv4 CG-NATs and lessens the ongoing demand for IPv4 address space. This reduced demand for additional IPv4 addresses has an impact on the market price. A falling market price acts as a motivation for sellers to bring their unused address inventory to market sooner, as further delay will only result in a lower price.
The overriding feature of this address market is the level of uncertainty within the market over the state of the IPv6 transition, coupled with the uncertainty over the further growth of the network. This high degree of uncertainty may lie behind the very high variance of individual transfer transaction prices, as shown in Figure 8.
However, this uncertainty was somewhat resolved across 2023, and levels of demand appear to have dissipated in the past 12 months. Have we finally managed to deploy enough network infrastructure in both IPv4 and IPv6 to get ahead of the demand pressures? Are we, perhaps for the first time, looking at a market that is currently saturated with sufficient addresses and associated service platform infrastructure.
Do transfers fragment the address space?
The next question is whether the transfer process is further fragmenting the address space by splitting up larger address blocks into successively smaller address blocks. There are 44,757 transactions described in the RIR transfer registries from the start of 2012 until the start of 2024. Of these, 11,184 entries list transferred address blocks that are smaller than the original allocated block. In other words, some 25% of transfers implicitly perform fragmentation of the original allocation.
These 11,184 transfer entries that have fragmented the original allocation are drawn from 7,014 original allocations. On average, the original allocation is split into two smaller address blocks. This data implies that the answer to this question is that address blocks are being fragmented because of address transfers, but in absolute terms, this is not a major issue. There are 240,220 distinct IPv4 address allocation records in the RIR registries as of the end of 2023, and the fragmentation reflected in 11,184 more specific entries of original allocation address blocks represents around 4.7% of the total pool of allocated address prefixes.
Imports and exports of addresses
The next question concerns the international flow of transferred addresses. Let’s look at the ten economies that sourced the greatest volume of transferred addresses, irrespective of their destination ( including ‘domestic’ transfers within the same economy) (Table 6), the ten largest recipients of transfers (Table 7), and the ten largest international address transfers (Table 8). We will use the RIR-published transfer data for 2023 as the basis for these tables.
| Rank | CC | Addresses | Economy |
| 1 | US | 7,942,912 | USA |
| 2 | GB | 2,858,240 | UK |
| 3 | NL | 1,927,680 | Netherlands |
| 4 | JP | 1,495,296 | Japan |
| 5 | GR | 1,032,192 | Greece |
| 6 | RU | 904,704 | Russia |
| 7 | DE | 821,504 | Germany |
| 8 | IT | 727,808 | Italy |
| 9 | SE | 626,432 | Sweden |
| 10 | BE | 528,384 | Belgium |
Table 6 — Top 10 economies sourcing transferred IPv4 addresses in 2023.
| Rank | CC | Addresses | Economy |
| 1 | GB | 8,518,400 | UK |
| 2 | US | 3,424,000 | USA |
| 3 | NL | 1,830,400 | Netherlands |
| 4 | GR | 1,044,224 | Greece |
| 5 | JP | 938,496 | Japan |
| 6 | DE | 880,640 | Germany |
| 7 | RU | 697,088 | Russia |
| 8 | SE | 685,056 | Sweden |
| 9 | SG | 558,336 | Singapore |
| 10 | BE | 540,928 | Belgium |
Table 7 — Top 10 economies receiving transferred IPv4 addresses in 2021.
Some RIRs use the principle that the recorded CC entry corresponds to the physical location of the headquarters of the nominated entity that is the holder of the addresses, irrespective of the locale where the addresses are used on the Internet. Other RIRs allow the holder to update this geolocation entry to match the holder’s intended locale where the addresses will be used. It is generally not possible to confirm the holder’s assertion of location, so whether these self-managed records reflect the actual location of the addresses or reflect a location of convenience is not always possible to determine.
When we examine the various geolocation services, of which Maxmind is a commonly used service, there are similar challenges of location. These services generally intend to associate an address with a location that relates to where the address is physically located. At times this is not easy to establish, such as with tunnels used in VPNs. Is the ‘correct’ location the location of the tunnel ingress or tunnel egress? Many of the fine-grained differences in geolocation services reflect the challenges in dealing with VPNs and the various ways these location services have responded. There is also the issue of cloud-based services.
Where the cloud service uses anycast the address is located in many locations at once. In the case where the cloud uses conventional unicast, the addresses used may be fluid across the cloud service’s points of presence based on distributing addresses to meet the demands of the service. The bottom line is that these location listings are a ‘fuzzy’ approximation rather than a precise indication of location.
With that in mind, let’s now look at the imports and exports of the 2023 address transfers, where the source and destination of the transfers are in different economies.
| Rank | From | To | Addresses (M) | Source | Destination |
| 1 | US | GB | 5,389,568 | USA | UK |
| 2 | IT | US | 344,064 | Italy | USA |
| 3 | JP | GB | 329,728 | Japan | UK |
| 4 | GB | US | 238,336 | UK | USA |
| 5 | DE | GB | 141,568 | Germany | UK |
| 6 | CA | GB | 136,192 | Canada | UK |
| 7 | GB | SE | 131,328 | UK | Sweden |
| 8 | FR | SE | 131,072 | France | Sweden |
| 9 | IR | DE | 131,072 | Iran | Germany |
| 10 | SE | US | 131,072 | Sweden | USA |
| 11 | AU | US | 110,848 | Australia | USA |
| 12 | JP | PH | 106,496 | Japan | Philippines |
| 13 | US | DE | 105,728 | USA | Germany |
| 14 | DE | FR | 99,584 | Germany | France |
| 15 | JP | SG | 98,304 | Japan | Singapore |
| 16 | NL | US | 98,048 | Netherlands | USA |
| 17 | GB | ES | 77,824 | UK | Spain |
| 18 | CA | US | 74,752 | Canada | USA |
| 19 | GB | DE | 74,496 | UK | Germany |
| 20 | UA | US | 70,400 | Ukraine | USA |
Table 8 — Top 20 economy-to-economy IPv4 address transfers in 2023.
The 2023 transfer logs contain 3,674 domestic address transfers, with a total of 14,314,400 addresses, with the largest activity by address volume in domestic transfers in the United Kingdom, USA, the Netherlands, Greece, and Japan. 2,190 transfers appear to result in a movement of addresses between economies, involving a total of 11,001,600 addresses.
An outstanding question about this transfer data is whether all address transfers that have occurred have been duly recorded in the registry system. This question is raised because registered transfers require conformance to various registry policies, and it may be the case that only a subset of transfers are being recorded in the registry as a result. This can be somewhat challenging to detect, particularly if such a transfer is expressed as a lease or other form of temporary arrangement, and if the parties agree to keep the details of the transfer confidential.
It might be possible to place an upper bound on the volume of address movements that have occurred in any period by looking at the Internet’s routing system. One way to shed some further light on what this upper bound on transfers might be is through a simple examination of the routing system, looking at addresses that were announced in 2023 by comparing the routing stable state at the start of the year with the stable state at the end of the year (Table 9).
| Jan-23 | Jan-24 | Delta | Unchanged | Rehome | Removed | Added | |
| Announcements | 941,707 | 944,714 | 3,007 | 810,902 | 25,154 | 105,561 | 108,658 |
| Address span (/8s) | 249.25 | 246.94 | -2.32 | 232.95 | 4.31 | 11.99 | 9.68 |
| Root prefixes | 444,678 | 456,574 | 11,896 | 396,935 | 17,375 | 32,054 | 42,237 |
| Address span (/8s) | 182.81 | 181.51 | -1.30 | 174.00 | 3.35 | 5.99 | 4.16 |
| More specifics | 497,029 | 488,167 | -8,862 | 413,967 | 7,779 | 73,597 | 66,421 |
| Address span (/8s) | 50.69 | 50.48 | -0.21 | 58.95 | 0.96 | 6.01 | 5.52 |
Table 9 — IPv4 BGP changes over 2022.
While the routing table grew by 3,007 entries over the year, the nature of the change is slightly more involved. 105,561 prefixes that were announced at the start of the year were removed from the routing system at some time throughout the year, and 108,658 prefixes were announced by the end of the year that were not announced at the start of the year. More transient prefixes may have appeared and been withdrawn throughout the year of course (see next paragraph), but here we are comparing two snapshots rather than looking at every update message. A further 25,154 prefixes had changed their originating Autonomous System Number (ASN), indicating some form of change in the prefix’s network location in some manner.
If we look at the complete collection of BGP updates seen from an individual BGP vantage point (AS131072) across all of 2023 we see a larger collection of transient address prefixes. A total of 1,161,367 distinct prefixes were observed through 2023. That implies that some 219,660 additional prefixes were seen at some point through the year, from the initial set at the start of the year.
We can compare these prefixes that changed in 2023 against the transfer logs for the two years 2022 and 2023. Table 10 shows the comparison of these routing numbers against the set of transfers that were logged in these two years.
| Type | Listed | Unlisted | Ratio |
| Rehomed | |||
| All | 2,562 | 22,592 | 10.2% |
| Root prefixes | 2,291 | 14,690 | 13.5% |
| Removed | |||
| All | 4,556 | 101,095 | 4.3% |
| Root prefixes | 2,791 | 29,263 | 8.7% |
| Added | |||
| All | 5,390 | 103,268 | 5.0% |
| Root prefixes | 3,840 | 38,397 | 9.1% |
Table 10 — Routing changes across 2023 compared to the transfer log entries for 2022 – 2023.
These figures show that 4% to 13% of changes in advertised addresses from the beginning to the end of the year are reflected as changes as recorded in the RIR transfer logs. This shouldn’t imply that the remaining changes in advertised prefixes reflect unrecorded address transfers. There are many reasons for changes in the advertisement of an address prefix and a change in the administrative controller of the address is only one potential cause. However, it does establish some notional upper ceiling on the number of movements of addresses in 2022, some of which relate to the transfer of operational control of an address block, that has not been captured in the transfer logs.
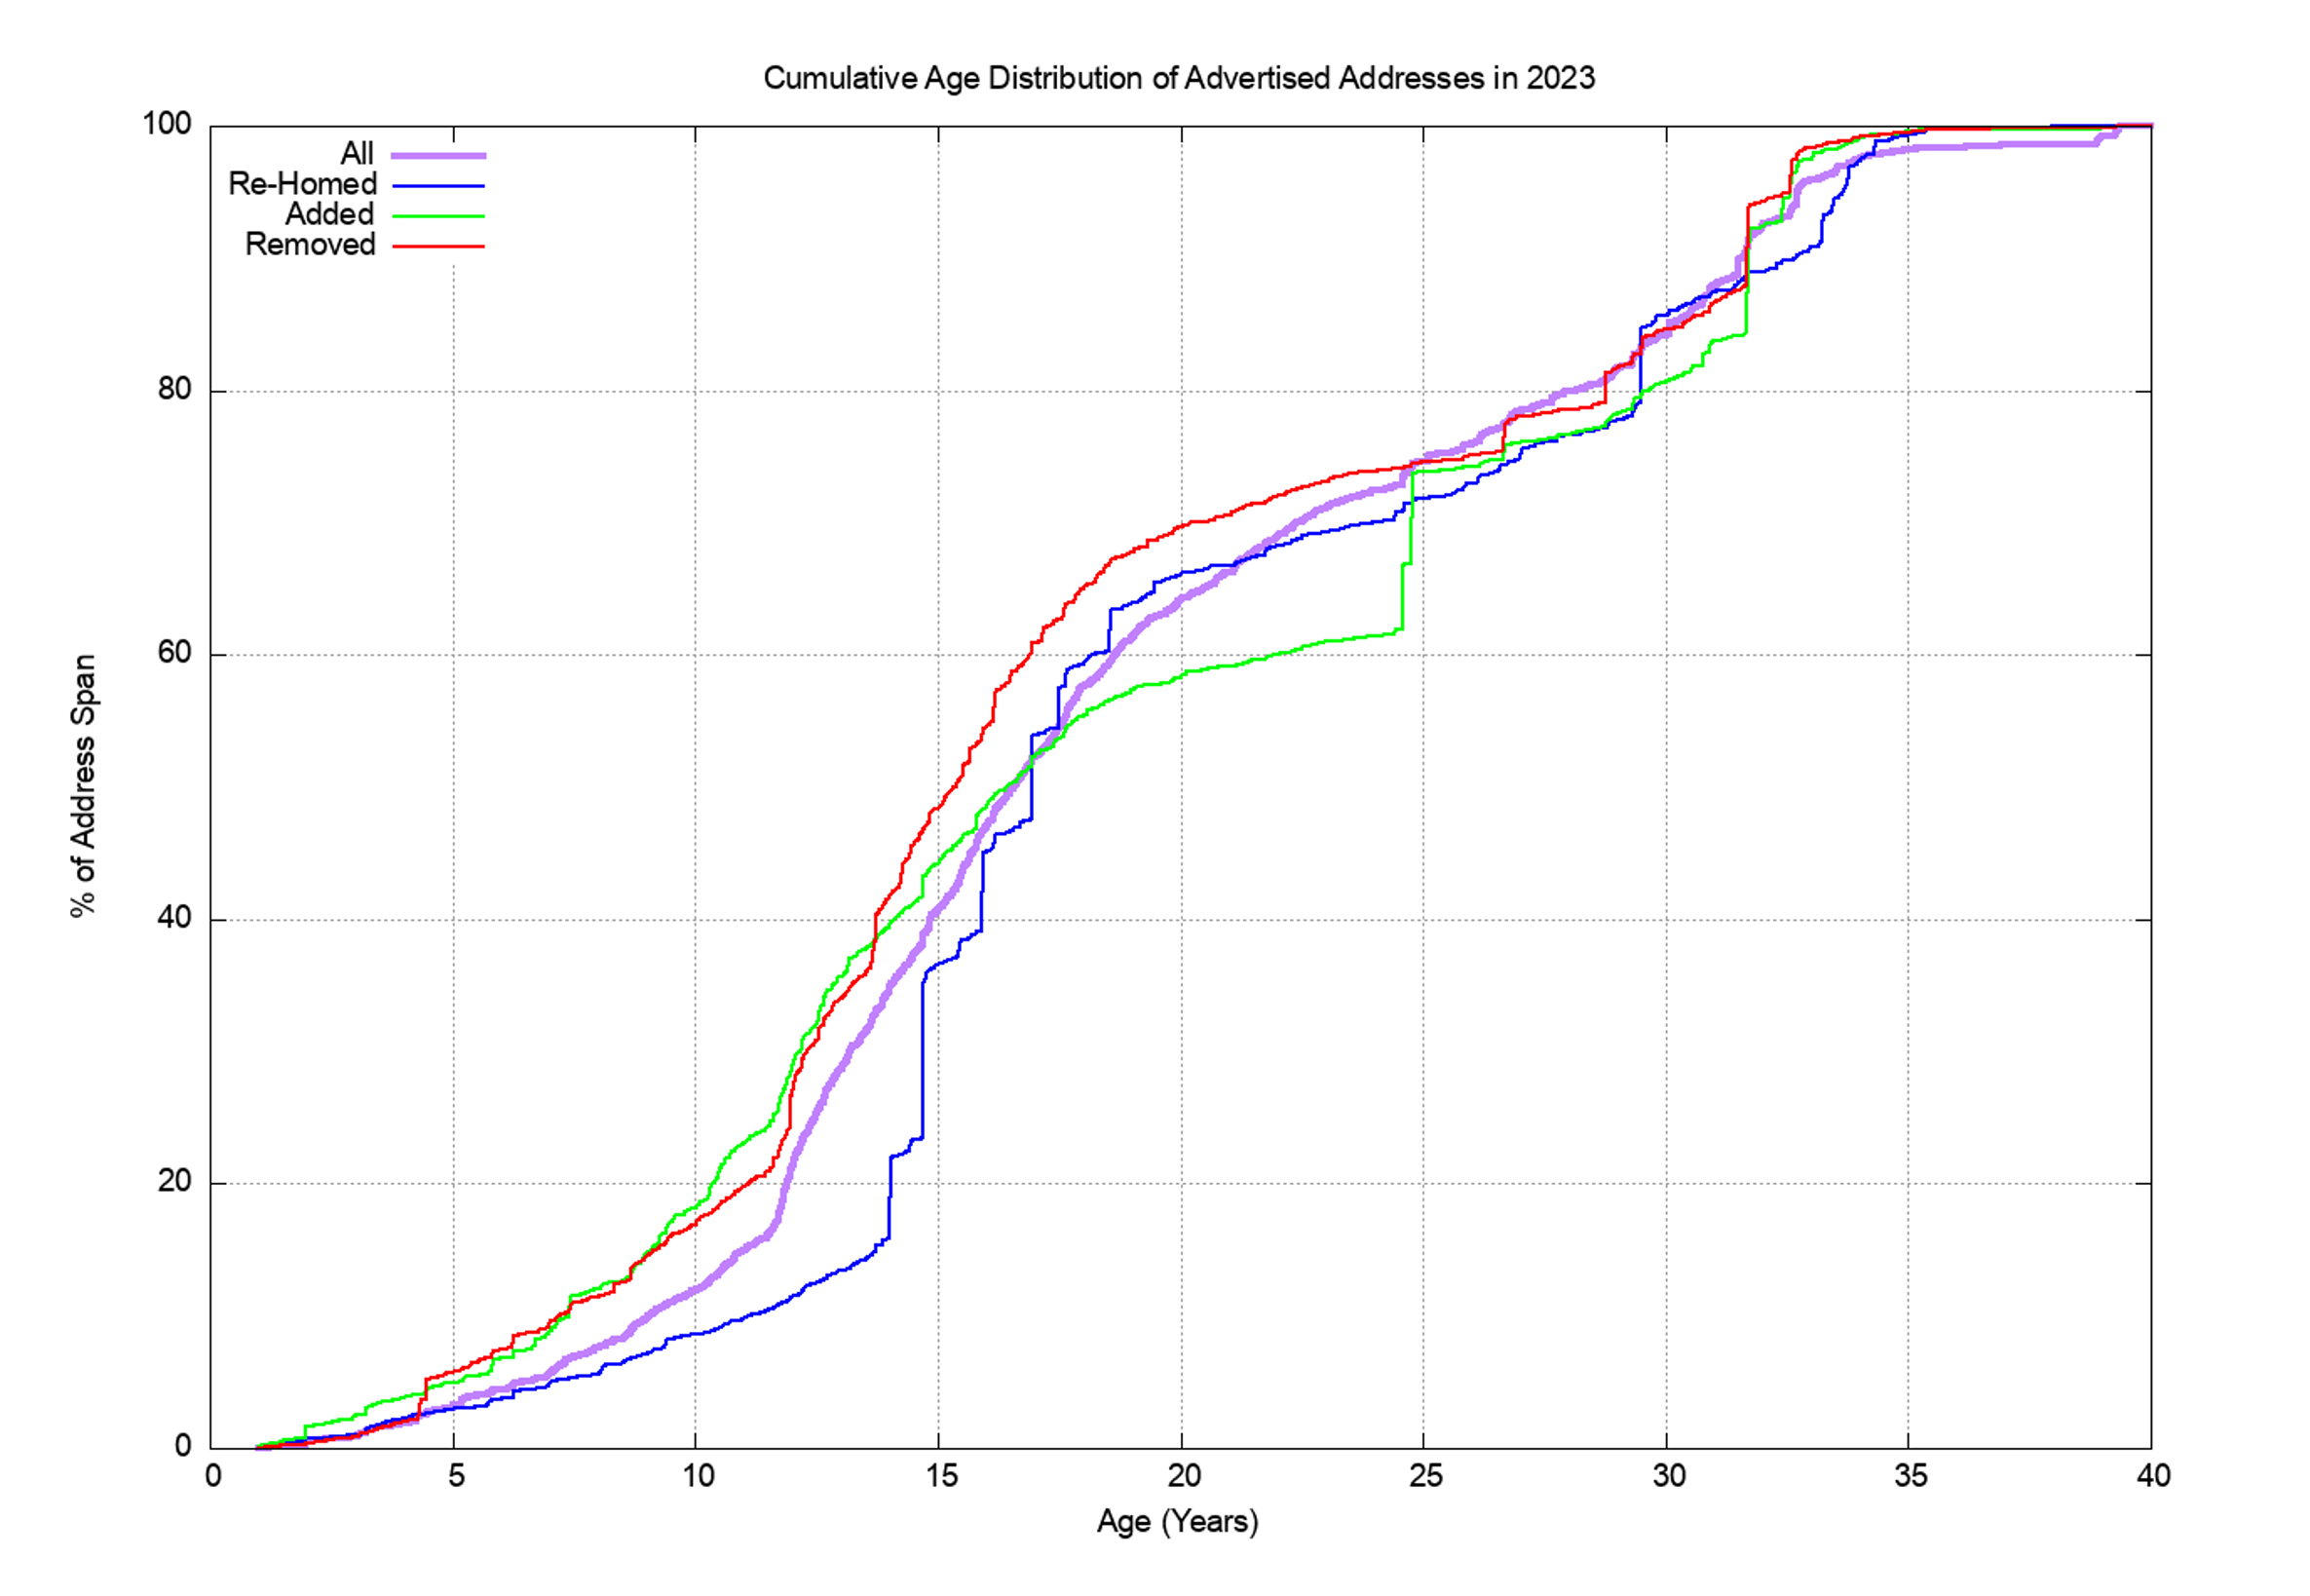
Finally, we can perform an age profile of the addresses that were added, removed, and rehomed during 2023 and compare it to the overall age profile of IPv4 addresses in the routing table. This is shown in Figure 11. In terms of addresses that were added in 2023, they differ from the average profile due to a skew in favour of ‘older’ addresses, and 40% of all announced addresses were allocated or assigned more than 25 years ago.
However, as IPv4 moves into its final stages we are perhaps now able to take stock of the overall distribution of IPv4 addresses and look at where the addresses landed up. Table 11 shows the ten economies that have the largest pools of allocated IPv4 addresses. However, I must note that the assignation of a CC in an address registration reflects the economy where the address holder is located (the corporate location), and not necessarily the economy where the addresses will be deployed.
| Rank | CC | IPv4 pool | % Total | Per capita | Economy |
| 1 | US | 1,613,416,288 | 43.80% | 4.73 | USA |
| 2 | CN | 343,128,576 | 9.30% | 0.24 | China |
| 3 | JP | 190,171,392 | 5.20% | 1.55 | Japan |
| 4 | GB | 125,666,696 | 3.40% | 1.85 | UK |
| 5 | DE | 124,023,296 | 3.40% | 1.49 | Germany |
| 6 | KR | 112,502,528 | 3.10% | 2.17 | South Korea |
| 7 | BR | 87,131,648 | 2.40% | 0.4 | Brazil |
| 8 | FR | 82,154,096 | 2.20% | 1.27 | France |
| 9 | CA | 68,649,984 | 1.90% | 1.76 | Canada |
| 10 | IT | 53,993,792 | 1.50% | 0.92 | Italy |
| Total | XA | 3,686,113,784 | 100.00% | 0.46 | World |
Table 11 — IPv4 allocated address pools per national economy.
If we divide this address pool by the current population of each national entity, then we can derive an address per capita index. The global total of 3.69 billion allocated addresses with an estimated global population of 8 billion people gives an overall value of 0.46 IPv4 addresses per capita.
| Rank | CC | IPv4 pool | % Total | Per capita | Economy |
| 1 | SC | 7,284,480 | 0.20% | 67.46 | Seychelles |
| 2 | VA | 10,752 | 0.00% | 20.6 | Holy See |
| 3 | GI | 239,104 | 0.00% | 7.31 | Gibraltar |
| 4 | US | 1,613,416,288 | 43.80% | 4.73 | USA |
| 5 | SG | 26,087,936 | 0.70% | 4.32 | Singapore |
| 6 | MU | 4,779,008 | 0.10% | 3.67 | Mauritius |
| 7 | CH | 25,955,896 | 0.70% | 2.94 | Switzerland |
| 8 | VG | 92,160 | 0.00% | 2.91 | British Virgin Islands |
| 9 | NO | 15,537,680 | 0.40% | 2.83 | Norway |
| 10 | NL | 49,889,568 | 1.40% | 2.83 | Netherlands |
| Total | XA | 3,686,113,784 | 100.00% | 0.46 | World |
Table 12 — IPv4 allocated address pools ranked by per-capita holdings.
View the full table of IPv4 allocations per national economy.
IPv4 address leasing
It is worth noting that the address market includes leasing as well as sales. Should an entity that requires IPv4 addresses enter the market and perform an outright purchase of the addresses from an existing address holder, or should they execute a timed lease to have the use of these addresses for a specified period and presumably return these addresses at the end of the lease? This lease versus buy question is a very conventional question in market economics and there are various well-rehearsed answers to the question. They tend to relate to the factoring of market information and scenario planning.
If a buyer believes that the situation that led to the formation of a market will endure for a long time, and the goods being traded on the market are in finite supply while the level of demand for these goods is increasing, then the market will add an escalating scarcity premium to the price goods being traded. The balancing of demand and supply becomes a function of this scarcity premium imposed on the goods being traded. Goods in short supply tend to become more expensive to buy over time. A holder of these goods will see an increase in the value of the goods that they hold. A lessee will not.
If a buyer believes that the market only has a short lifespan, and that demand for the good will rapidly dissipate at the end of this lifespan, then leasing the good makes sense, in so far as the lessee is not left with a valueless asset when the market collapses.
Scarcity also has several additional consequences, one of which is the pricing of substitute goods. At some point, the price of the original good rises to the point that substitution looks economically attractive, even if the substitute good has a higher cost of production or use. In fact, this substitution price effectively sets a price ceiling for the original scarce good.
Some commentators have advanced the view that an escalating price for IPv4 increases the economic incentive for IPv6 adoption, and this may indeed be the case. However, other potential substitutes have been used, most notably NATs. While NATs do not eliminate the demand pressure for IPv4, they can go a long way to increase the address utilization efficiency of IPv4 addresses. NATs allow the same address to be used by multiple customers at different times. The larger the pool of customers that share a common pool of NAT addresses the greater the achievable multiplexing capability.
The estimate as to how long the market in IPv4 addresses will persist is effectively a judgement as to how long IPv4 and NATs can last and how long it will take IPv6 to be sufficiently deployed to be viable as an IPv6-only service. Then, there is likely to be a tipping point where the pressure for all hosts and networks to support access to services over IPv4 collapses. At that point, the early IPv6-only adopters can dump all their remaining IPv4 resources onto the market as they have no further need for them, which would presumably trigger a level of market panic to emerge as existing holders are faced with the prospect of holding a worthless asset and are therefore under pressure to sell off their IPv4 assets while there are still buyers in the market.
While a significant population of IPv4-only hosts and networks can stall this transition and increase scarcity pressure, if the scarcity pressure becomes too great the impetus of IPv6-only adoption increases to the level that the IPv6-connected base achieves market dominance. When this condition is achieved the IPv4 address market will quickly collapse.
IPv6 in 2023
Obviously, the story of IPv4 address allocations is only half of the story, and to complete the picture it’s necessary to look at how IPv6 has fared over 2022.
IPv6 uses a somewhat different address allocation methodology than IPv4, and it is a matter of choice for a service provider as to how large an IPv6 address prefix is assigned to each customer. The original recommendations published by the Internet Architecture Board (IAB) and Internet Engineering Steering Group (IESG) in 2001, documented in RFC 3177, envisaged the general use of a /48 prefix as a generally suitable end-site prefix. Subsequent consideration of long-term address conservation saw a more flexible approach being taken with the choice of the end site prefix size being left to the service provider.
Today’s IPv6 environment has some providers using a /60 end site allocation unit, many using a /56, and many other providers using a /48. This variation makes a comparison of the count of allocated IPv6 addresses somewhat misleading, as an Internet Service Provider (ISP) using /48s for end sites will require 256 times more address space to accommodate a similarly sized customer base as a provider who uses a /56 end site prefix, and 4,096 times more address space than an ISP using a /60 end site allocation!
For IPv6 let’s use both the number of discrete IPv6 allocations and the total amount of space that was allocated to see how IPv6 fared in 2023.
Comparing 2022 to 2023, the number of individual allocations of IPv6 address space has declined by 5%, while the number of IPv4 allocation transactions has declined by 21% (Table 13).
| Allocations | 2011 | 2012 | 2013 | 2014 | 2015 | 2016 | 2017 | 2018 | 2019 | 2020 | 2021 | 2022 | 2023 |
| IPv6 | 3,582 | 3,291 | 3,529 | 4,502 | 4,644 | 5,567 | 5,740 | 6,176 | 6,799 | 5,376 | 5,350 | 4,066 | 3,874 |
| IPv4 | 8,234 | 7,435 | 6,429 | 10,435 | 11,352 | 9,648 | 8,185 | 8,769 | 12,560 | 5,874 | 6,939 | 4,395 | 3,462 |
Table 13 — Number of individual address allocations, 2011 – 2023.
The amount of IPv6 address space distributed in 2023 is 2% less than the amount that was allocated in 2021, while the corresponding IPv4 volume has declined by 32% (Table 14).
| Addresses | 2011 | 2012 | 2013 | 2014 | 2015 | 2016 | 2017 | 2018 | 2019 | 2020 | 2021 | 2022 | 2023 |
| IPv6 (/32s) | 14,986 | 17,710 | 23,642 | 17,847 | 15,765 | 25,260 | 19,975 | 38,699 | 35,924 | 21,620 | 28,131 | 27,497 | 74,159 |
| IPv4 (/32s)(M) | 191.7 | 88.8 | 57.7 | 58.8 | 32.3 | 20.8 | 15.1 | 14.1 | 13.9 | 4.2 | 3.1 | 2.1 | 1.6 |
Table 14 — Volume of address allocations, 2011 – 2023.
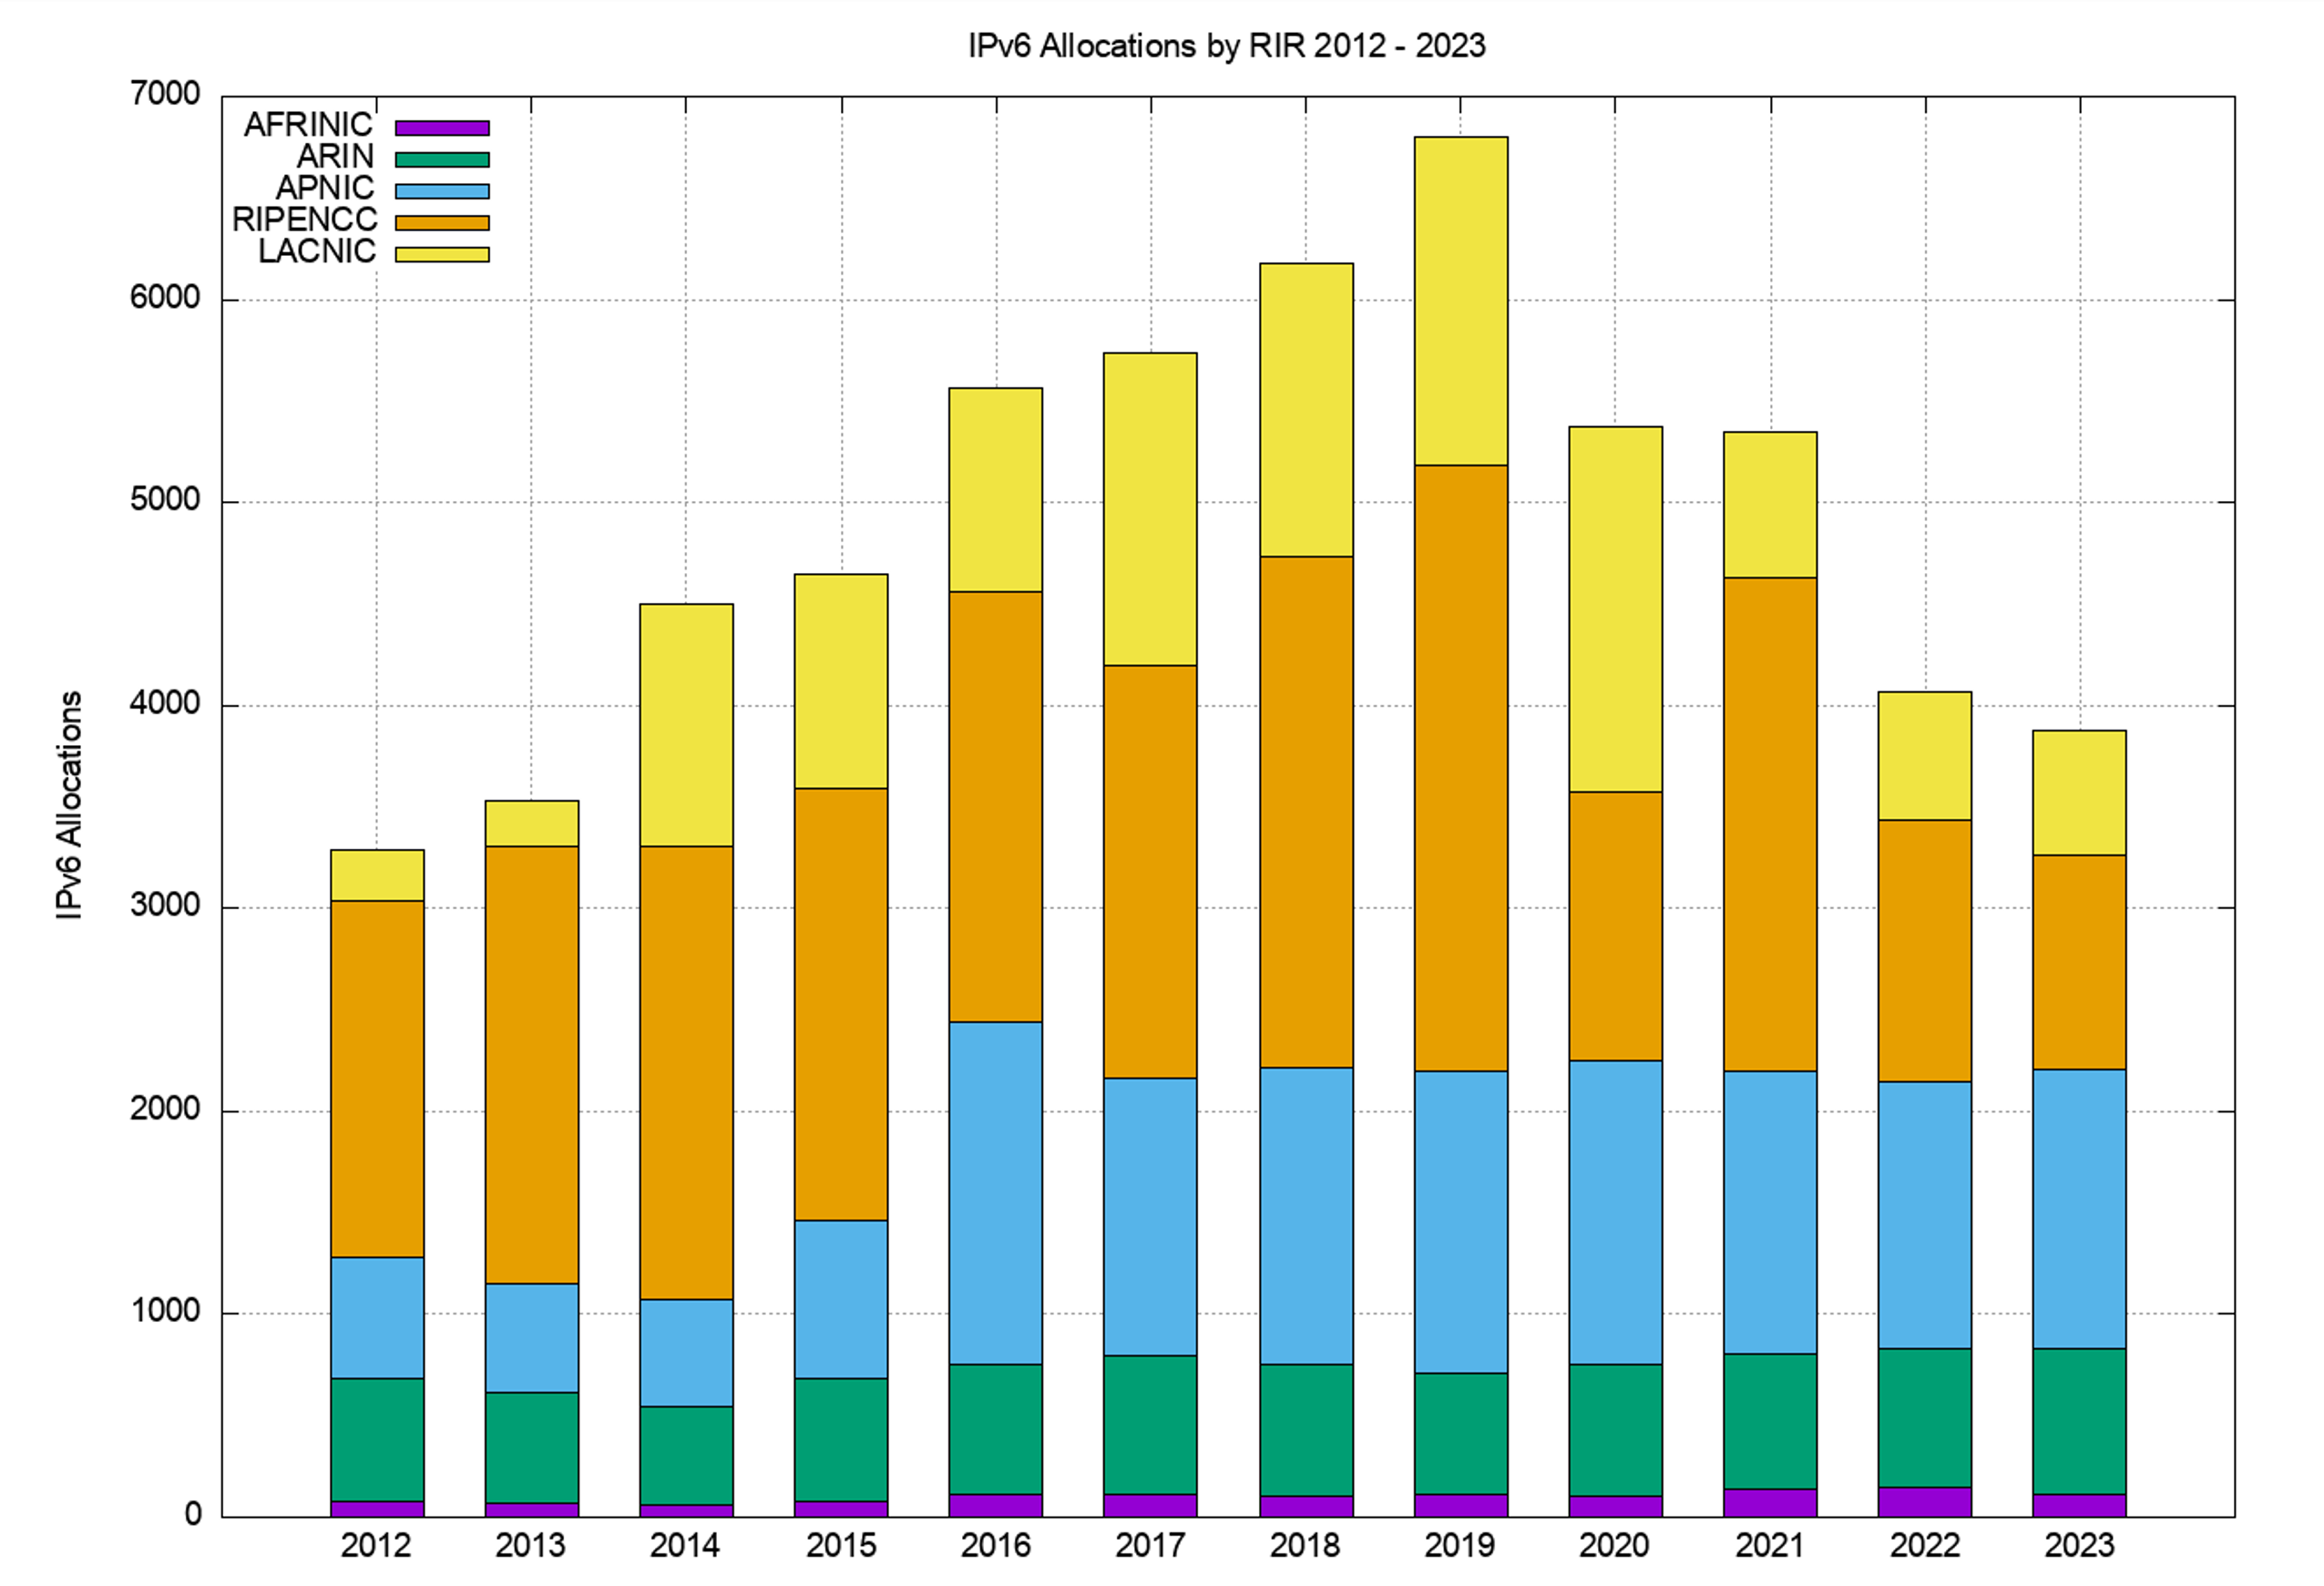
Regionally, each of the RIRs saw IPv6 allocation activity in 2023 that was on par with those seen in 2022, but well short of the peak period of IPv6 allocation activity in 2018 to 2019 (Table 15).
| Allocations | 2011 | 2012 | 2013 | 2014 | 2015 | 2016 | 2017 | 2018 | 2019 | 2020 | 2021 | 2022 | 2023 |
| AFRINIC | 129 | 82 | 72 | 59 | 81 | 111 | 110 | 108 | 111 | 108 | 135 | 151 | 115 |
| APNIC | 641 | 599 | 540 | 528 | 777 | 1,680 | 1,369 | 1,460 | 1,484 | 1,498 | 1,392 | 1,317 | 1,381 |
| ARIN | 1,035 | 603 | 543 | 489 | 604 | 645 | 684 | 648 | 601 | 644 | 668 | 680 | 712 |
| LACNIC | 130 | 251 | 223 | 1,199 | 1,053 | 1,007 | 1,547 | 1,439 | 1,614 | 1,801 | 725 | 635 | 612 |
| RIPENCC | 1,647 | 1,756 | 2,151 | 2,227 | 2,129 | 2,124 | 2,030 | 2,521 | 2,989 | 1,325 | 2,430 | 1,283 | 1,054 |
| Total | 3,582 | 3,291 | 3,529 | 4,502 | 4,644 | 5,567 | 5,740 | 6,176 | 6,799 | 5,376 | 5,350 | 4,066 | 3,874 |
Table 15 — IPv6 allocations by RIR.
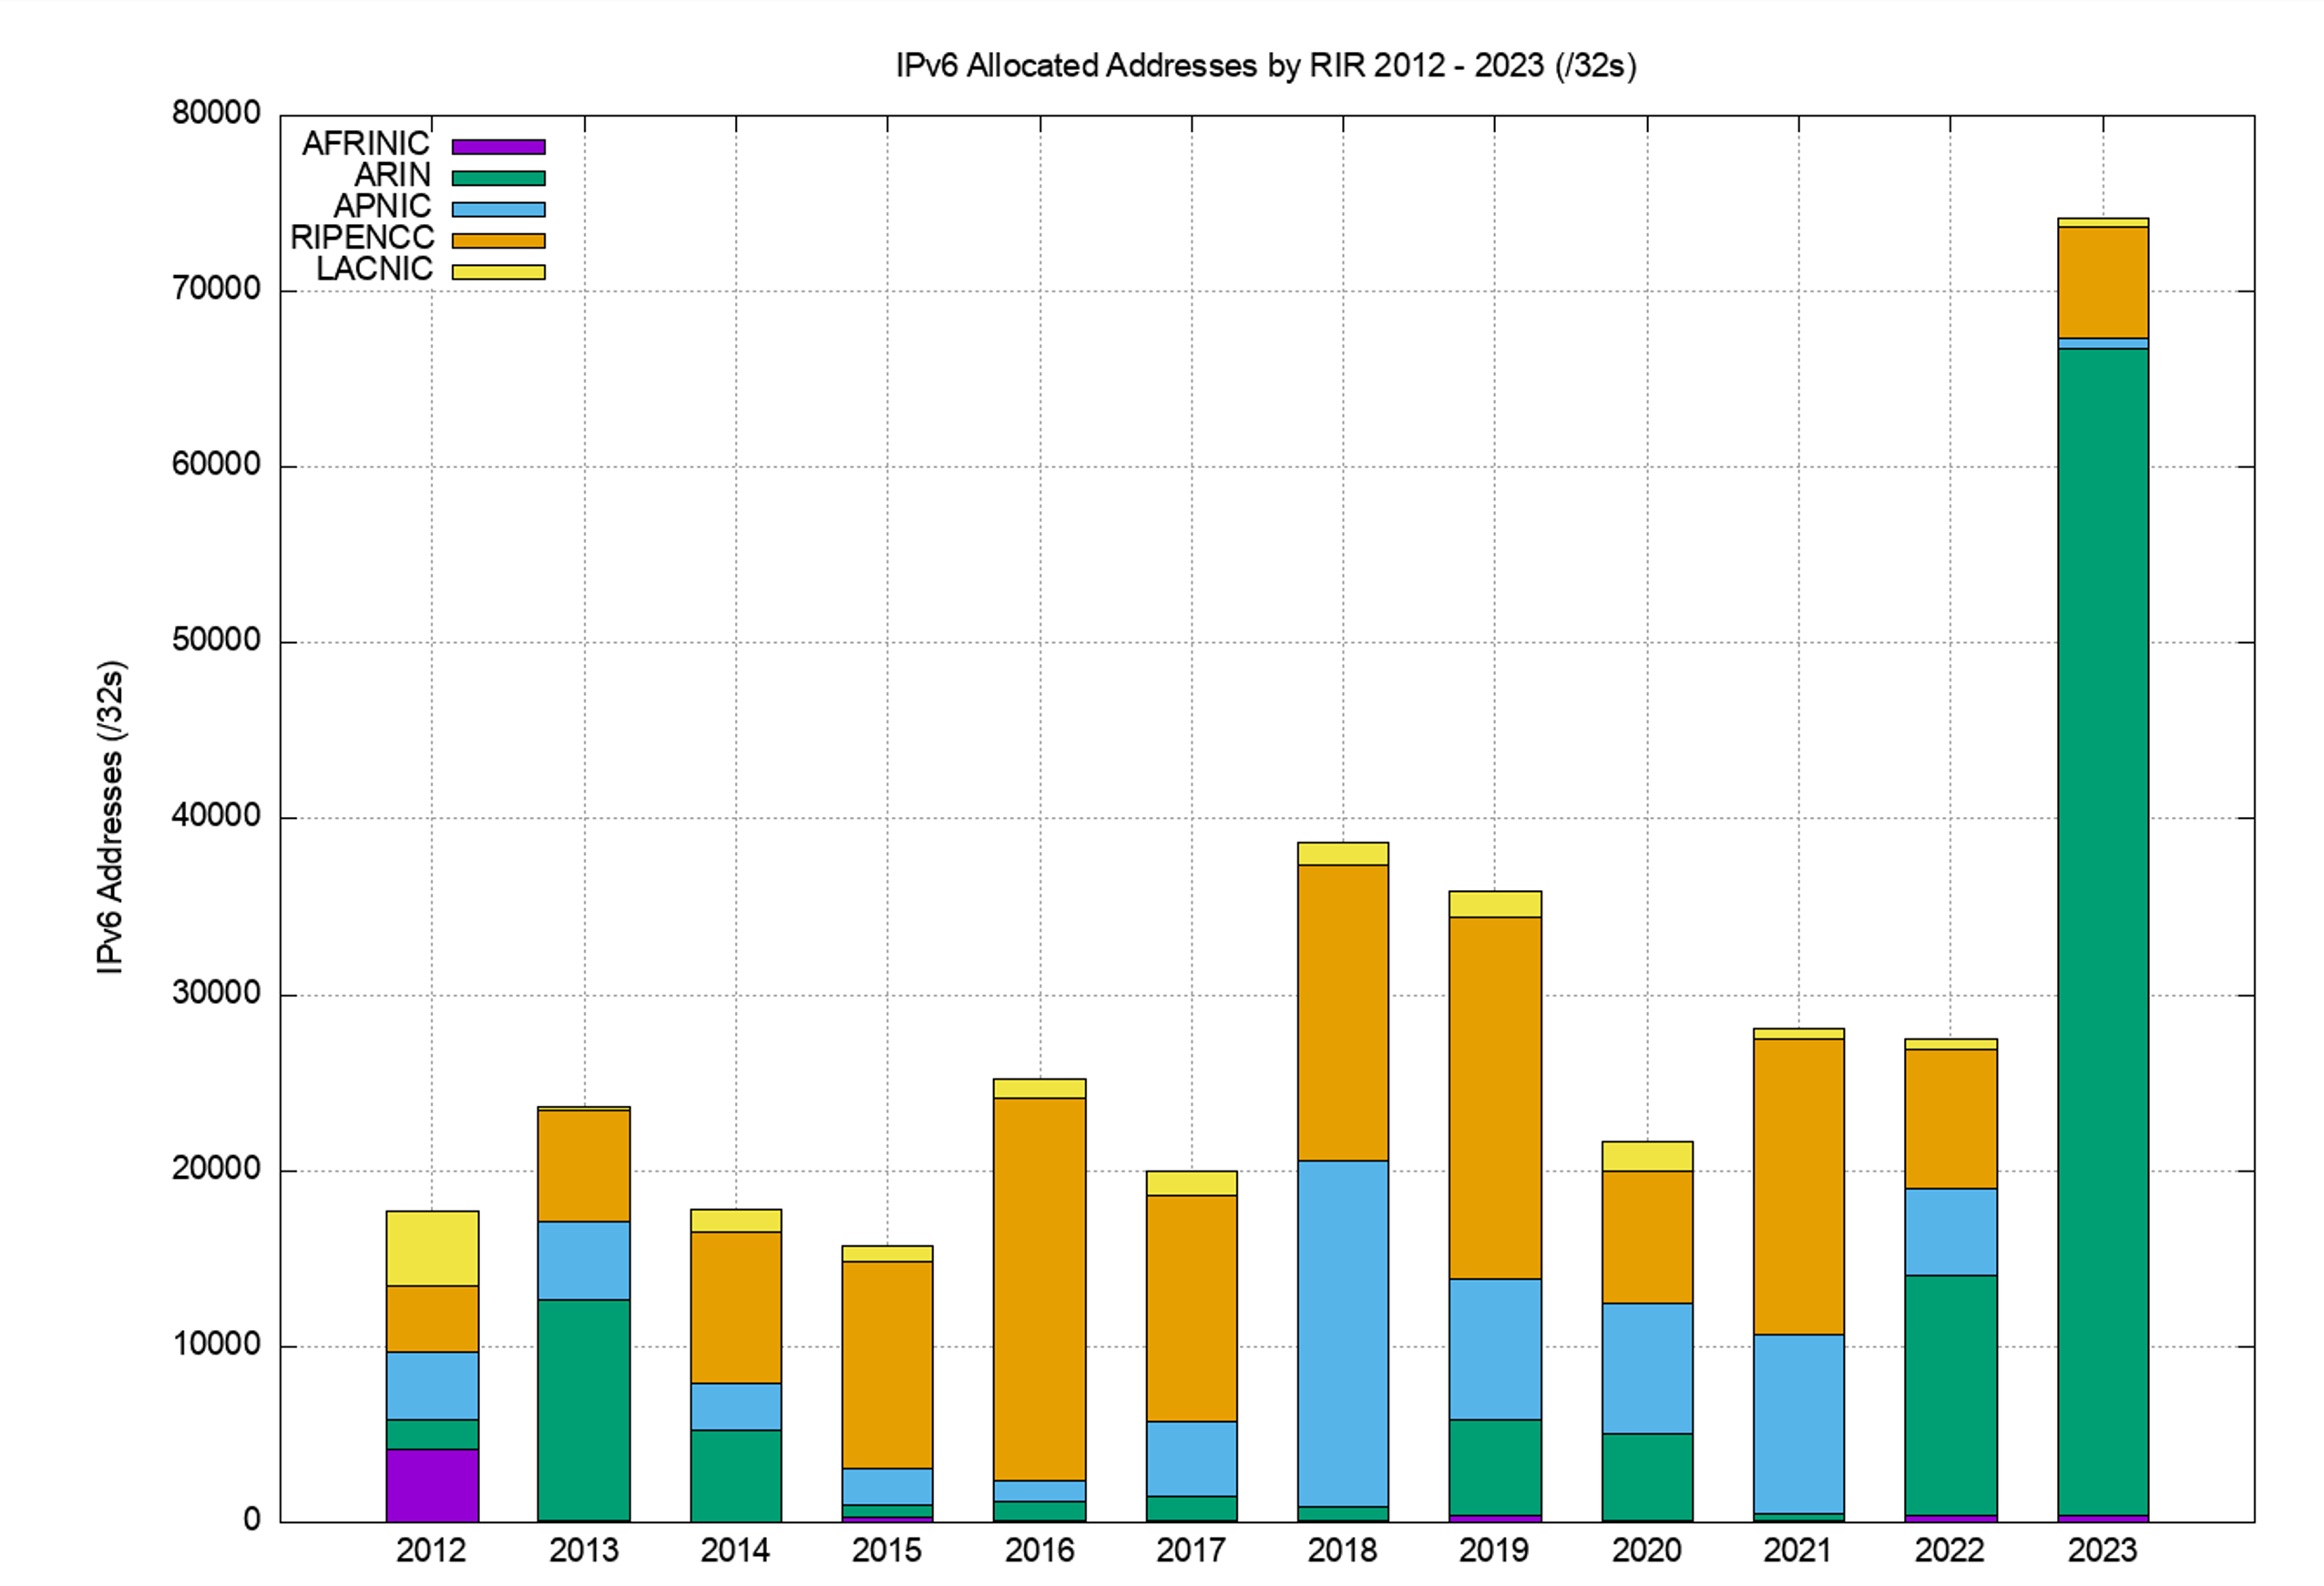
The address assignment data tells a slightly different story. Table 16 shows the number of allocated IPv6 /32s per year. The 2023 allocation IPv6 address volume in APNIC was significantly lower than in 2022, and somewhat lower in LACNIC and the RIPE NCC region. ARIN allocated a /16 address block to Capital One Financial Cooperation, one of the larger banks in the United States with a large credit card base in retail operations.
| Addresses (/32s) | 2011 | 2012 | 2013 | 2014 | 2015 | 2016 | 2017 | 2018 | 2019 | 2020 | 2021 | 2022 | 2023 |
| AFRINIC | 155 | 4,201 | 66 | 48 | 308 | 76 | 112 | 71 | 360 | 88 | 141 | 387 | 400 |
| APNIC | 9,506 | 3,807 | 4,462 | 2,663 | 2,108 | 1,235 | 4,228 | 19,681 | 7,945 | 7,365 | 10,185 | 4,856 | 599 |
| ARIN | 2,280 | 1,672 | 12,571 | 5,214 | 642 | 1,087 | 1,372 | 844 | 5,520 | 4,975 | 373 | 13,695 | 66,340 |
| LACNIC | 620 | 4,301 | 158 | 1,314 | 953 | 1,173 | 1,427 | 1,327 | 1,496 | 1,669 | 658 | 563 | 467 |
| RIPENCC | 2,425 | 3,729 | 6,385 | 8,608 | 11,754 | 21,689 | 12,836 | 16,776 | 20,603 | 7,523 | 16,774 | 7,996 | 6,353 |
| Total | 14,986 | 17,710 | 23,642 | 17,847 | 15,765 | 25,260 | 19,975 | 38,699 | 35,924 | 21,620 | 28,131 | 27,497 | 74,159 |
Table 16 — IPv6 address allocation volumes by RIR.
Dividing addresses by allocations gives the average IPv6 allocation size in each region (Table 17). Overall, the average IPv6 allocation size is a /28, with the RIPE NCC and ARIN averaging larger individual IPv6 allocations than the other RIRs.
| 2011 | 2012 | 2013 | 2014 | 2015 | 2016 | 2017 | 2018 | 2019 | 2020 | 2021 | 2022 | 2023 | |
| AFRINIC | /31.7 | /26.3 | /32.1 | /32.3 | /30.1 | /32.5 | /32.0 | /32.6 | /30.3 | /32.3 | /31.9 | /30.6 | /30.2 |
| APNIC | /28.1 | /29.3 | /29.0 | /29.7 | /30.6 | /32.4 | /30.4 | /28.2 | /29.6 | /29.7 | /29.1 | /30.1 | /33.2 |
| ARIN | /30.9 | /30.5 | /27.5 | /28.6 | /31.9 | /31.2 | /31.0 | /31.6 | /28.8 | /29.1 | /32.8 | /27.7 | /25.5 |
| LACNIC | /29.7 | /27.9 | /32.5 | /31.9 | /32.1 | /31.8 | /32.1 | /32.1 | /32.1 | /32.1 | /32.1 | /32.2 | /32.4 |
| RIPENCC | /31.4 | /30.9 | /30.4 | /30.0 | /29.5 | /28.6 | /29.3 | /29.3 | /29.2 | /29.5 | /29.2 | /29.4 | /29.4 |
| Average | /29.9 | /29.6 | /29.3 | /30.0 | /30.2 | /29.8 | /30.2 | /29.4 | /29.6 | /30.0 | /29.6 | /29.2 | /27.7 |
Table 17 — Average IPv6 address allocation size by RIR.
The number and volume of IPv6 allocations per RIR per year are shown in Figures 12 and 13.
It might be tempting to ascribe the decline in 2020 of IPv6 allocations from the RIPE NCC to the year when many European economies were hit hard by COVID-19 measures. Arguing against that is the observation that economies all over the world have been similarly affected, yet the decline in IPv6 allocation activity in 2020 is only seen in the data from the RIPE NCC. However, it’s an interesting question to ask as to why the IPv6 address allocation activity has slumped in the European economies (Tables 18 and 19).
| Rank | 2019 | 2020 | 2021 | 2022 | 2023 | |||||
| 1 | Brazil | 1,112 | Brazil | 1,394 | USA | 619 | USA | 638 | USA | 691 |
| 2 | USA | 538 | USA | 588 | Russia | 576 | India | 377 | India | 424 |
| 3 | Russia | 502 | Indonesia | 389 | Brazil | 508 | Brazil | 339 | Brazil | 267 |
| 4 | Germany | 407 | India | 226 | Netherlands | 448 | Bangladesh | 239 | Indonesia | 198 |
| 5 | Indonesia | 366 | Netherlands | 199 | India | 390 | Germany | 158 | Bangladesh | 159 |
| 6 | Netherlands | 342 | Germany | 192 | UK | 304 | Russia | 138 | Viet Nam | 143 |
| 7 | UK | 223 | Bangladesh | 182 | Bangladesh | 213 | UK | 125 | Germany | 126 |
| 8 | Bangladesh | 202 | Russia | 128 | Germany | 196 | Indonesia | 113 | Colombia | 99 |
| 9 | France | 179 | Australia | 118 | Indonesia | 110 | Australia | 100 | Mexico | 96 |
| 10 | China | 165 | China | 115 | Hong Kong | 108 | Viet Nam | 91 | UK | 85 |
Table 18 — IPv6 allocations by year and economy.
Table 18 shows the economies that received the largest number of individual IPv6 allocations, while Table 19 shows the amount of IPv6 address space assigned on a per economy basis for the past five years (using units of /32s).
| Rank | 2019 | 2020 | 2021 | 2022 | 2023 | |||||
| 1 | China | 6,787 | China | 6,765 | China | 5,424 | USA | 13,919 | USA | 66,579 |
| 2 | USA | 5,510 | USA | 5,051 | Russia | 4,409 | China | 4,354 | Lithuania | 522 |
| 3 | Russia | 3,716 | Brazil | 1,358 | India | 4,281 | Russia | 925 | UK | 513 |
| 4 | Germany | 2,522 | Netherlands | 1,331 | Netherlands | 3,390 | UK | 734 | Germany | 478 |
| 5 | Netherlands | 2,516 | Germany | 716 | UK | 2,249 | Germany | 706 | Russia | 371 |
| 6 | UK | 1,355 | Russia | 715 | Germany | 896 | Moldava | 456 | Ukraine | 369 |
| 7 | France | 1,182 | UK | 552 | Ukraine | 651 | France | 404 | Iran | 314 |
| 8 | Italy | 1,052 | Italy | 391 | Lithuania | 633 | Netherlands | 397 | France | 276 |
| 9 | Brazil | 1,049 | France | 390 | Brazil | 502 | Italy | 363 | Seychelles | 258 |
| 10 | Spain | 854 | Turkey | 290 | USA | 491 | Brazil | 328 | Rwanda | 256 |
Table 19 — IPv6 address allocation volumes by year and economy (/32s).
We can also look at the allocated address pools for top the 25 economies (Table 20).
| Rank | CC | Allocated (/48s) | % Total | /48s per capita | Advertised /48s | Deployment | Name |
| 1 | US | 9,126,192,440 | 31.30% | 26.8 | 1,399,113,308 | 13.80% | USA |
| 2 | CN | 4,220,731,486 | 14.50% | 3 | 1,665,240,127 | 16.40% | China |
| 3 | DE | 1,567,556,343 | 5.40% | 18.8 | 1,067,282,327 | 10.50% | Germany |
| 4 | GB | 1,508,704,744 | 5.20% | 22.2 | 468,594,870 | 4.60% | UK |
| 5 | FR | 983,511,453 | 3.40% | 15.2 | 181,849,911 | 1.80% | France |
| 6 | RU | 896,401,723 | 3.10% | 6.2 | 196,222,375 | 1.90% | Russia |
| 7 | NL | 774,635,835 | 2.70% | 43.9 | 328,258,068 | 3.20% | Netherlands |
| 8 | IT | 689,770,536 | 2.40% | 11.7 | 426,414,680 | 4.20% | Italy |
| 9 | JP | 665,723,093 | 2.30% | 5.4 | 510,861,733 | 5.00% | Japan |
| 10 | AU | 622,396,680 | 2.10% | 23.4 | 309,895,455 | 3.10% | Australia |
| 11 | BR | 543,392,965 | 1.90% | 2.5 | 413,190,587 | 4.10% | Brazil |
| 12 | SE | 456,720,739 | 1.60% | 42.9 | 90,319,074 | 0.90% | Sweden |
| 13 | IN | 436,733,275 | 1.50% | 0.3 | 370,137,769 | 3.60% | India |
| 14 | PL | 405,405,950 | 1.40% | 10 | 235,541,715 | 2.30% | Poland |
| 15 | ES | 402,784,297 | 1.40% | 8.5 | 111,136,126 | 1.10% | Spain |
| 16 | KR | 345,767,946 | 1.20% | 6.7 | 2,427,826 | 0.00% | Korea |
| 17 | AR | 344,328,294 | 1.20% | 7.5 | 284,954,258 | 2.80% | Argentina |
| 18 | ZA | 325,325,998 | 1.10% | 5.4 | 293,199,836 | 2.90% | South Africa |
| 19 | EG | 270,336,004 | 0.90% | 2.4 | 270,008,322 | 2.70% | Egypt |
| 20 | CH | 256,115,135 | 0.90% | 29 | 119,093,658 | 1.20% | Switzerland |
| 21 | AE | 248,643,595 | 0.90% | 26 | 15,532,070 | 0.20% | UAE |
| 22 | TR | 241,631,262 | 0.80% | 2.8 | 43,376,879 | 0.40% | Turkey |
| 23 | IR | 208,338,953 | 0.70% | 2.3 | 49,976,209 | 0.50% | Iran |
| 24 | CZ | 196,673,655 | 0.70% | 18.7 | 116,790,955 | 1.20% | Czechia |
| 25 | UA | 179,634,359 | 0.60% | 4.8 | 55,948,379 | 0.60% | Ukraine |
Table 20 — IPv6 allocated address pools per economy, December 2023.
While the United States tops this list of the total pool of allocated IPv6 addresses, with 14% of the total span of allocated IPv6 addresses, the per capita number is lower than others in this list (Netherlands, Sweden, Switzerland). The large IPv6 address pools allocated to some ISPs are likely due to early IPv6 allocations, made under a somewhat different allocation policy regime than what is used today.
Twenty years ago, it was common practice to point out the inequities in the state of IPv4 address deployment. At the time, some US universities had more IPv4 addresses at their disposal than some highly populated developing economies, and the disparity was a part of the criticism of the address management practices that were used at the time.
The RIR system was intended to address this issue of predisposition to a biased outcome. The concept behind the system is that within the regional community, each community could develop its own address distribution policies and could determine for themselves what they meant by such terms as ‘fairness’ and ‘equity’ and then direct their RIR to implement these policies.
While IPv4 had an evident early adopter reward in that the address allocations in the IPv4 class-based address plan could be quite extravagant, the idea with IPv6 was to develop address allocation from the outset through local bottom-up policy determinate frameworks so inequities in the outcome would be avoided, or so it was hoped.
It was also envisaged that with such a vast address plan provided by 128 bits of address space, the entire concept of scarcity and inequity would be largely irrelevant. 2128 is a vast number and the entire concept of comparison between two vast pools of addresses is somewhat irrelevant. So, when we look at the metric of /48s per head of population, don’t forget that a /48 is actually 80 bits of address space, which is massively larger than the entire IPv4 address space. Even India’s average of 0.1 /48s per capita is still a truly massive number of IPv6 addresses!
However, before we go too far down this path it is also useful to remember that the 128 bits of address space in IPv6 have become largely a myth. We sliced off 64 bits in the address plan for no particularly good reason, as it turns out. We then sliced off a further 16 bits for again no particularly good reason. Sixteen bits for end site addresses allows for some 65,000 distinct networks within each site, which is somewhat outlandish in pretty much every case. The result is that the vastness of the address space represented by 128 bits in IPv6 is, in fact, not so vast in practice.
The usable address prefix space in IPv4 roughly equates to a /32 end address in IPv4 with around a /48 prefix in IPv6. So perhaps this comparison of /48s per capita is not entirely fanciful, and there is some substance to the observation that there are inequities in the address distribution in IPv6 so far. However, unlike IPv4, the exhaustion of the IPv6 address space is still quite some time off, and we still believe that there are sufficient IPv6 addresses to support a uniform address utilization model across the entire world of silicon over time.
There is a larger question about the underlying networking paradigm in today’s public network. IPv6 attempts to restore the 1980s networking paradigm of a true peer-to-peer network where every connected device can send packets to any other connected device. However, today’s networked environment regards such unconstrained connectivity as a liability. Exposing an end-client device is regarded as being unnecessarily foolhardy, and today’s network paradigm relies on client-initiated transactions.
This is well-suited to NAT-based IPv4 connectivity, and the question regarding the long-term future of an IPv6 Internet is whether we want to bear the costs of maintaining end-client unique addressing plans, or whether NATs in IPv6 might prove to be the most cost-effective service platform for the client side of client/server networks.
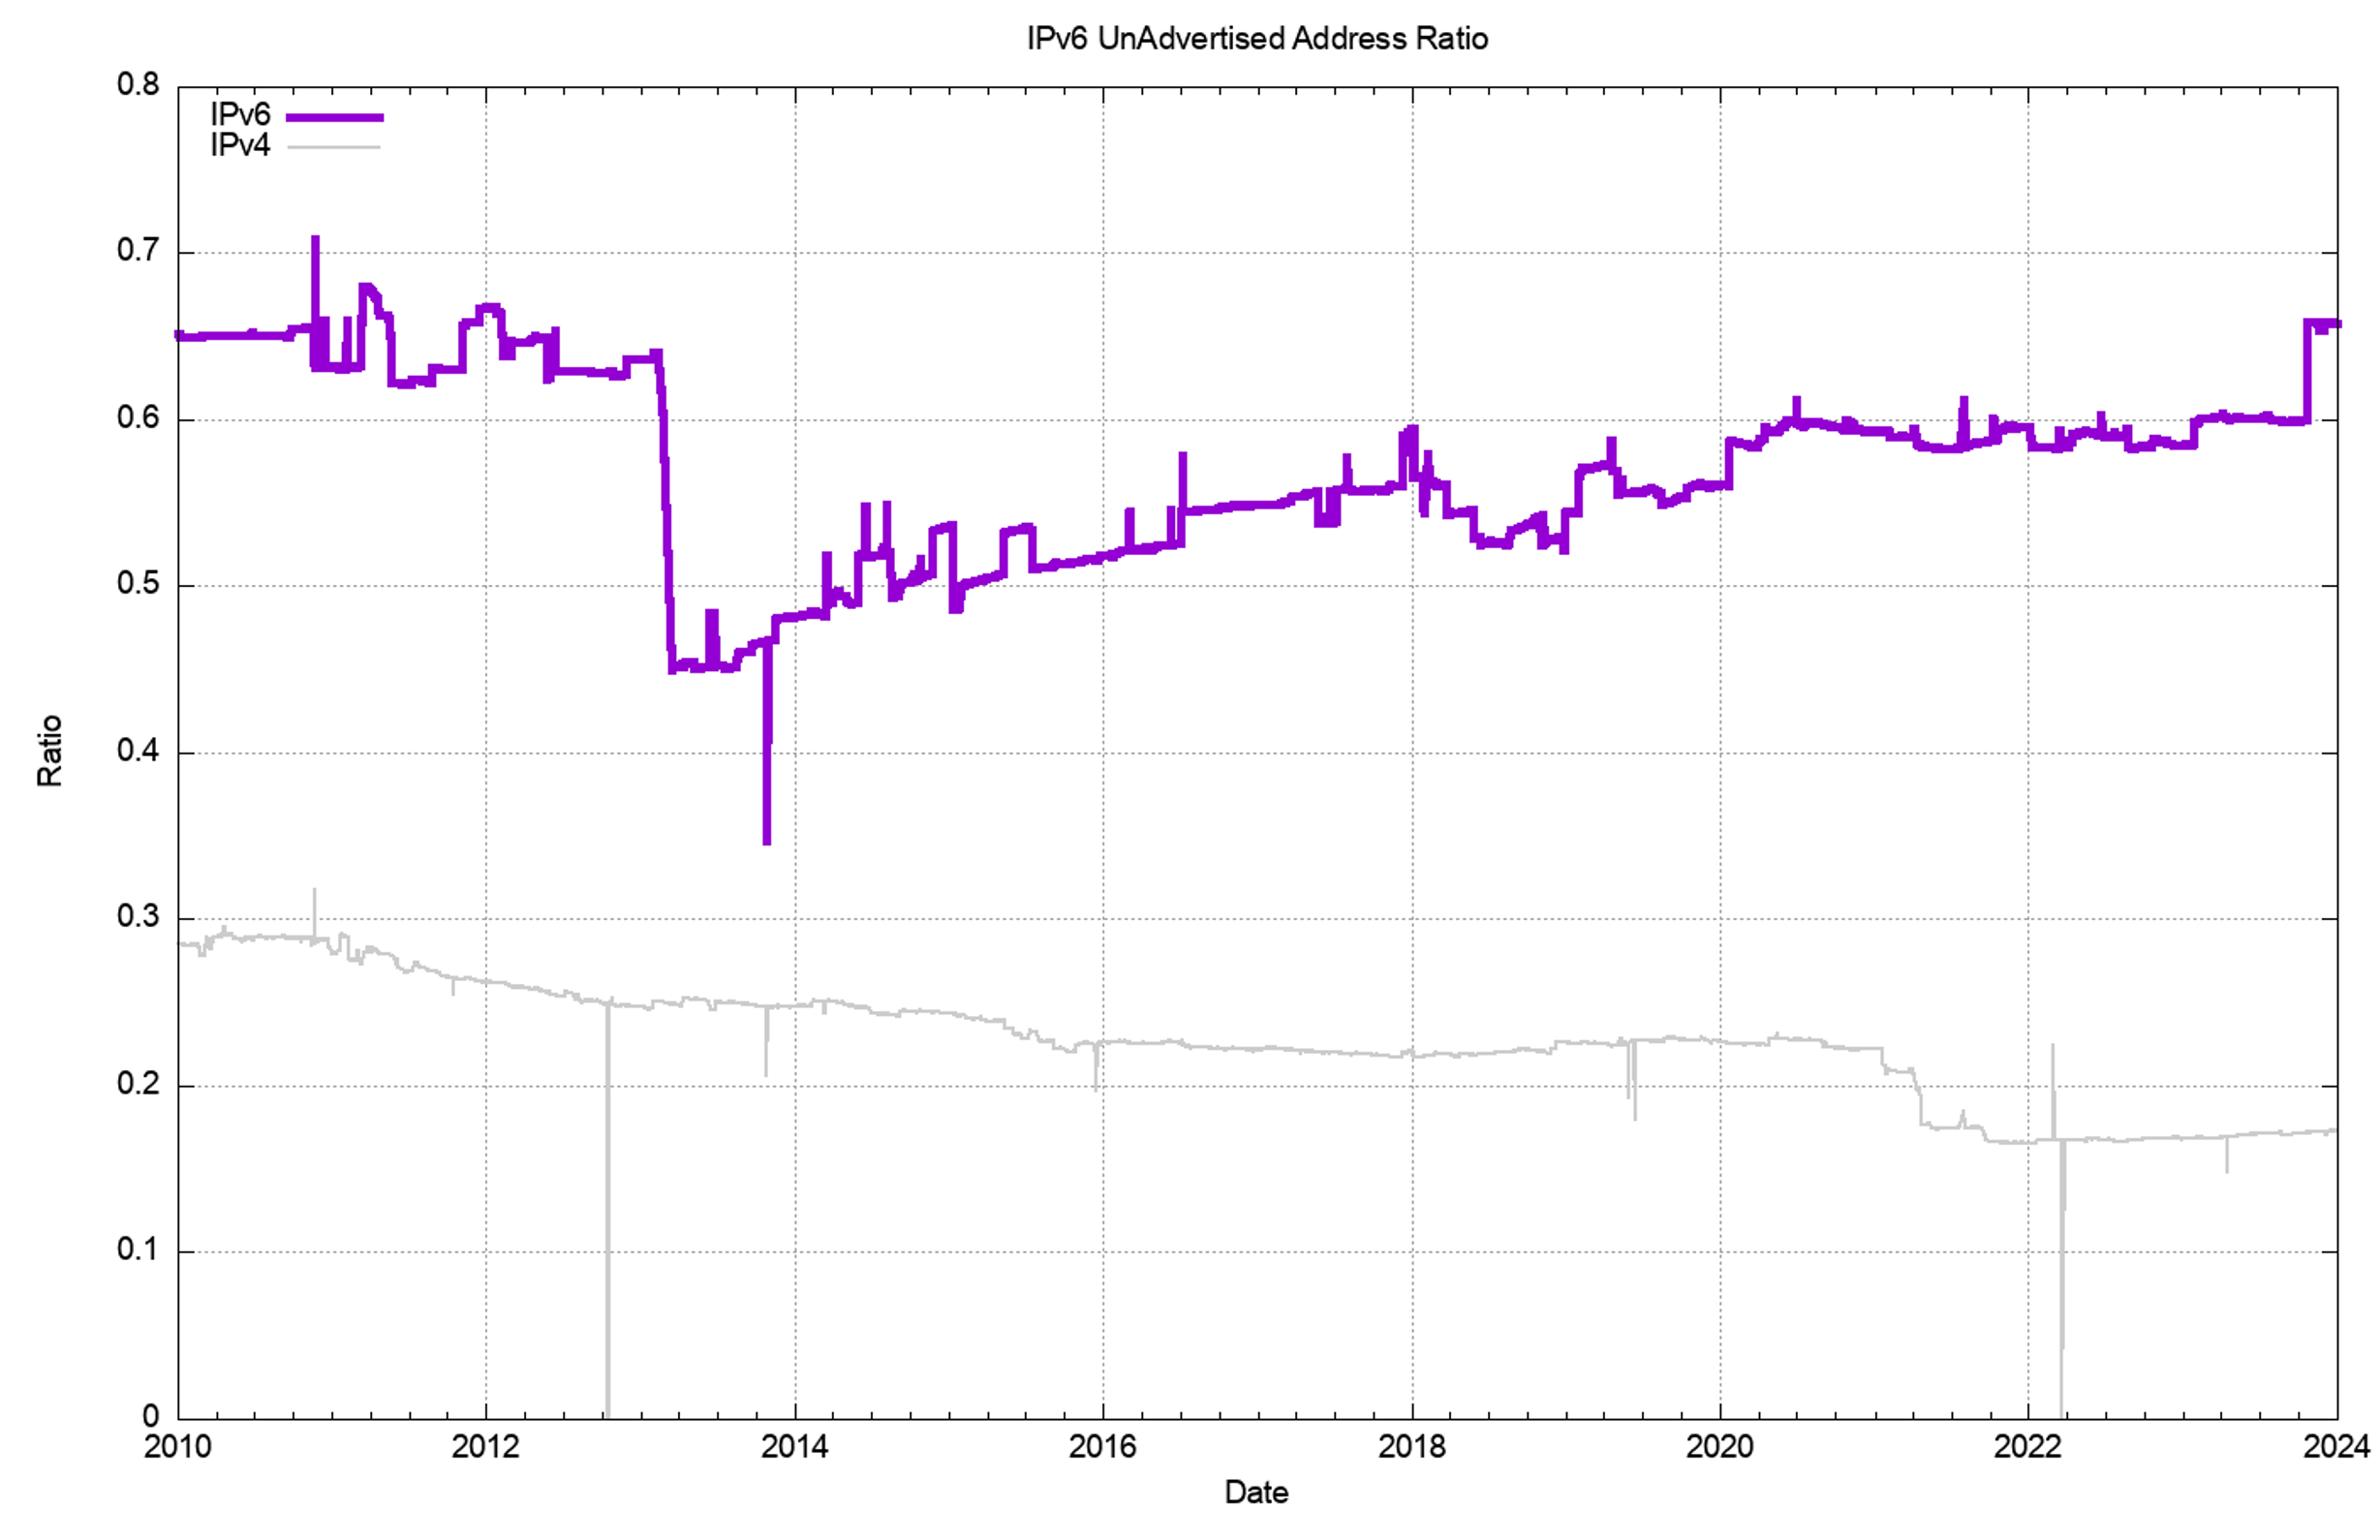
To what extent are allocated IPv6 addresses visible as advertised prefixes in the Internet’s routing table?
Figure 14 shows the overall counts of advertised, unadvertised and total allocated address volume for IPv6 since 2010, while Figure 15 shows the advertised address span as a percentage of the total span of allocated and assigned IPv6 addresses.
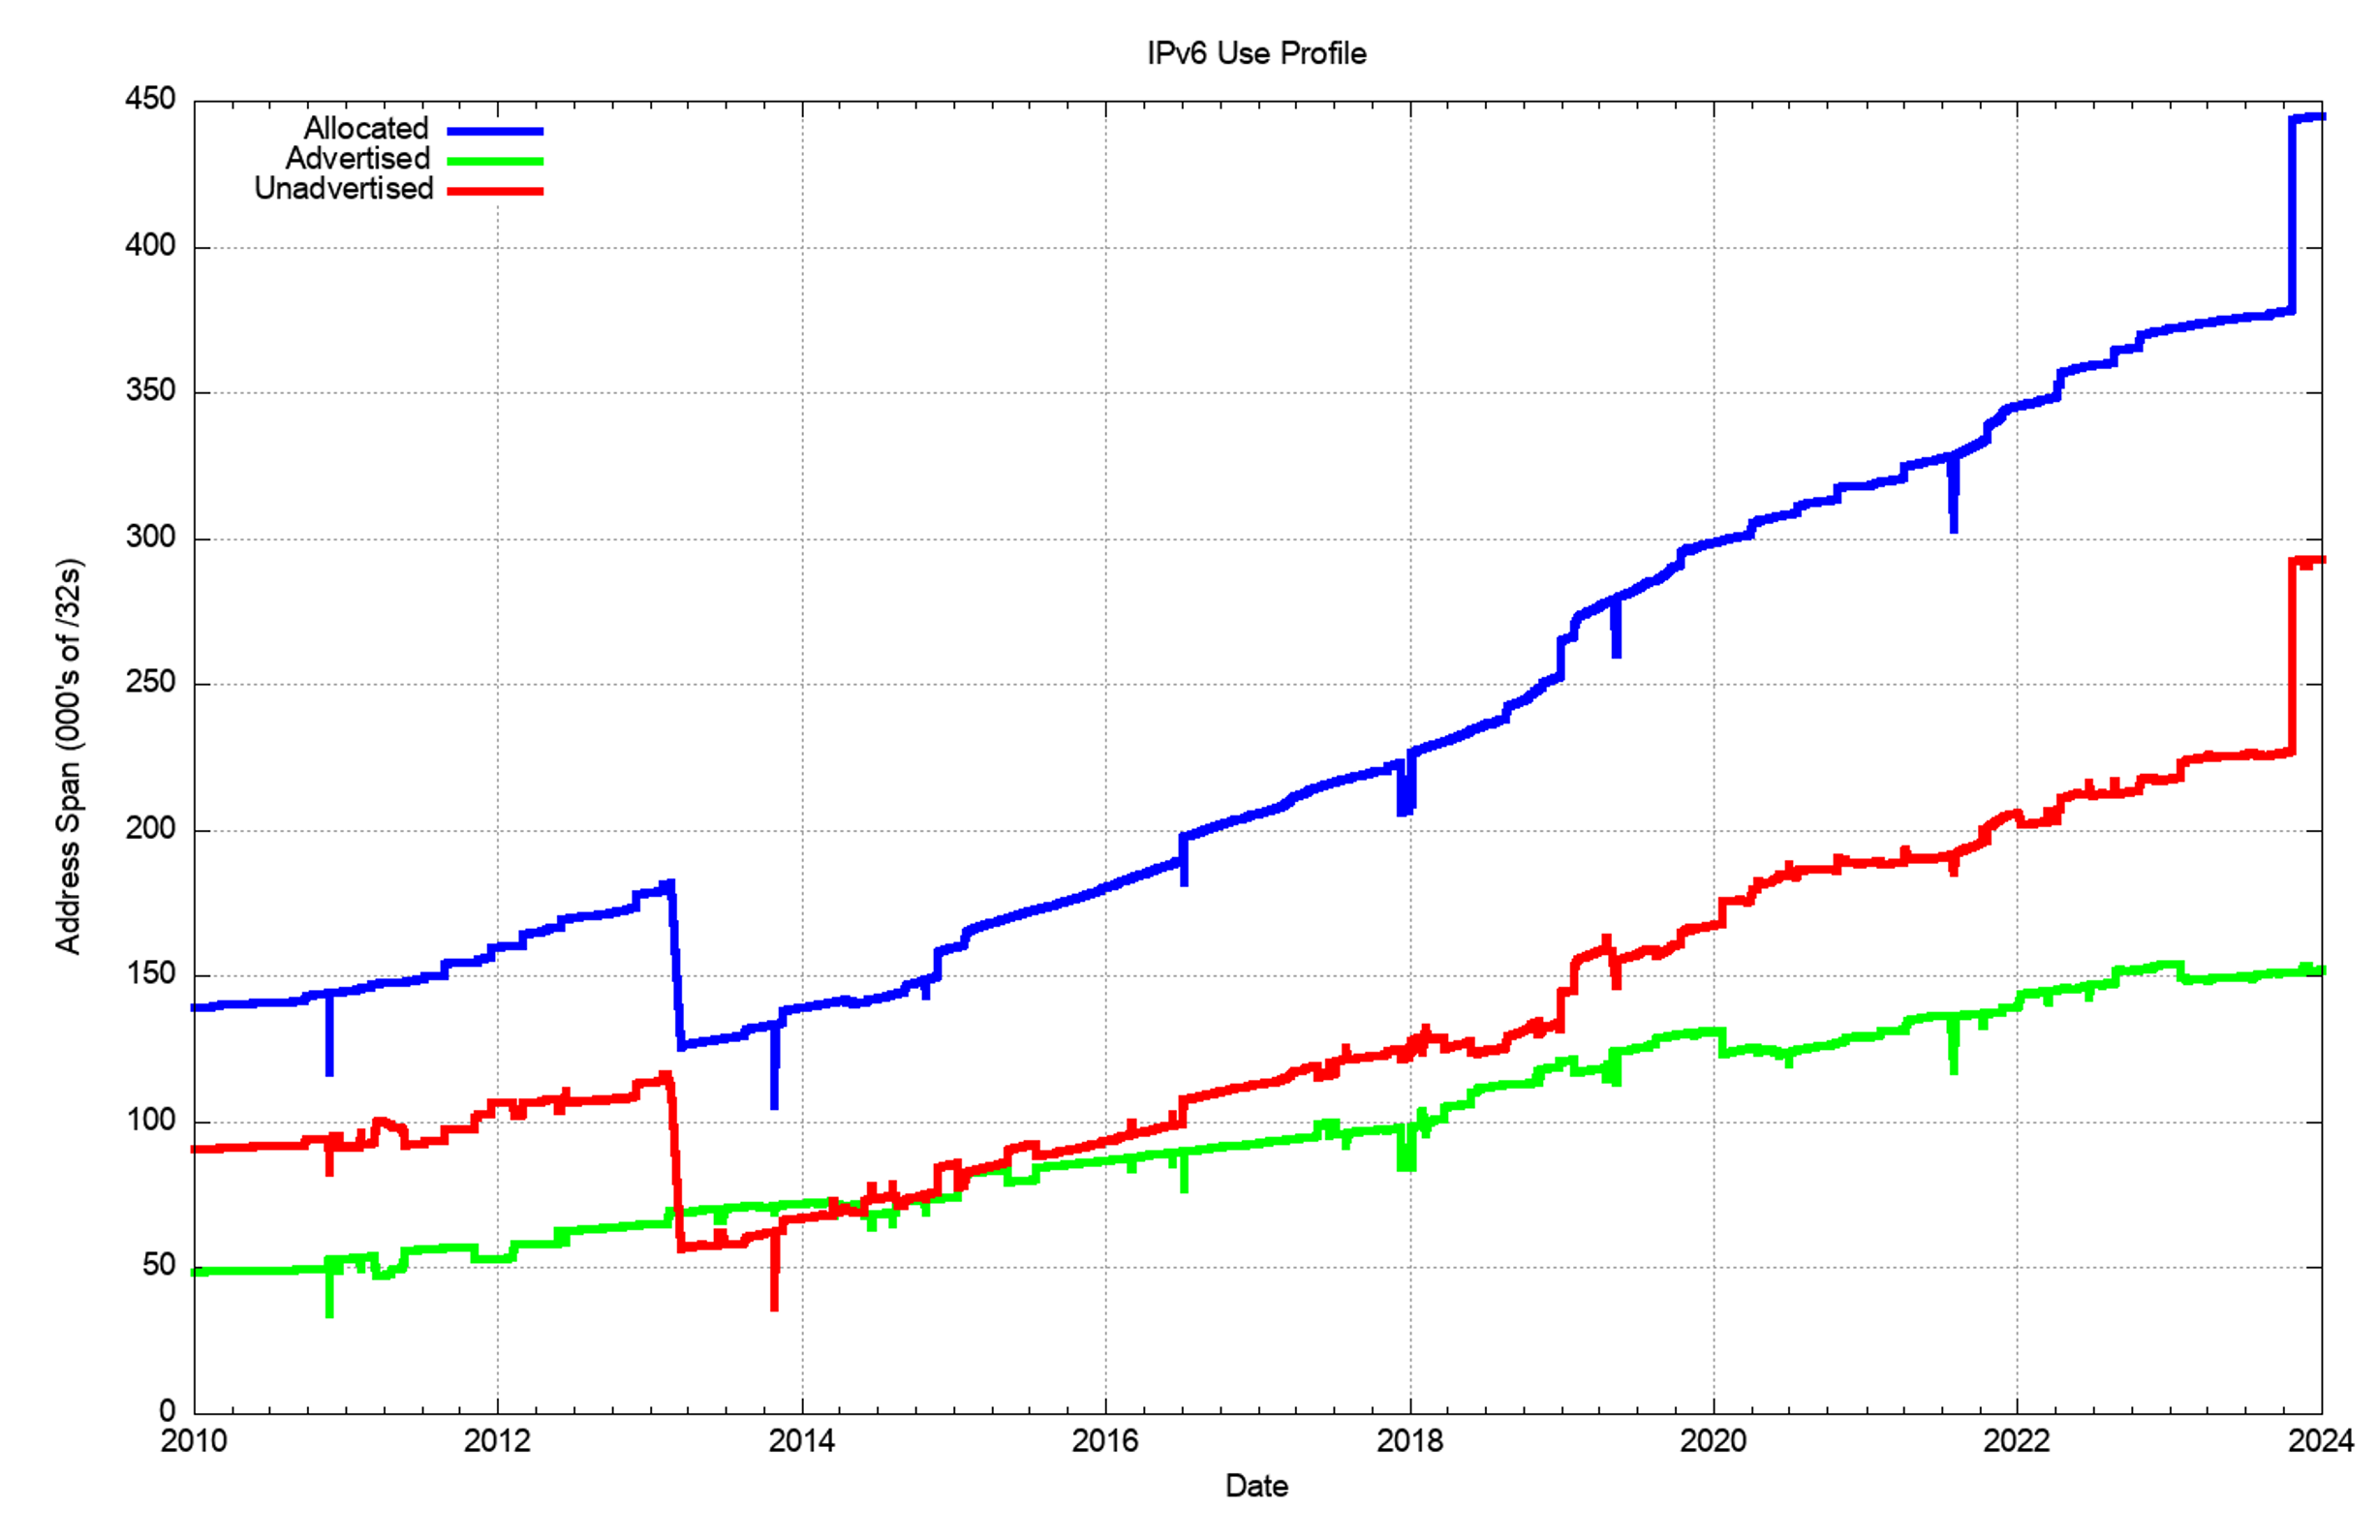
The drop in the allocated address span in 2013 is the result of a change in LACNIC where a single large allocation into Brazil was replaced by the recording of direct allocations and assignments to ISPs and similar end entities.
From a history of careful conservation of IPv4 addresses, where 77% of allocated or assigned IPv4 addresses are advertised in the BGP routing table, a comparable IPv6 figure of 35% does not look all that impressive. But that’s not the point. We chose the 128-bit address size in IPv6 to allow addresses to be used without overriding conservation concerns. We are allowed to be inefficient in address utilization.
At the start of 2024, we have an advertised IPv6 address span that is the equivalent of 152,000 /32s, or some 9.9 billion end-site /48 prefixes. That is just 0.004% of the total number of /48 prefixes in IPv6.
The outlook for the Internet
Once more the set of uncertainties that surround the immediate future of the Internet are considerably greater than the set of predictions that we can be reasonably certain about.
2017 saw a sharp rise in IPv6 deployment, influenced to a major extent by the deployment of IPv6 services in India, notably by the Reliance Jio service. The next year, 2018, was a quieter year, although the rise in the second half of the year is due to the initial efforts of mass-scale IPv6 deployment in the major Chinese service providers. This movement accelerated in 2019 and the overall move of some 5% in IPv6 deployment levels had a lot to do with the very rapid rise of IPv6 deployment in China. There has been an ongoing rise in the level of IPv6 within China, and the measured level of IPv6 has risen from 28% of the user base to 32% over 2023, or an expansion of the Chinese IPv6 user pool by 36M end clients over the year.
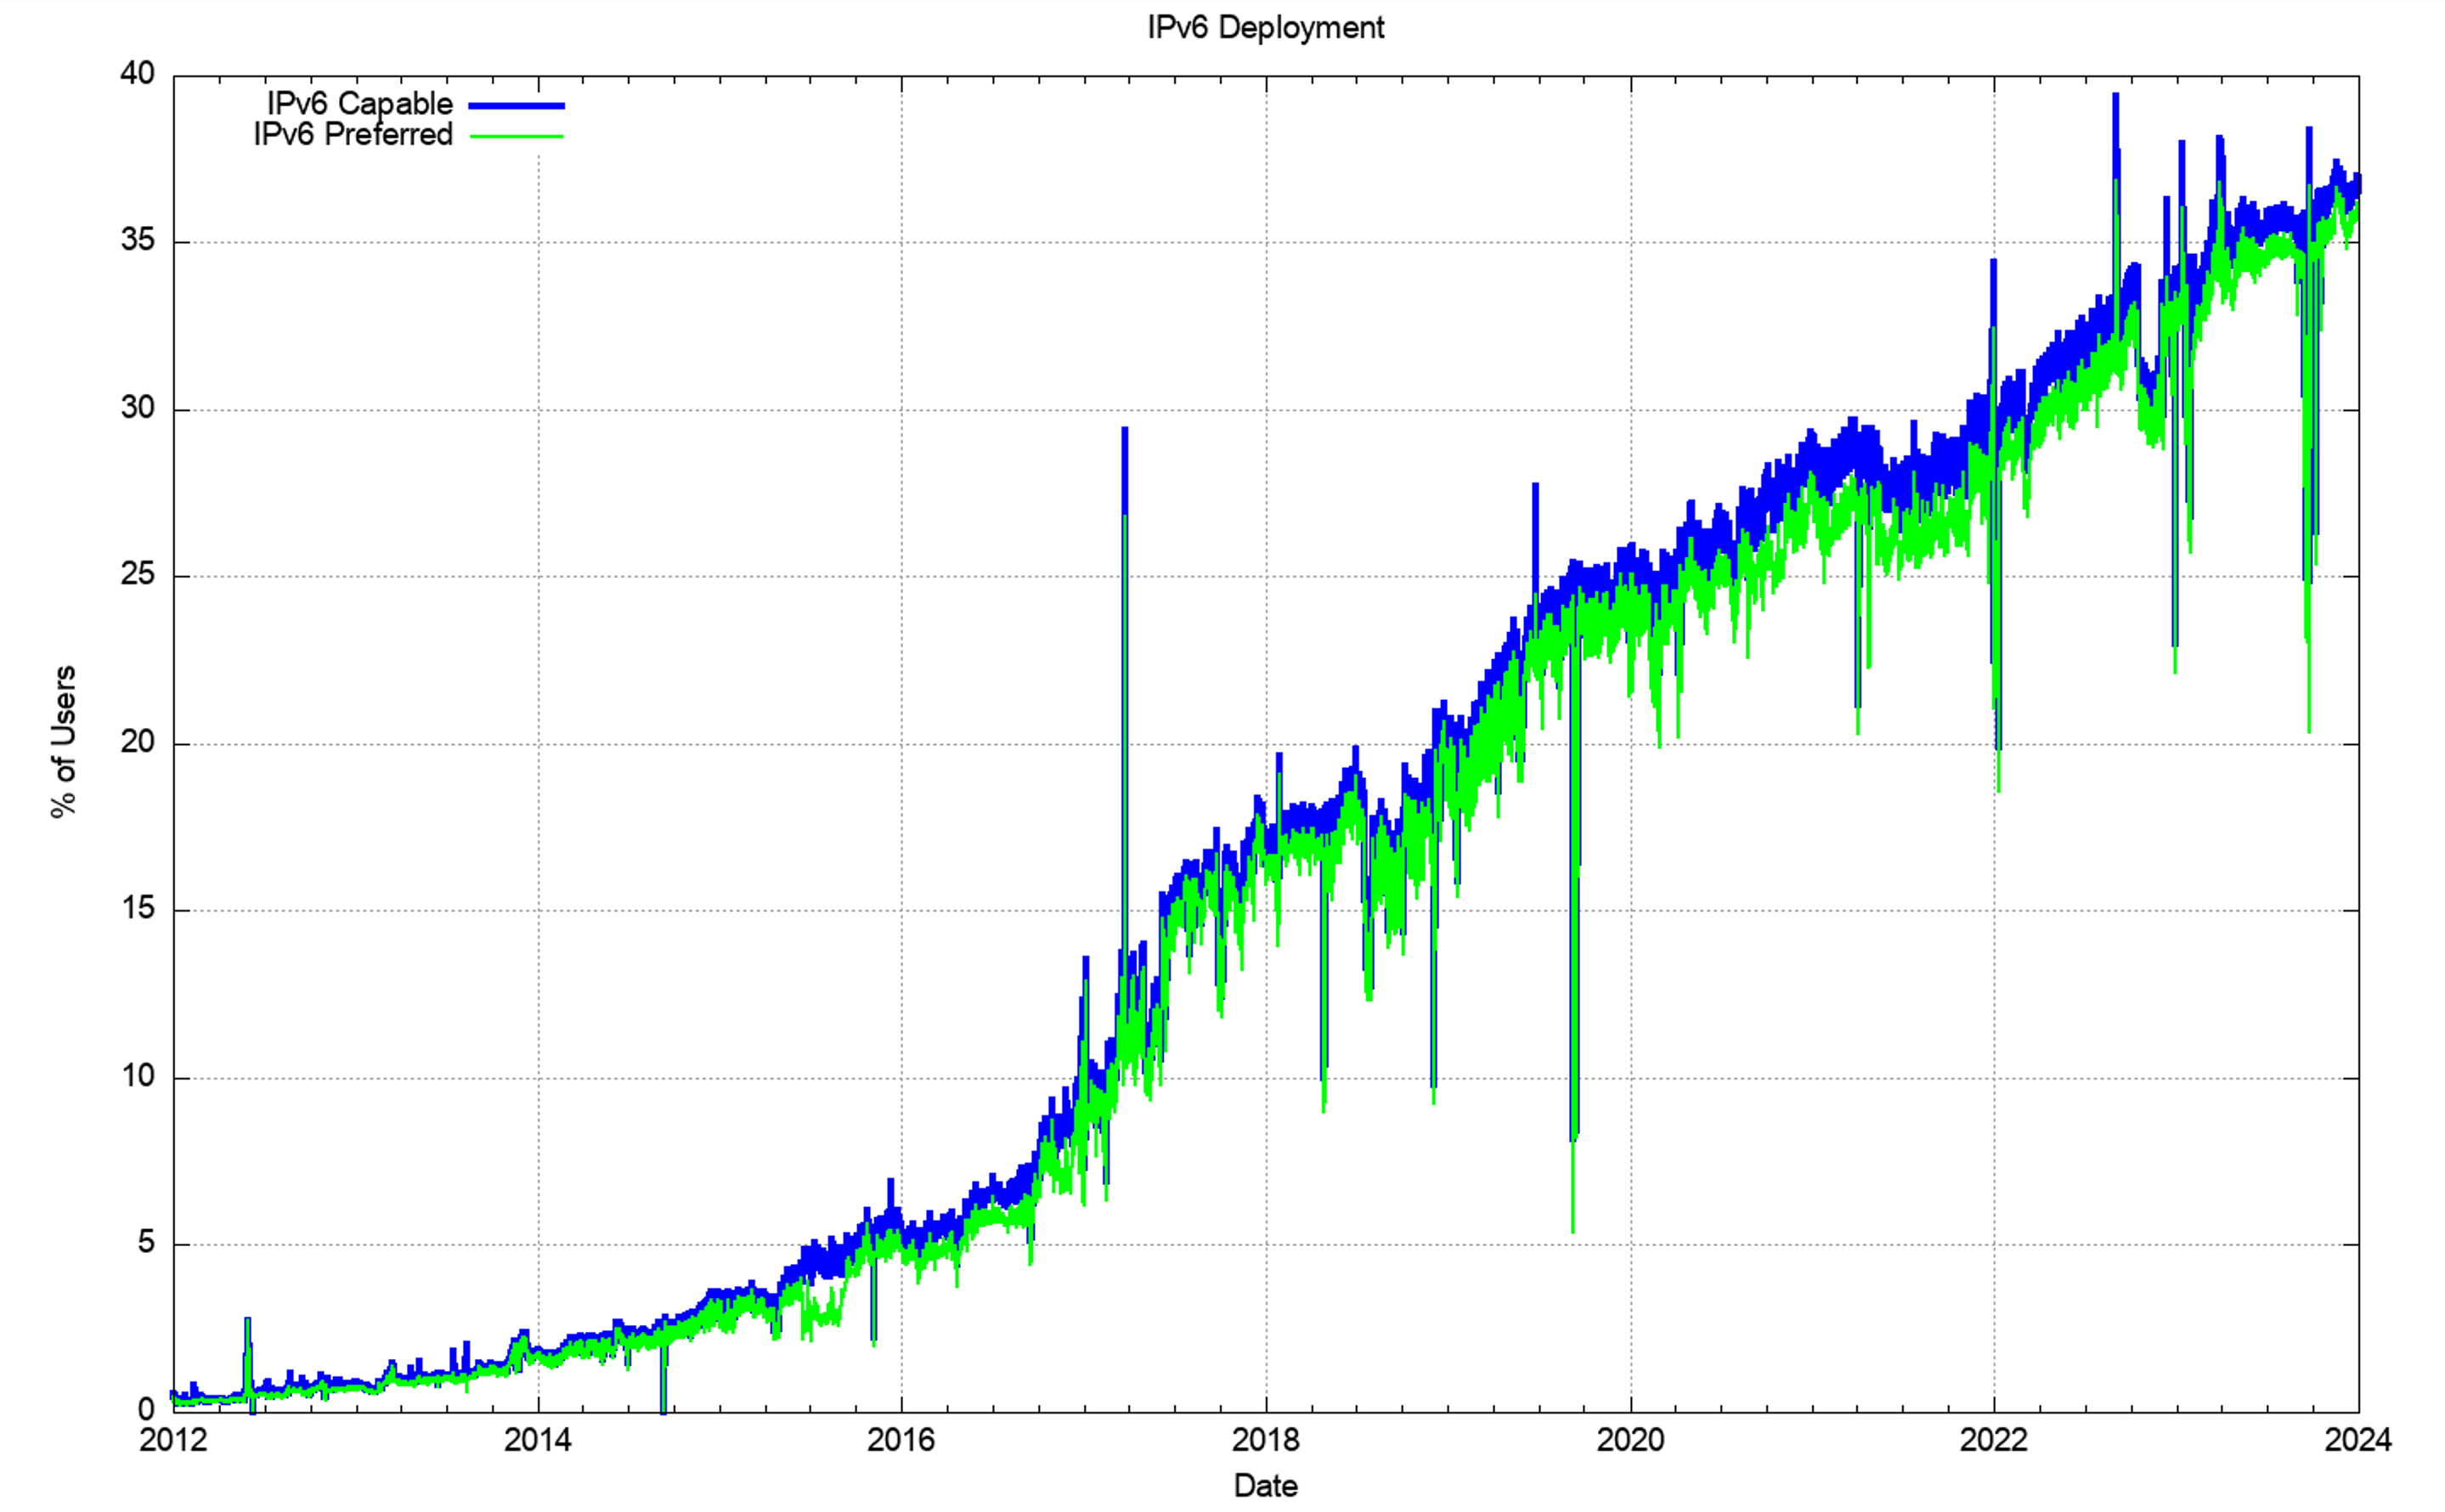
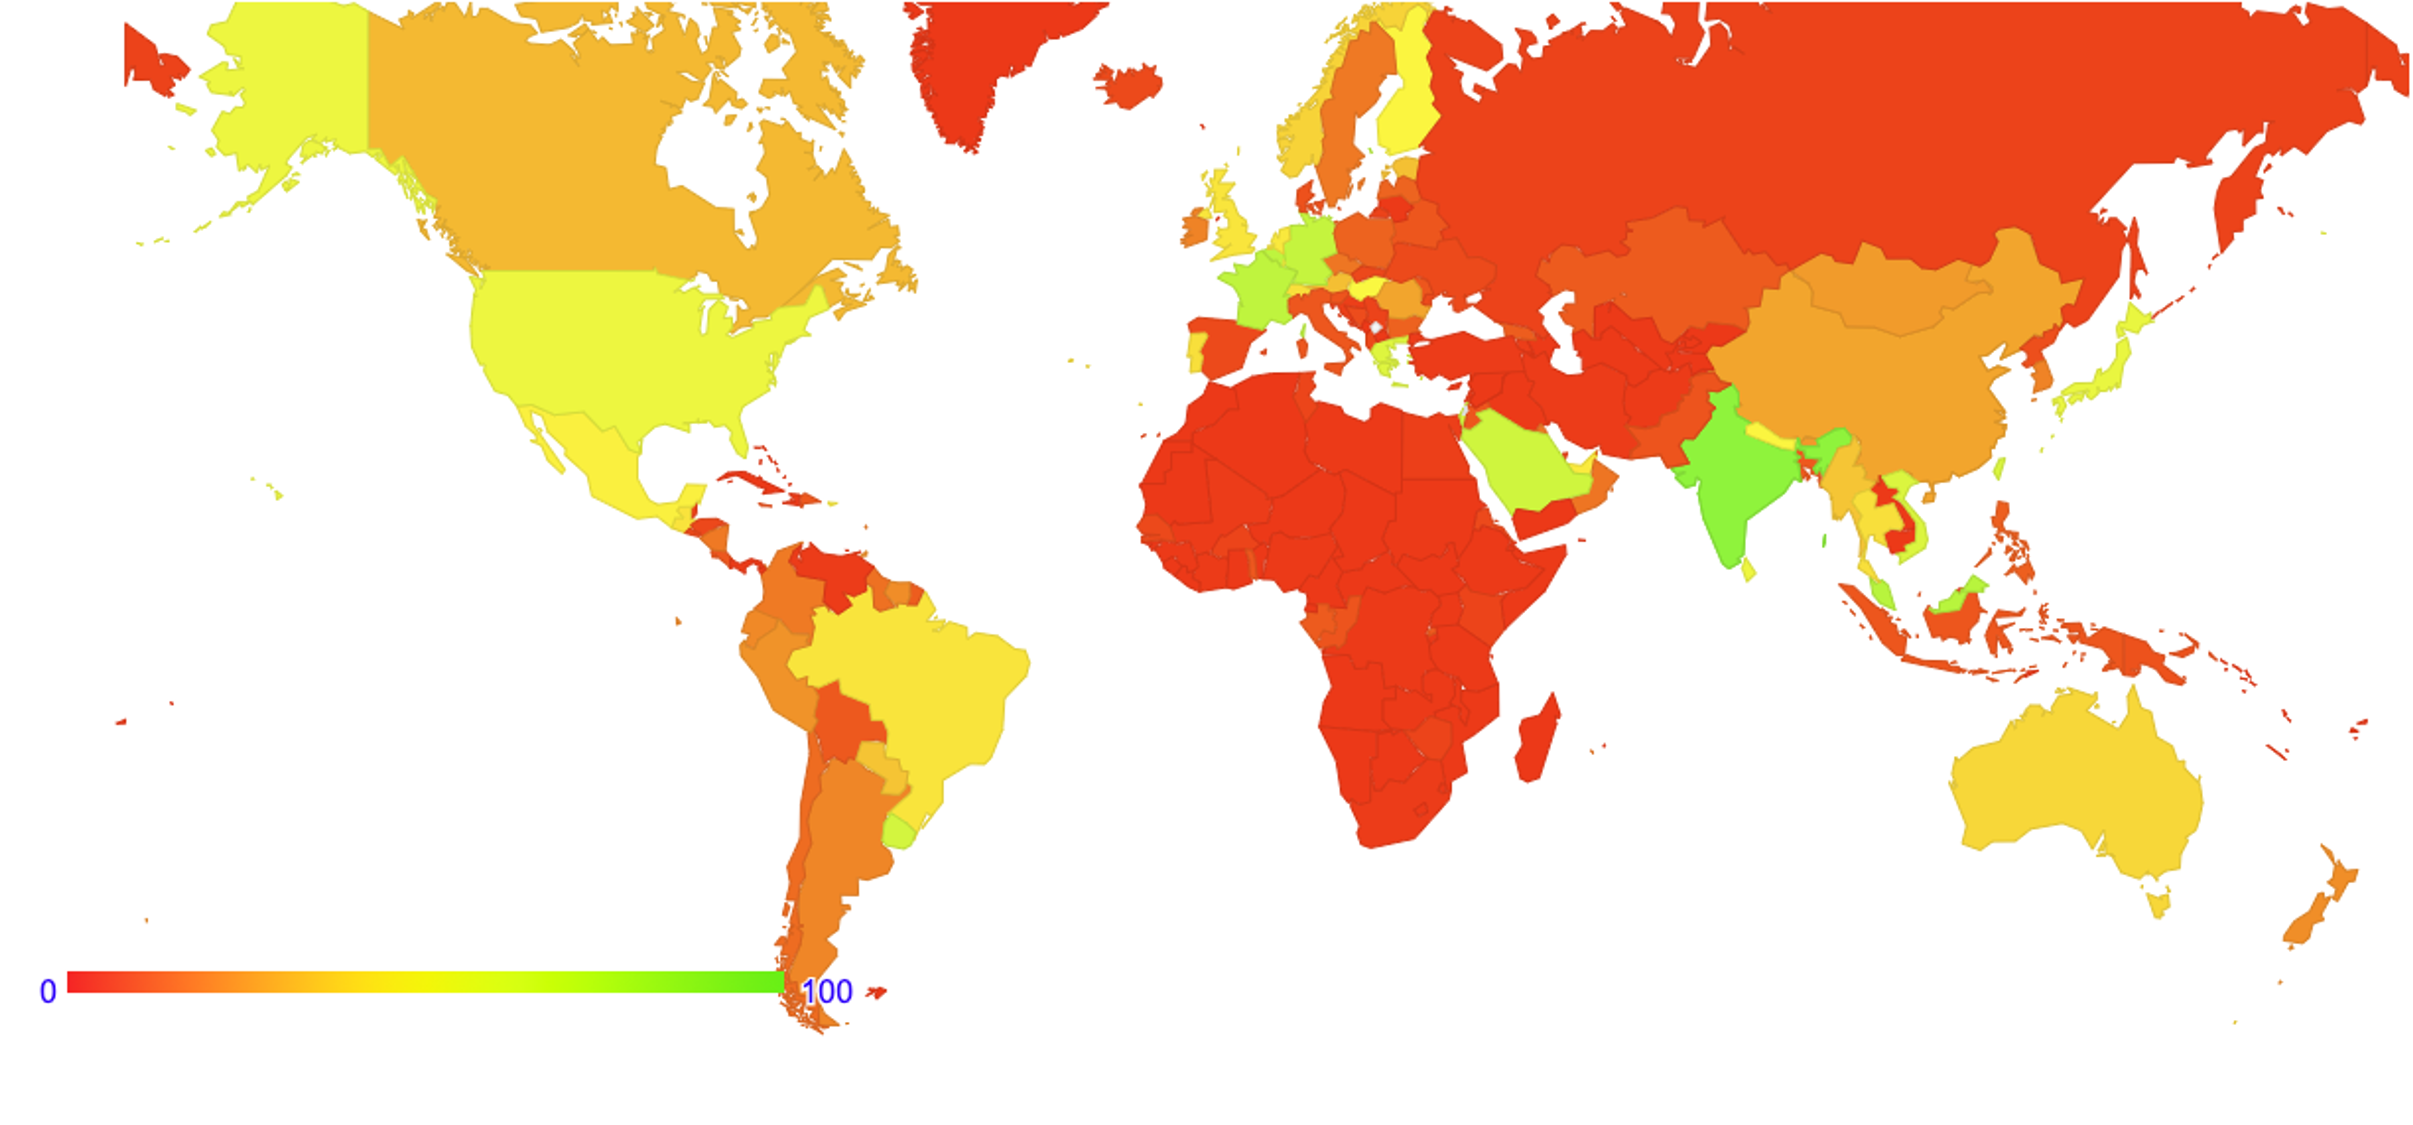
In 2023 the growth patterns for IPv6 are more diffuse around the world with a 2.5% overall growth rate, although there has been steady growth in IPv6 deployment in Mongolia (27%), Bhutan (20%), Nepal (17%), Norway (17%) and Sweden (11%), as shown in Figure 17.
While several service operators have reached the decision point that the anticipated future costs of NAT deployment are unsustainable for their service platform, there remains a considerable school of thought that says that NATs will cost-effectively absorb some further years of Internet population growth. At least that’s the only rationale I can ascribe to a very large number of service providers who are making no visible moves to deploy dual-stack services now. Given that the ultimate objective of this transition is not to turn on dual-stack everywhere, but to turn off IPv4, there is still some time to go, and the uncertainty lies in trying to quantify what that time might be.
The period of the past decade has been dominated by the mass marketing of mobile Internet services, and the Internet’s growth rates for 2014 through 2016 perhaps might have been the highest so far recorded. This would’ve been visible in the IP address deployment data were it not for the exhaustion of the IPv4 address pool.
In address terms, this growth in the IPv4 Internet is being almost completely masked by the use of Carrier Grade NATs in the mobile service provider environment, so the resultant demands for public addresses in IPv4 are quite low and the real underlying growth rates in the network are occluded by these NATs. In IPv6, the extremely large size of the address space masks out much of this volume. A single IPv6 /20 allocation to an ISP allows for 268 million /48 allocations or 68 billion /56 allocations, so much of the growth in IPv6-using networks is simply hidden behind the massive address plan that lies behind IPv6.
It has also been assumed that we should see IPv6 address demands for deployments of large-scale sensor networks and other forms of deployments that are encompassed under the broad umbrella of the Internet of Things. This does not necessarily imply that the deployment is merely a product of an over-hyped industry, although that is always a possibility. It is more likely to assume that, so far, such deployments are taking place using private IPv4 addresses, and they rely on NATs and application-level gateways to interface with the public network. Time and time again we are lectured that NATs are not good security devices, but in practice, NATs offer a reasonable front-line defence against network scanning malware, so there may be a larger story behind the use of NATs and device-based networks than just a simple conservative preference to continue to use an IPv4 protocol stack.
More generally, we are witnessing an industry that is no longer using technical innovation, openness, and diversification as its primary means of propulsion. The widespread use of NATs in IPv4 limits the technical substrate of the Internet to a very restricted model of simple client/server interactions using TCP and UDP. The use of NATs forces the interactions into client-initiated transactions, and the model of an open network with considerable flexibility in the way in which communications take place is no longer being sustained in today’s network. Incumbents are entrenching their position while innovation and entrepreneurialism are taking a back seat as we sit out this protracted IPv4 / IPv6 transition.
What is happening is that today’s Internet carriage service is provided by a smaller number of very large players, each of whom appears to be assuming a very strong position within their respective markets. The drivers for such larger players tend towards risk aversion, conservatism, and increased levels of control across their scope of operation. The same trends of market aggregation are now appearing in content provision, where a small number of content providers are exerting a completely dominant position across the entire Internet.
The evolving makeup of the Internet industry has quite profound implications in terms of network neutrality, the separation of functions of carriage and service provision, investment profiles and expectations of risk and returns on infrastructure investments, and the openness of the Internet itself.
Given the economies of volume in this industry, it was always going to be challenging to sustain an efficient, fully open, and competitive industry, but the degree of challenge in this agenda is multiplied many-fold when the underlying platform has run out of the basic currency of IP addresses. The pressures on the larger players within these markets to leverage their incumbency into overarching control gains traction when the stream of new entrants with competitive offerings dries up, and the solutions in such scenarios typically involve some form of public sector intervention directed to restore effective competition and revive the impetus for more efficient and effective offerings in the market.
As the Internet continues to evolve, it is no longer the technically innovative challenger pitted against venerable incumbents in the forms of the traditional industries of telephony, print newspapers, television entertainment and social interaction. The Internet is now the established norm. The days when the Internet was touted as a poster child of disruption in a deregulated space are long since over, and these days we appear to be increasingly looking further afield for a regulatory and governance framework that can challenge the increasing complacency of the newly established incumbents.
It is unclear how successful we will be in this search. We can but wait and see.
The views expressed by the authors of this blog are their own and do not necessarily reflect the views of APNIC. Please note a Code of Conduct applies to this blog.
Really good article.