

The distribution of Content Delivery Networks (CDN), cloud and content provider capacity across Internet Exchange Points (IXPs) provides a fascinating lens into the physical infrastructure of the Internet and public peering.
While hyperscalers and CDNs increasingly deploy private backbone infrastructure, public peering remains a critical mechanism for regional traffic distribution, cache efficiency, eyeball reach, and resilience.
This study aggregates the port capacity of ten of the most IXP-interconnected CDN, cloud and content networks and ranks IXPs by total capacity. This ranking provides insights into the choices made by the networks, on an individual basis but also collectively as a group of CDN, cloud and content providers with significant influence in the global interconnection ecosystem. The networks covered are Akamai, Meta, Amazon, Hurricane Electric, Cloudflare, Fastly, Microsoft, Google, Netflix and Bytedance.
The limitations of this analysis are obvious: Presence at exchanges could be incorrect, or port capacity could be out of date, for instance. However, most of the networks under analysis depend heavily on PeeringDB automation. This gives the report a relatively high level of confidence.
At a glance
The data highlights the enormous scale at which major CDNs, cloud, and content providers participate in public Internet exchange ecosystems globally. Sourced from PeeringDB, the table below ranks the networks with the largest deployed port capacity at IXPs, illustrating how deeply integrated these operators are within the global Internet infrastructure. It also shows the number of exchanges they participate in (IX count) and the number of ports (Port count).
| Autonomous System Number (ASN) | Name | IXP count | Port count | Port capacity (Tbps) |
| 20940 | Akamai | 248 | 381 | 79.0 |
| 32934 | Meta | 202 | 429 | 69.4 |
| 16509 | Amazon | 163 | 335 | 51.2 |
| 6939 | Hurricane | 333 | 334 | 50.2 |
| 13335 | Cloudflare | 352 | 413 | 47.2 |
| 54113 | Fastly | 150 | 275 | 46.2 |
| 8075 | Microsoft | 210 | 374 | 39.0 |
| 15169 | 179 | 322 | 29.9 | |
| 2906 | Netflix | 108 | 205 | 29.0 |
| 396986 | Bytedance | 95 | 170 | 23.3 |
Akamai leads with 79Tbps of deployed public peering capacity across 248 exchanges, reinforcing its long-standing strategy of distributing content as close as possible to end users. Meta follows closely with 69.4Tbps, despite being present at fewer exchanges, indicating a strategy focused on very high-capacity deployments at key metros. Amazon ranks third with 51.2Tbps, reflecting the growing importance of AWS and cloud-driven traffic flows at IXPs.
Cloudflare stands out as the most broadly connected network in the dataset, participating in 352 exchanges worldwide. In contrast, Hurricane Electric (the only non-CDN network in the benchmark) maintains the largest exchange footprint overall with connectivity to 333 IXPs. Fastly, Microsoft, Google, and Netflix also show substantial global peering presence, highlighting the continued importance of public interconnection for large-scale content delivery, cloud services, and traffic localization. Lastly, ByteDance shows its limited footprint but high capacity deployed.
Overall, the data demonstrates that public peering remains a critical component of their Internet architecture, even for hyperscale operators with extensive private backbone infrastructure.
Analysis: Global observations
The data reveals several notable geographic and strategic patterns.
The top three exchanges globally are not surprising — although their order may be. IX.br Sao Paulo, DE-CIX Frankfurt and Equinix Singapore are the exchanges with the largest deployed peering capacity. Note that Sao Paulo is also the exchange with the highest number of participants — 1,861 according to PeeringDB — and peak/average traffic of 31Tbps / 18Tbps according to their own statistics. DE-CIX Frankfurt is the largest European exchange by participant count (1,017 networks), and its peak/average traffic is 18Tbps/12Tbps. Finally, Equinix Singapore, with a more modest 465 participants, has peak/average traffic of 20Tbps/14Tbps.
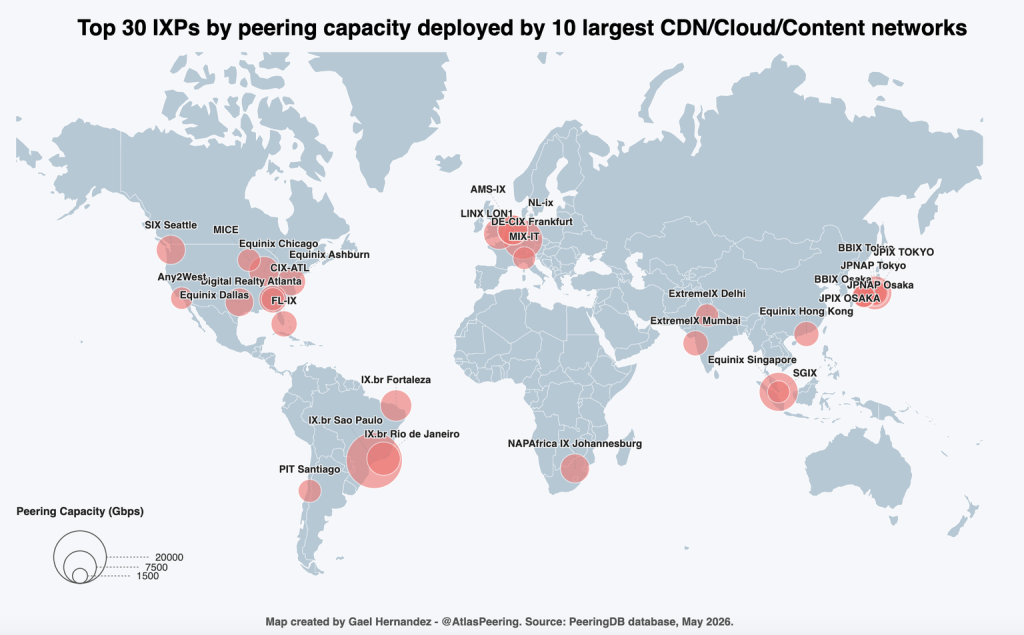
What stands out the most is the scale gap between the first and second-ranked exchanges: From 22.8Tbps down to 11Tbps, a drop of more than 50%. This suggests an exceptional level of traffic gravity and aggregation at the leading exchange, reinforcing the ‘winner-takes-most’ dynamics often observed in Internet interconnection ecosystems.
| Rank | IX Name | City | CC | Continent | IXP participants | Facilities count | Cloudflare AS13335 | Meta AS32934 | Akamai AS20904 | Microsoft AS8075 | Netflix AS2906 | Hurricane AS6939 | Amazon AS16509 | Fastly AS54113 | Google AS15169 | Bytedance AS396986 | Total IXP capacity |
| 1 | IX.br Sao Paulo | Sao Paulo | BR | South America | 1,861 | 31 | 1,400 | 6,400 | 3,100 | 400 | 2,400 | 300 | 1,600 | 1,800 | 3,000 | 2,400 | 22,800 |
| 2 | DE-CIX Frankfurt | Frankfurt | DE | Europe | 1,017 | 26 | 1,200 | 800 | 2,400 | 1,200 | 600 | 800 | 1,600 | 1,200 | 600 | 600 | 11,000 |
| 3 | Equinix Singapore | Singapore | SG | Asia Pacific | 465 | 5 | 1,600 | 800 | 1,500 | 600 | 400 | 1,000 | 1,000 | 3,200 | 400 | 400 | 10,900 |
| 4 | BBIX Tokyo | Tokyo | JP | Asia Pacific | 350 | 16 | 1,000 | 200 | 700 | 400 | 800 | 400 | 1,600 | 1,600 | 400 | 1,000 | 8,100 |
| 5 | IX.br Rio de Janeiro | Rio de Janeiro | BR | South America | 512 | 15 | 600 | 2,000 | 1,300 | 200 | 800 | 200 | 400 | 1,200 | 800 | 400 | 7,900 |
| 6 | IX.br Fortaleza | Fortaleza | BR | South America | 606 | 10 | 400 | 3,200 | 1,400 | 200 | 600 | 200 | 400 | 200 | 0 | 400 | 7,000 |
| 7 | LINX LON1 | London | GB | Europe | 844 | 18 | 600 | 400 | 1600 | 600 | 1,000 | 300 | 800 | 800 | 100 | 800 | 7,000 |
| 8 | AMS-IX | Amsterdam | NL | Europe | 859 | 17 | 1,000 | 800 | 700 | 800 | 200 | 400 | 1,200 | 800 | 400 | 200 | 6,500 |
| 9 | Equinix Chicago | Chicago | US | North America | 250 | 3 | 600 | 400 | 1,100 | 400 | 800 | 1,200 | 900 | 400 | 400 | 200 | 6,400 |
| 10 | NL-ix | Amsterdam* | NL | Europe | 527 | 83 | 600 | 800 | 1,700 | 600 | 0 | 400 | 800 | 1,100 | 200 | 0 | 6,200 |
| 11 | SIX Seattle | Seattle | US | North America | 373 | 15 | 800 | 400 | 800 | 400 | 600 | 800 | 1,400 | 400 | 200 | 200 | 6,000 |
| 12 | NAPAfrica IX Johannesburg | Johannesburg | ZA | Africa | 546 | 1 | 600 | 800 | 1,600 | 400 | 600 | 100 | 400 | 200 | 500 | 800 | 6,000 |
| 13 | Equinix Ashburn | Ashburn | US | North America | 343 | 3 | 400 | 200 | 800 | 400 | 800 | 900 | 1,200 | 600 | 200 | 200 | 5,700 |
| 14 | Equinix Dallas | Dallas | US | North America | 204 | 6 | 600 | 400 | 800 | 400 | 800 | 1100 | 800 | 400 | 200 | 200 | 5,700 |
| 15 | CIX-ATL | Atlanta | US | North America | 112 | 10 | 200 | 800 | 1200 | 200 | 400 | 400 | 1,600 | 200 | 200 | 200 | 5,400 |
| 16 | JPIX TOKYO | Tokyo | JP | Asia Pacific | 266 | 10 | 400 | 200 | 600 | 200 | 600 | 200 | 800 | 1,600 | 400 | 200 | 5,200 |
| 17 | FL-IX | Miami | US | North America | 196 | 13 | 200 | 800 | 800 | 200 | 600 | 800 | 800 | 200 | 200 | 200 | 4,800 |
| 18 | Extreme IX Mumbai | Mumbai | IN | Asia Pacific | 245 | 14 | 300 | 800 | 1,600 | 200 | 40 | 0 | 400 | 200 | 900 | 0 | 4440 |
| 19 | Equinix Hong Kong | Hong Kong | HK | Asia Pacific | 244 | 5 | 600 | 400 | 1,200 | 600 | 600 | 400 | 200 | 200 | 200 | 0 | 4,400 |
| 20 | JPNAP Tokyo | Tokyo | JP | Asia Pacific | 250 | 14 | 400 | 400 | 600 | 200 | 800 | 100 | 800 | 400 | 400 | 200 | 4,300 |
| 21 | BBIX Osaka | Osaka | JP | Asia Pacific | 126 | 11 | 200 | 200 | 200 | 200 | 400 | 100 | 800 | 1,200 | 200 | 600 | 4,100 |
| 22 | Digital Realty Atlanta | Atlanta | US | North America | 151 | 2 | 200 | 400 | 1,100 | 200 | 600 | 600 | 200 | 200 | 200 | 0 | 3,700 |
| 23 | PIT Santiago – PIT Chile | Santiago | CL | South America | 153 | 13 | 200 | 200 | 600 | 200 | 0 | 100 | 200 | 1,200 | 200 | 800 | 3,700 |
| 24 | Extreme IX Delhi | Delhi | IN | Asia Pacific | 176 | 13 | 200 | 1,200 | 1,100 | 200 | 40 | 0 | 200 | 200 | 500 | 0 | 3,640 |
| 25 | MIX-IT | Milan | IT | Europe | 394 | 13 | 400 | 400 | 900 | 200 | 200 | 200 | 200 | 600 | 400 | 100 | 3,600 |
| 26 | JPIX OSAKA | Osaka | JP | Asia Pacific | 111 | 8 | 400 | 200 | 300 | 200 | 600 | 100 | 600 | 800 | 200 | 200 | 3,600 |
| 27 | MICE | Minneapolis | US | North America | 147 | 5 | 100 | 800 | 900 | 400 | 400 | 400 | 200 | 400 | 0 | 0 | 3,600 |
| 28 | JPNAP Osaka | Osaka | JP | Asia Pacific | 102 | 11 | 200 | 400 | 200 | 200 | 800 | 100 | 800 | 400 | 200 | 200 | 3,500 |
| 29 | Any2West | LA and Silicon Valley | US | North America | 267 | 10 | 200 | 200 | 500 | 200 | 400 | 800 | 200 | 400 | 200 | 400 | 3,500 |
| 30 | SGIX | Singapore | SG | Asia Pacific | 252 | 16 | 200 | 200 | 1100 | 200 | 200 | 300 | 400 | 400 | 200 | 200 | 3,400 |
Table 2 — Top 30 IXP analysis in detail.
One of the more unexpected findings is the dominance of Brazil. Three Brazilian exchanges appear within the global top six, highlighting the maturity of Brazil’s domestic interconnection ecosystem and the success of IX.br in driving local traffic exchange at a massive scale. This reflects several structural advantages: A large domestic Internet population, strong local content consumption and an active public peering culture.
Another notable trend is the limited presence of commercial co-location-led exchanges in the top 30 list, with Equinix taking five positions in the global top 20 for exchanges in Singapore, Chicago, Ashburn, Dallas and Hong Kong. The only other IXP run by a co-location provider is Digital Realty Atlanta. This highlights the increasing convergence between data centre ecosystems and Internet exchange infrastructure. Large CDNs increasingly optimize deployment by co-locating peering, compute, caching, and cloud interconnection within the same metro facilities.
Despite regional differences, several exchanges have emerged as universally important aggregation hubs. Every CDN and content provider analysed is present in the following five exchanges:
These exchanges have effectively become mandatory interconnection points for global content distribution.
From a geographic perspective, the top 30 exchanges are distributed as follows:
- Europe: 5 exchanges in Frankfurt, London, Amsterdam (x2) and Milan.
- South America: 4 exchanges in Sao Paulo, Rio de Janeiro, Fortaleza and Santiago de Chile.
- Asia Pacific: 11 exchanges in Singapore (x2), Tokyo (x3), Mumbai, Hong Kong, Osaka (x3) and Delhi.
- North America: 9 exchanges in Chicago, Ashburn, Seattle, Dallas, Atlanta (x2), Miami, Minneapolis and Los Angeles/Silicon Valley.
- Africa: 1 exchange in Johannesburg.
The Asia Pacific region’s strong representation reflects both population scale and the fragmentation of the interconnection fabrics in key metro areas, notably Japan with six exchanges and Singapore with two.
Lastly, several operators demonstrate extremely broad deployment footprints. Cloudflare, Meta, Akamai, Microsoft, and Fastly are present in all top 30 exchanges, although their deployed capacities vary significantly by market and strategic priorities.
Europe
Europe’s rankings challenge some traditional assumptions about interconnection hierarchy.
Historically, European Internet infrastructure discussions often focused on the ‘FLAP’ markets: Frankfurt, London, Amsterdam and Paris. However, Paris does not appear among the leading four European exchanges in this dataset. Instead, NL-IX occupies the fourth position.
This is particularly interesting because NL-IX operates a highly distributed model spanning over eight economies, with more than 525 participants across 83 facilities in 12 cities throughout Europe. Its ranking suggests that distributed exchange architectures may increasingly complement — or partially substitute — the traditional single-metro exchange model.
The final European exchange appearing in the rankings is MIX-IT Milan, confirming Milan’s consolidation as a Southern European interconnection hub. One of the peculiarities of this exchange is that it also operates a data centre facility, MIX DC Caldera.
South America
South America’s rankings are heavily dominated by Brazil. The first — and only — non-Brazilian South American exchange in the rankings is PIT Chile in Santiago.
Brazil’s strong representation demonstrates how a coordinated national exchange strategy can materially influence Internet localization and content distribution economics. Meta’s deployment strategy is particularly notable:
- IX.br Sao Paulo aggregates 6.4Tbps of Meta IXP capacity
- IX.br Fortaleza follows with 3.2Tbps
- IX.br Rio de Janeiro reaches 2Tbps
These large numbers show how Meta is using public peering as the main delivery mechanism in Brazil, possibly unveiling the logistical and import complexities of the economy.
Fortaleza’s role is especially important given its position as a major submarine cable landing hub connecting South America, North America, Europe, and increasingly, Africa.
Asia Pacific
The Asia Pacific region contains the highest number of exchanges within the top 30 globally.
The leading exchanges are Equinix Singapore and BBIX Tokyo, followed by Equinix Hong Kong, JPNAP Tokyo and BBIX Osaka. This indicates the continued dominance of Singapore, Tokyo, and Hong Kong as regional interconnection capitals.
Interestingly, Japan supports multiple peering fabrics within the same metro area, reflecting both the scale and competitive diversity of the Japanese Internet ecosystem with three distinctive IXP families: JPNAP, BBIX and JPIX.
India also emerges as an increasingly important market. Extreme-IX Mumbai and Extreme-IX Delhi appear as the most popular interconnection platforms for CDN deployment in India.
This aligns with India’s rapid growth in Internet usage, video consumption, mobile broadband adoption, and hyperscale infrastructure investment.
Australian exchanges are absent, probably due to its population of 30 million (equivalent to Mumbai, for instance). Other reasons could be the choice of alternative architectures, such as deep-caches, due to Australia’s concentrated ISP market around Telstra, Vocus, Optus and TPG.
North America
North America presents an interesting contrast.
The highest-ranked North American exchange is Equinix Chicago, yet it only ranks 9th globally. This likely reflects the historical tendency in North America toward private interconnection and bilateral peering rather than concentration around large public exchanges.
Nevertheless, North America remains strongly represented overall, with six exchanges appearing within the global top 20.
An especially notable finding is the presence of three community-driven exchanges among the leading North American platforms: SIX Seattle, CIX Atlanta and FL-IX Miami. Their rankings demonstrate that carrier-neutral and community-oriented interconnection models continue to play an important role even within highly commercialized Internet markets.
Canada is also absent from the global top 30 due to its limited Internet user population. The first Canadian exchange, TorIX, appears as 31st and most likely because of US networks peering there. This reflects a stronger dependence on US interconnection ecosystems as well as a lower domestic market scale or a greater use of private interconnection models.
Africa
Africa remains comparatively underrepresented. NAPAfrica Johannesburg is the only African exchange in the top 30, ranking 12th globally. While this demonstrates Johannesburg’s role as the continent’s primary digital hub, it also illustrates the broader gap in interconnection density between Africa and other regions. The second African hub is IXPN Lagos in Nigeria, back in 60th place.
Final thoughts
This study reinforces several broader conclusions about the evolution of the Internet to its current form.
First, public peering remains strategically important even in the hyperscale era. CDNs, cloud and content providers continue to invest heavily in public exchange connectivity as part of their ‘edge’ because IXPs provide efficient access to eyeball networks, lower latency paths, and regional traffic localization.
Second, geography still matters. The largest exchanges are concentrated in metros that combine:
- Dense fibre ecosystems
- Hyperscale data centres
- Submarine cable connectivity
- Large populations of Internet users
Finally, the rankings demonstrate that interconnection to the public Internet is no longer dominated exclusively by North American and European exchanges. Brazil, Singapore, Tokyo, Mumbai, and Johannesburg also serve as regional hubs of the global interconnection fabric.
Gael Hernandez is an experienced Internet interconnection strategist (IXP, CDN, transit, peering, edge and caching, policy and regulatory) with a passion for understanding markets, perspectives and people. He is an independent consultant at Atlas Peering and Admin Committee member at PeeringDB.
Originally Published at RIPE Labs.
The views expressed by the authors of this blog are their own and do not necessarily reflect the views of APNIC. Please note a Code of Conduct applies to this blog.