

This is a topic I looked at in November 2022, and I would like to return to it here to see if anything has changed in the landscape of the DNS. Is centrality in the DNS largely unchanged, or have aspects of this activity become even more centralized today as compared to four years ago?
The Internet’s Domain Name System (DNS) undertakes a vitally important role in today’s Internet. Originally conceived as a human-friendly way of specifying the location of the other end of an Internet transaction, it became the name of a service point during the Internet’s transition to a client/server architecture. A domain name still pointed to an IP address, but the strict one-to-one relationship began to weaken as changes were introduced to address IPv4 address pool depletion. The address space is now highly fragmented and chaotic, and the namespace provides the essential common referential framework that defines the Internet itself.
Indeed, it has been argued that today the Internet runs on names, where IP addresses serve an ephemeral role as routing locators to aid packet transmission. These days, it’s names that serve as stable endpoint identifiers, act as the main way of assuring clients as to the authenticity of service transactions, and are the foundation of a single common referential framework that defines the Internet. DNS centrality is the most vital topic in any conversation about centralization of Internet infrastructure.
The Internet was a product of progressive deregulation of public telephony. Telephone companies were often run under a framework of regulated monopolies operating largely as public sector entities, constrained by terms of trade and technology evolution. The Internet replaced those conditions with a framework of diverse private sector operations, using the rigour of competition to ensure that the market for telecommunications services was efficient and focused on the needs of users.
Market distortions can give some actors unfair advantages over others. Identifying and correcting these distortions is typically the responsibility of public-sector regulators, who are empowered to address them.
This is important in any market-based activity sector, but is particularly important and challenging when we consider the Internet as a global market. Defining appropriate governance measures in this international space can pose unique issues and solutions. For example, the European Union (EU) has established a robust framework for regulatory penalties that can be calculated based on a company’s total worldwide turnover rather than just EU-specific earnings. These penalties are designed to provide adequate motivation for compliance with EU regulations across sectors, particularly for large multinational enterprises.
The Internet has been prone to market distortions caused by ‘early-comer advantage’ — where one, or a small group, of early entrants into a market sector become completely dominant to the extent that there is no effective competition, and no possibility of admitting additional market entrants. This form of market dominance is often termed ‘centrality’. A good example is Internet search, where Google’s search engine quickly assumed a position of global dominance, which it was able to maintain for decades. We are seeing the same issue in the AI space at present, where several large companies are rapidly investing in an effort to establish longer-term dominance and shut out all future competition.
However, to focus this narrative, the question here is: Is the DNS centralized?
The reason why this is a vitally important question lies in aspects of DNS history.
The early days of the DNS started with a naming system that had a small collection of top-level domains, namely .com, .net, .org, .gov, .edu and .mil. The first wave of expansion of this naming system was through the adoption of the two-letter CCs as Top-Level Domains (TLDs). The Internet Assigned Numbers Authority (IANA), which at the time was synonymous with Jon Postel, would delegate a CC to an entity from the economy in question who applied. If all this sounds a little informal, then you need to bear in mind that we were still telling ourselves that the Internet was just an experiment and, sooner or later, some adults would come along and replace all these ad hoc arrangements with adult stuff.
But the adults never came, and the Internet continued to gather momentum, and this momentum created more work for the folk running the common infrastructure, including the names registry. While diversifying across other economies alleviated some of the pressure on the name registry, other problems were created. The US Department of Defense was unwilling to continue to fund Internet infrastructure support, and the role was passed over to other US federal agencies. The National Science Foundation (NSF) created the Internet Network Information Center, known as InterNIC, to extend and coordinate directory and database services and information services and provide registration services for non-military Internet participants. NSF awarded the contract to manage InterNIC to three organizations and Network Solutions provided domain name registration services.
The services quickly scaled beyond the NSF funding levels, and Network Solutions sought clearance from the NSF to charge a fee for the service, which was levied (as I recall) at USD 75 per name per year. This was intended to create a fund to support the operation of common infrastructure services, but it was established that this represented a form of unofficial taxation that was not permissible. The resolution of this was to allow Network Solutions to retain the revenue from these name registration fees. This windfall revenue was not without its aspects of controversy, and much effort was put into diluting the de facto monopoly of the .com, .net and .org name registration service.
The chosen approach was to create competition in the space. Firstly, by creating new generic Top-Level Domains (gTLDs) to open up choices for name applicants, and secondly, by breaking up the name management infrastructure by allowing multiple registrars to act on behalf of end customers and place names into TLD registries.
The intent was largely a statement of faith in basic economic theory that effective competition in a commodity market cures many ills! And when competition fails, including the emergence of scenarios of consolidation and centrality, then we all have a problem.
For this reason, the question of centrality in the DNS remains a critical question.
‘Is the DNS centralized?’ might seem an odd question, in that by design, the DNS is a highly decentralized database that has distributed its contents over much of the Internet already. The DNS information model includes replication of information (in the form of secondary authoritative services) that are intended to address resiliency and scalability issues by removing critical single points of vulnerability within the distributed information structure.
The DNS query protocol also allows various forms of query fallback to increase the robustness of name resolution. And finally, recursive name resolvers include caching to maintain a store of cached information close to the client-edge. All of this sounds like a highly diverse distributed model of information management that would appear to resist any form of consolidation or centralization. But is this really the case? Let’s look at what we can measure in the DNS environment and try to provide some data to answer this question.
Market centrality metrics
Firstly, let’s look at four metrics that can be used to describe market centrality and the related topic of market dominance:
- The Australian Consumer and Competition Commission (ACCC) uses a metric of a single entity holding more than 70% of a market as an indicator of market dominance (and is used as a threshold for intervention by the ACCC where it believes that abuse of market power is taking place). In the UK, the legal definition of a monopoly is a firm with more than 25% market share.
- A slightly different metric is the four-firm concentration ratio, which measures the combined market share of the four largest suppliers in the market. It could easily be the top three or the top five, but the behaviour that is identified is an existing power group. If this measure rises above 50%, then there is some justification for concern about market distortion.
- The Herfindahl–Hirschman index (HHI) is used in market analysis to indicate the level of competition between market entities. HHI is calculated by squaring the market share of each competing firm in the industry and then summing the resulting numbers (sometimes limited to the 50 largest firms). The result is proportional to the average market share, weighted by market share. An HHI value above 25% is often taken as an indicator of market skew, and a value above 10% would be considered as a market showing ‘moderate concentration’.
The DNS name registration market
I’m using the data published by the Domain Name Stat service, and in particular, the statistics for market share for the domain name registrars. According to this source, there are 307 such registrars, and here we will look at the number of registered domains as an indicator of their market share.
It is challenging to compare the relative market weight of a registrar that holds the registration of a million obscure names that are never used with a registrar that holds the records of a very small set of the most highly used DNS names. However, in this case, we will not attempt to weight name registrations by their level of use and look at the simple count of registered names managed by each registrar.
The top five registrars are shown in Table 1.
| Registrar | Name count | Share |
| GoDaddy.com | 92,266,924 | 10.87% |
| NameCheap | 31,122,717 | 3.67% |
| Twocows Domains | 13,930,825 | 1.64% |
| GMO | 12,816,523 | 1.51% |
| Dynadot | 12,691,014 | 1.50% |
The largest provider, GoDaddy, has a 10.87% share of registered names, which fails to meet a conventional market dominance threshold.
The three, four and five firm concentration numbers are 16%, 18% and 19% respectively. This does not justify any concerns regarding market centralization using the four-firm concentration model.
The HHI index is 1.5%, which is consistent with this view that the DNS name registration market is not showing signs of concentration.
The DNS resolution market
I’d like to move on to a very specific part of the DNS environment and look at centrality in the resolution of DNS names. There are several related issues in the registry market. However, because each registry typically manages a single TLD, a registry’s market share largely reflects how popular its TLD is as a namespace.
With these caveats in mind, let’s look at DNS resolution as a market and use these measurements to assess the degree of concentration in the supply of DNS name resolution services.
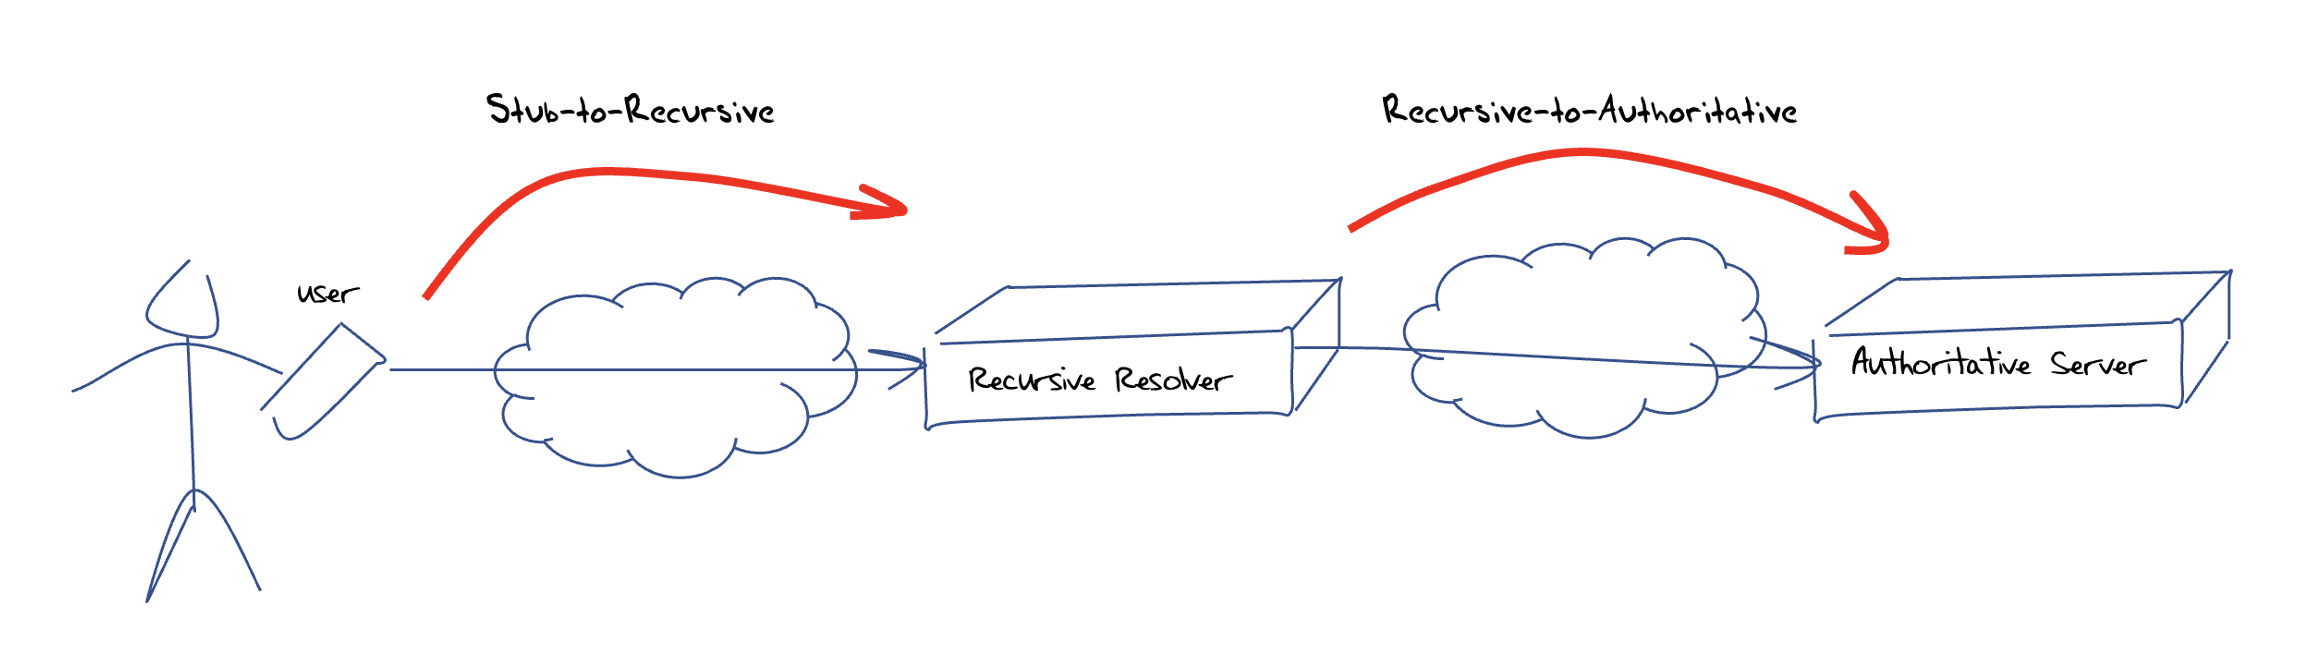
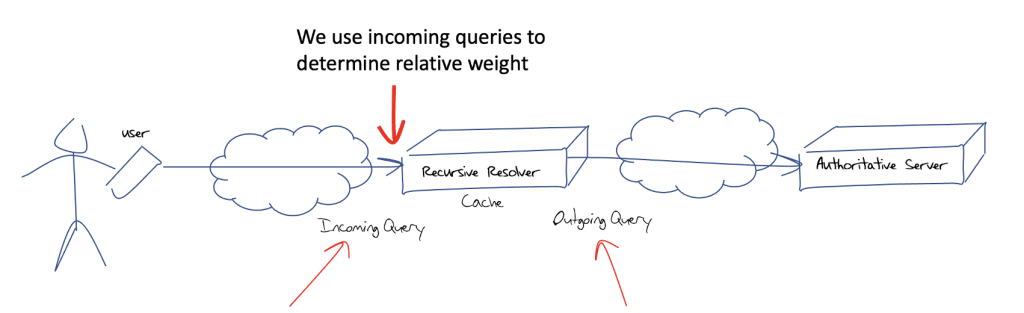
When a user’s application wishes to resolve a DNS name, the local DNS agent (the stub resolver) will pass the query to a pre-configured recursive resolver. The recursive resolver will then perform a series of queries to various authoritative servers to discover the appropriate server that is authoritative for the DNS name that is being resolved, followed by the actual query for the domain name. When it has assembled the DNS response, it will pass it back to the stub resolver. So, in general, there are two distinct steps in DNS name resolution, stub-to-recursive and recursive-to-authoritative (Figure 1).
How should we assess the market share (and potential market concentration) of these two steps in DNS name resolution?
For the stub-to-recursive analysis, it’s not the name itself that matters, as recursive resolvers are meant to provide resolution for all names. So, we need to look at a metric of use or dependency. This could be the query counts being presented to each recursive resolver, or even the number of distinct users (or distinct stub resolvers) that use the services of each recursive resolver.
This comparative metric of a resolver’s client population does not apply to authoritative servers, as, in theory, every authoritative server could be queried by any recursive resolver on behalf of any user. Perhaps a query count per authoritative server would make more sense, in that a highly popular name would be equivalent in many ways to a large count of seldomly used names. If we are looking at the market concentration of authoritative server providers, then the names themselves are not as important as the server operator, so we probably need a way to associate an authoritative server with a provider and look at the query counts for each provider.
Concentration in the recursive resolver market
For this part of the study, we would like to understand the distribution of users per recursive resolver. This is, of course, a challenging question and the approach we’ve used to answer this question is to use a sampling technique. At APNIC Labs, we’ve used online advertisements (ads) to distribute a measurement script to millions of distinct users per day. Each invocation of the script generates a unique DNS name to resolve, and the name is uniquely served by our nameservers. By looking at the logs from the authoritative server, we can associate a recursive resolver with each user that ran the test, and aggregate the data to generate the relative user population served by each recursive resolver (Figure 2).
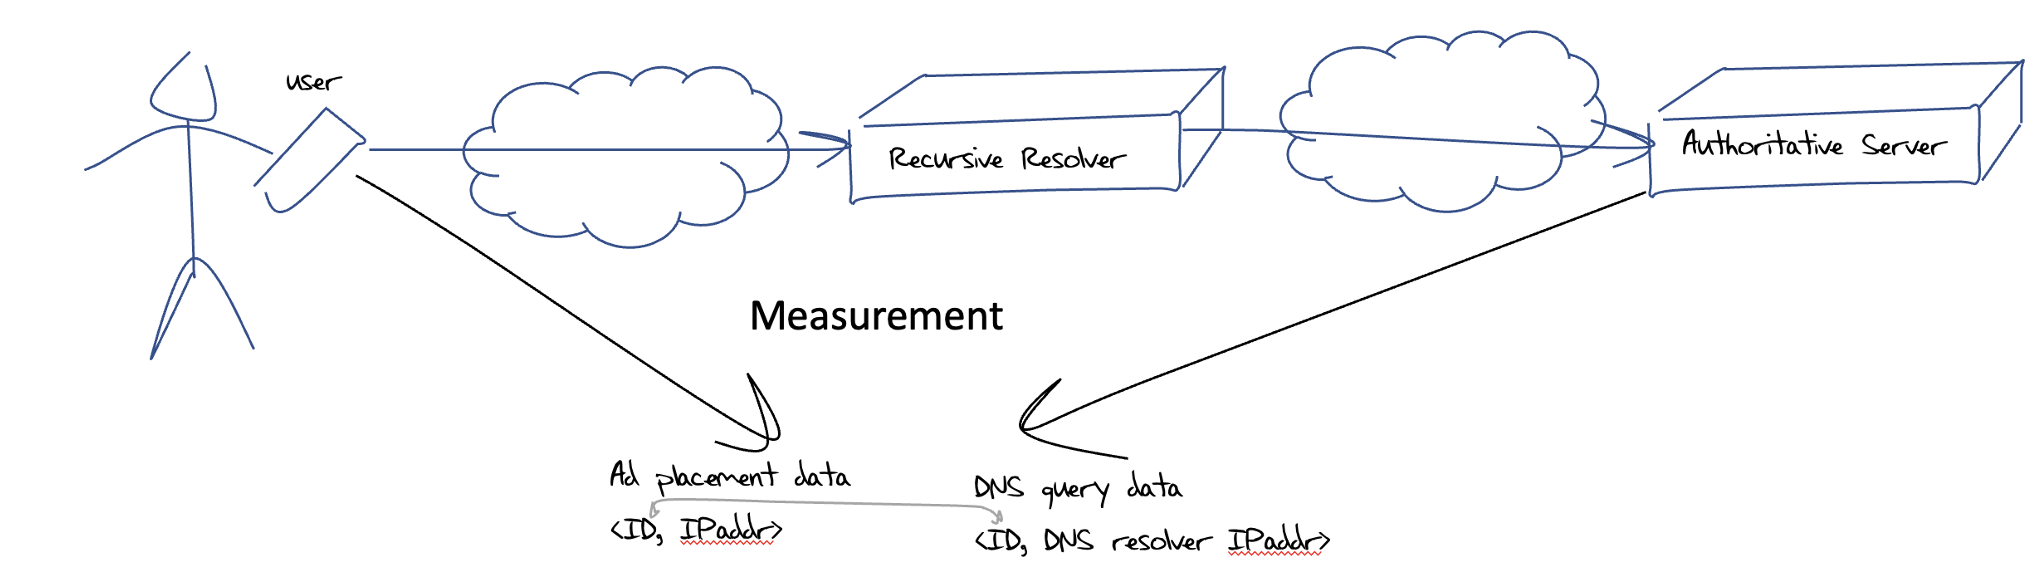
We need to map the resolver’s helper IP addresses — seen by our authoritative server — to a resolver service. To do this, we need to map the various back-end DNS engine IP addresses to the front-side recursive resolver service. RIPE Atlas helped in cases where the open resolver operator does not publish this information.
We then map resolvers into several categories based on the resolver’s IP address. The categories we use are:
- Resolver is in the same Autonomous System (AS) as the end user (ISP’s recursive resolver) (sameas).
- It’s a known Open DNS resolver (open).
- Resolver address is geo-located to the same CC as the end user (samecc).
- Resolver address is geo-located to a different CC from the end user (diffcc).
The results of this measurement for 2025 to 2026 are shown in Figure 3.
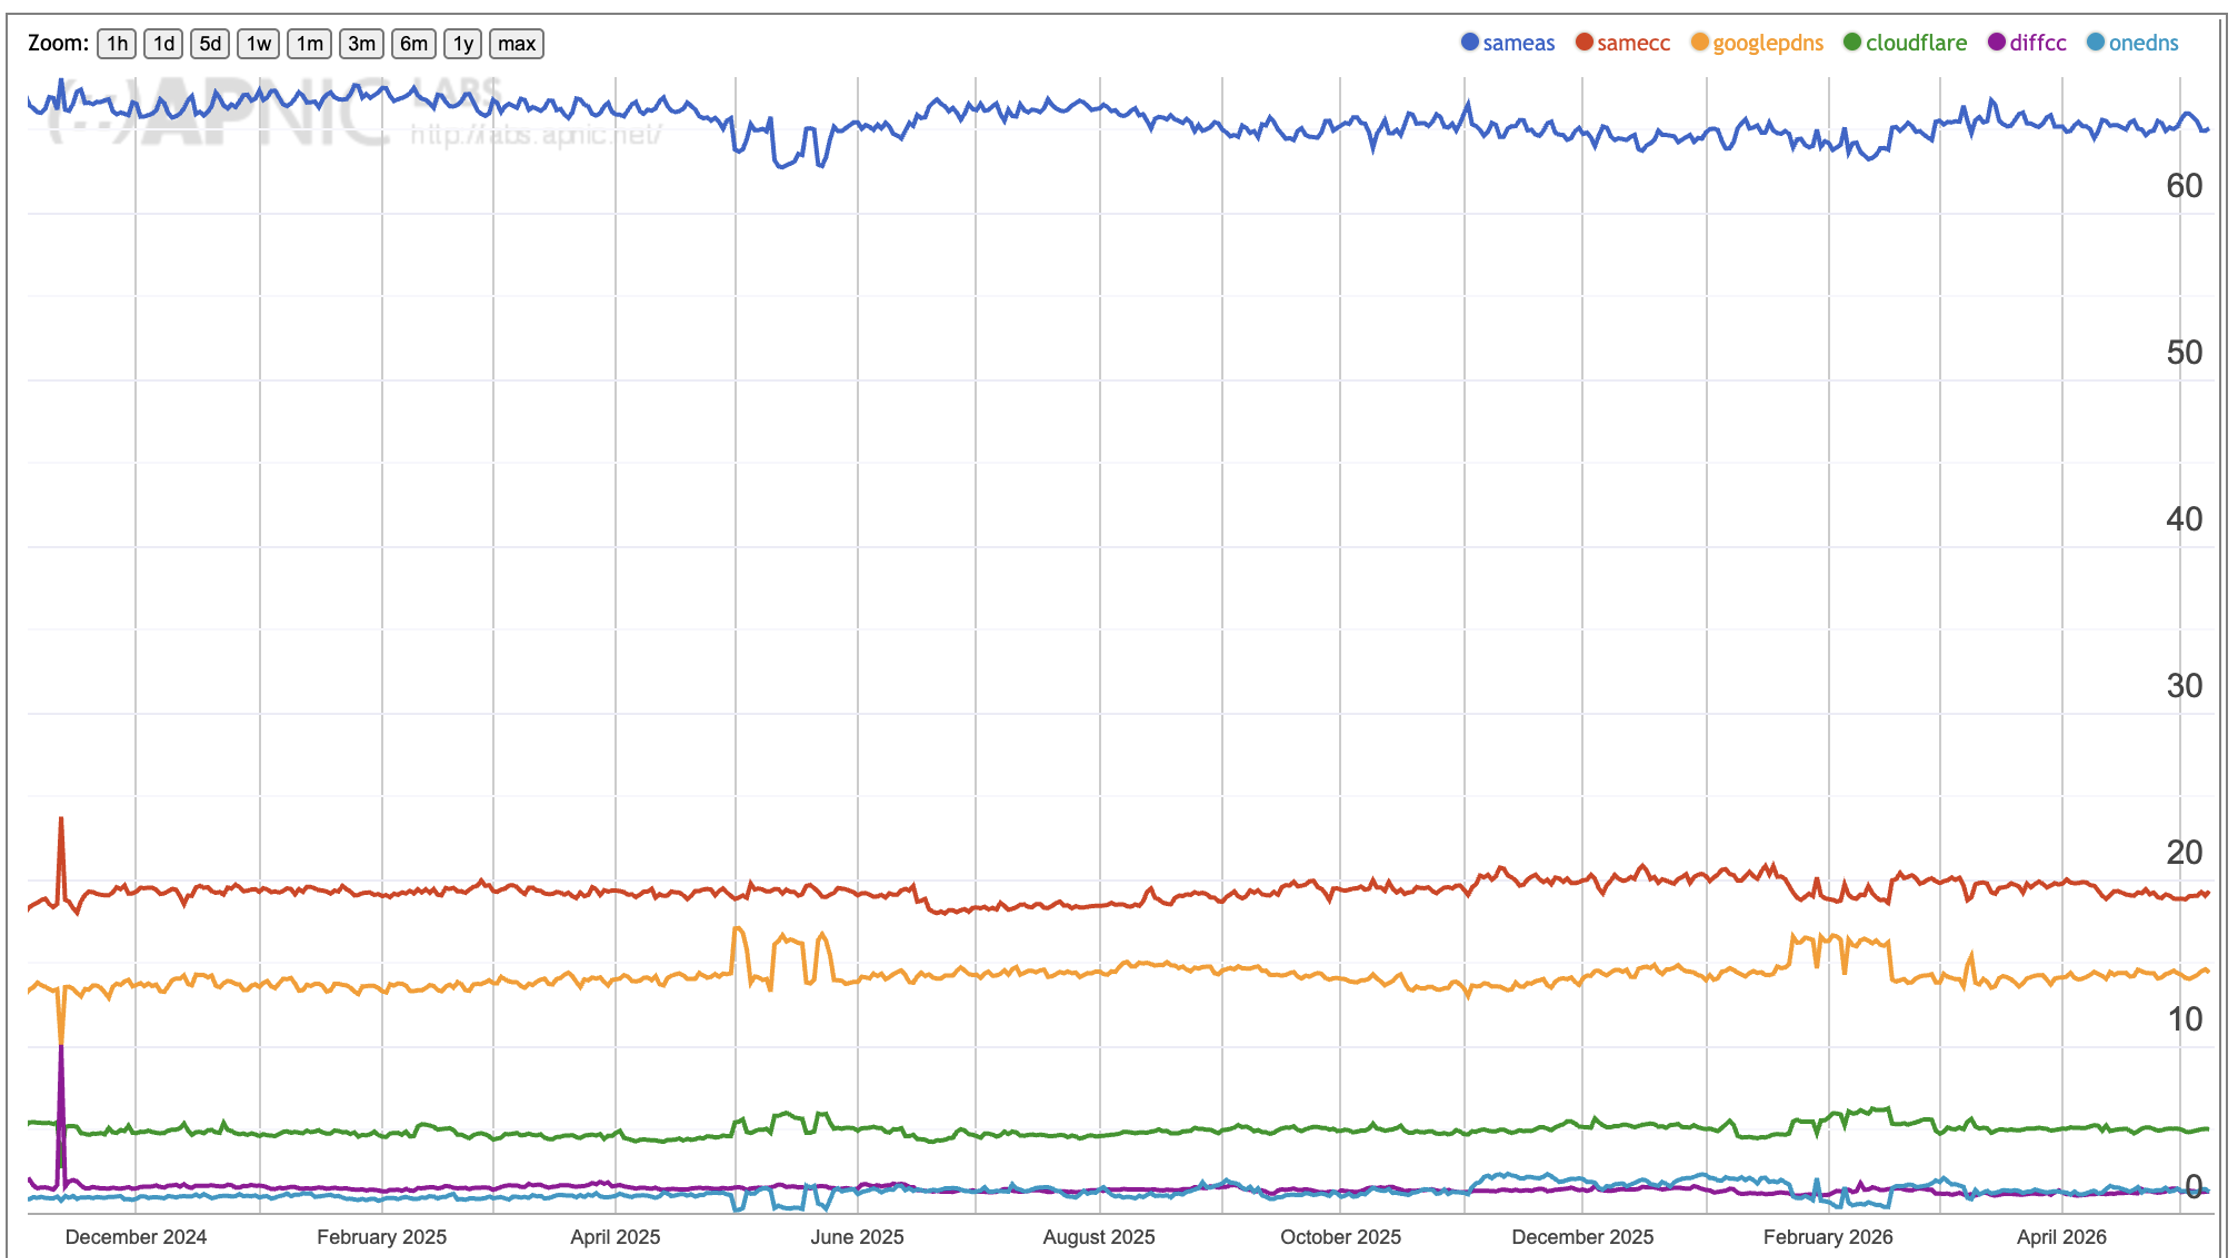
The current resolver use profile is shown in Table 1. Two-thirds of users direct their queries to the recursive resolver that is operated by their ISP, and 15% of users direct their queries to a recursive resolver that is geolocated in the same economy as they are, which is likely to be their ISP using a recursive resolver in a different AS. A total of 14.0% of users have their queries resolved by Google’s Public DNS resolver, 3.2% of users use Cloudflare’s DNS resolution service, and no other open DNS provider has a share of more than 0.5% of users.
| Resolver | User share, 2022 | User share, 2026 | Change |
| sameas | 65.0% | 65.2% | +0.2% |
| samecc | 15.1% | 19.1% | +4.0% |
| diffcc | 0.5% | 1.3% | +0.7% |
| All Open Resolvers | 20.0% | 21.7% | +1.7% |
| Google Public DNS | 14.0% | 14.4% | +0.4% |
| Cloudflare 1.1.1.1 | 3.2% | 5.1% | +1.9% |
| OneDNS (China) | 0.5% | 1.4% | +0.9% |
| OpenDNS | 0.5% | 0.8% | +0.3% |
| DNSPAI (China) | 0.4% | 1.2% | +0.8% |
| Level3 | 0.5% | 0.2% | -0.3% |
| 114DNS (China) | 0.2% | 0.4% | +0.2% |
| DNS4eu | – | 0.1% | +0.1% |
| Quad9 | 0.05% | 0.2% | +1.5% |
All the open resolvers collectively have 21.7% of the market share of DNS resolution. We can map this data into a relative market share in each economy, looking at the relative importance of open DNS resolver services per economy. This distribution is shown in Figure 4.
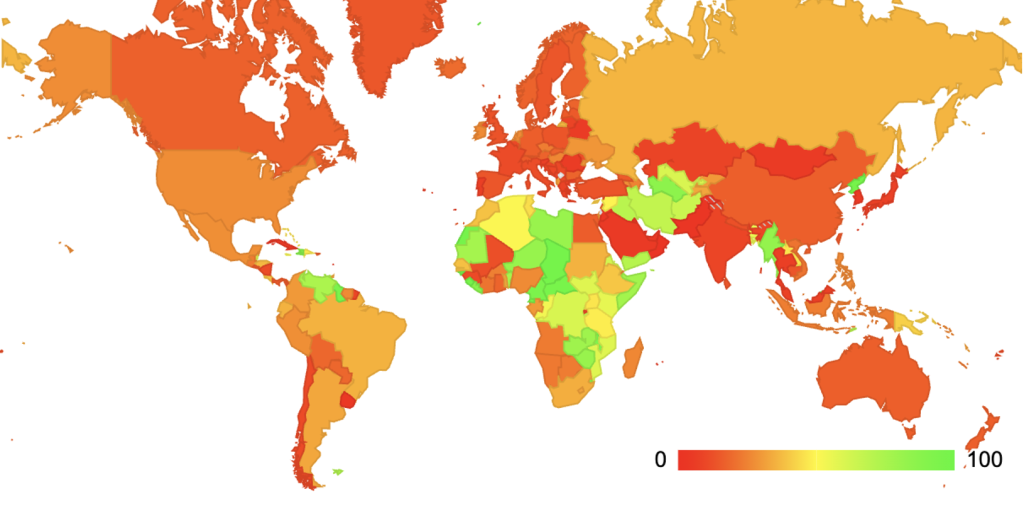
This per-economy data indicates that open DNS recursive resolvers are used as the dominant form of DNS resolution in some African economies, Guyana, Myanmar, Afghanistan and Turkmenistan. We can observe that open recursive resolvers are not the dominant provider in most economies, other than in Africa and a small collection of Central Asian economies.
However, we also observe from Table 1 that the use of Google’s service is three times larger in terms of market share than the next-largest open DNS recursive resolver provider (Cloudflare), so it is useful to take the same per-economy perspective and apply it to the use of Google’s public DNS service. This distribution is shown in Figure 5.
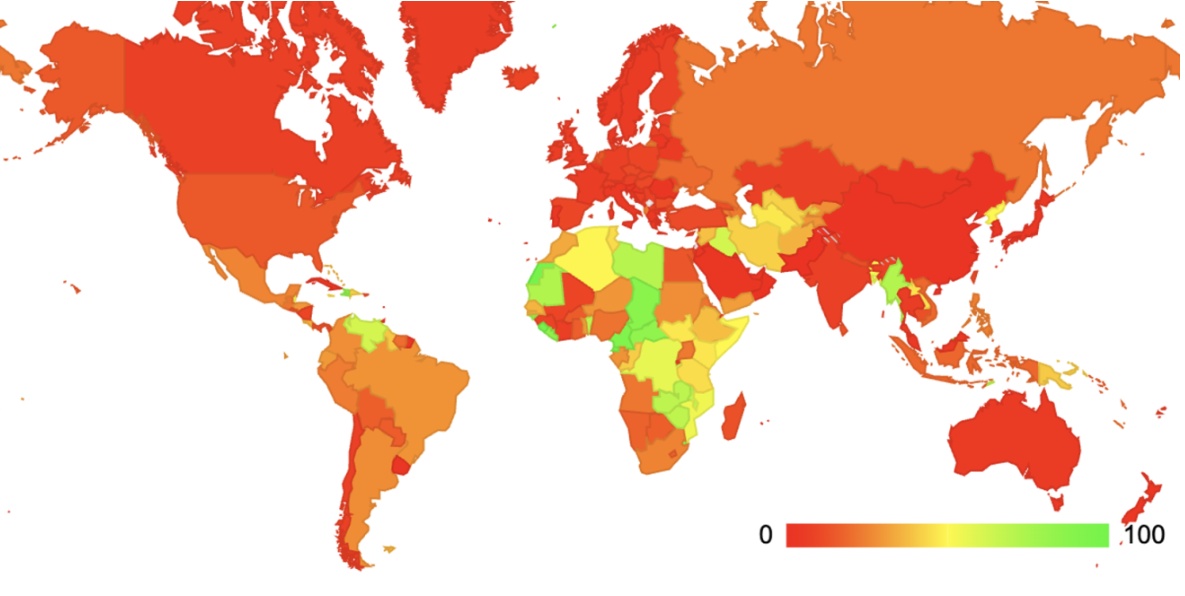
The two distributions are somewhat similar, with the dominant use of Google’s service in parts of central and eastern Africa and Afghanistan. We can invert the question and look at this from the perspective of Google’s public DNS service by looking at the distribution of users who use this service (Figure 6).
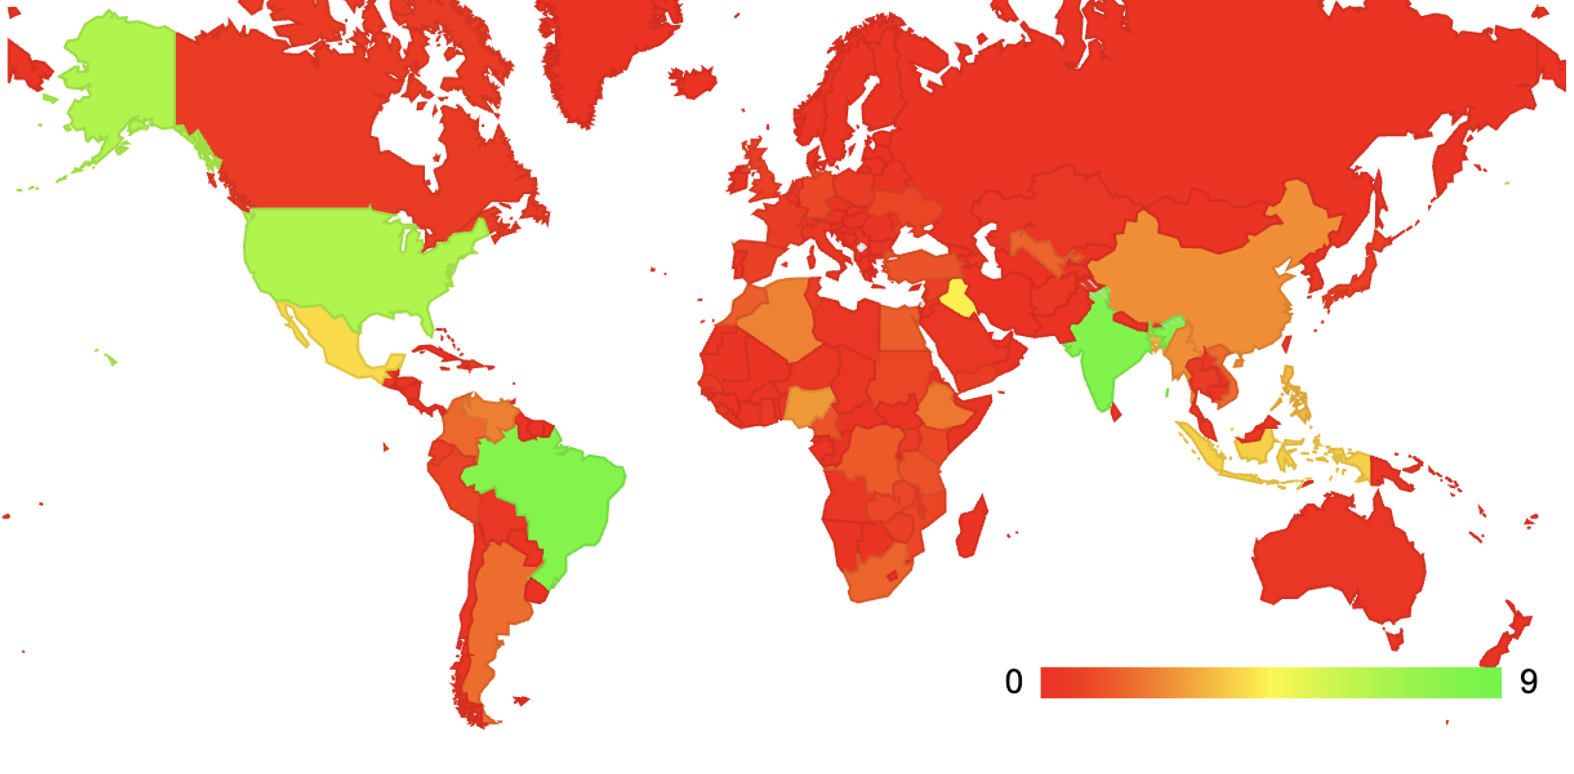
Here, the large user populations of India and Brazil come into play. 8% of all Google PDNS users are in India, 8% are in Brazil, and 7% in the US. Within these markets, Google is not dominant in any of them.
Given that the use of ISP-provided recursive resolution occurs for between 65% to 80% of users (depending on the attribution of the samecc resolver category, which is the same economy but different AS), and the known open resolvers have a 20% market share, then Google is not the dominant recursive resolver service provider in most markets. The HHI of the open resolvers as a subset of the DNS recursive resolution market is 4%, and Google’s HHI position is 2%.
Is this recursive resolver market centralized?
No.
What if we constrain our view to look only at the open DNS resolvers, and omit the DNS services operated by an ISP for their user base?
The Open Resolver market space:
- Single Entity Dominance: Google has 68.7% of the open DNS resolver market
- Four-Firm Concentration: Google, Cloudflare, 114DNS and OpenDNS have 91.6% market share
- HHI Index: 49%
If we constrain our view to just the open resolver market sector, we observe a highly centralized environment, with Google having a controlling (or dominant) position.
Caveats and comments
There are some caveats to these results based on the nature of the DNS and the nature of the users that are being measured.
What is being measured here?
When a stub resolver generates a query to the DNS, it is common for two or more recursive resolvers to be passed the query. In our measurements, the client stub resolver passes the original query to two or more recursive resolvers 60% of the time.
There is a difference between using:
- The identity of the first resolver to ask the query, which is the resolver that presumably is the first to provide a response to the user, and is therefore the resolver that the user ‘believes’.
- The collection of resolvers that ‘see’ the query from the user, which can be considered as the set of resolvers that can observe the user’s DNS activity.
The figures presented here relate to the set of recursive resolvers that ‘see’ the original query.
When we look at the first resolver to ask the DNS query (the recursive resolver the user ‘believes’), Google’s market share jumps from 14% to 17%, most likely due to Google’s superior performance, which is probably related to the relative density of Google’s cloud platform.
There is a second effect that we cannot easily measure in this form of experiment. In the DNS resolution environment, caching matters. A DNS recursive resolver with a large user base will tend to outperform a resolver with a smaller user base, assuming that the cache is enough to hold the data for the Time to Live (TTL) in all cases.
However, this observation is qualified by the way in which very large, anycast-based DNS recursive resolvers are constructed. If the service is built upon a set of largely independent small DNS resolution engines, then there is no benefit to be derived from the large user population for the compound service. If a compound service uses a common front end with a cache, then caching does have a positive effect on the service.
Who are we measuring?
In a broad-based sampling experiment that we operate in APNIC Labs, we have a relatively broad collection of end user points. These include both end users in retail ISPs, enterprise networks, and other networks that are not so readily classified. A look at the day-by-day detail in Figure 4 shows pronounced peaks in relative usage levels on weekends, while the opposite profile applies for Google’s service, which shows weekday peaks.
It brings into question the intent of this measurement. If the intent of the measurement is a consumer measurement, then we will need to filter the results to look only at consumer networks. The use of third-party open recursive resolvers is far higher in enterprise-service networks, while mass market consumer networks tend to rely heavily on the ISP-provided infrastructure. So, the measurements related to centrality provided above relate to industry-wide measurements and do not reflect the consumer market sector, the enterprise sector, or any other specialized service sector.
In addition, we see the increasing use of user privacy measures, such as Apple’s Private Relay data service, which are intended to obscure the identity and location of the user.
Authoritative nameservers
Now let’s turn our attention to the authoritative server side of DNS name resolution, looking for data that provides some indication of the level of concentration in the market to provide authoritative servers for DNS names.
This is a very different environment from the stub-to-recursive environment.
Here, we cannot see users, nor are we able to derive general recursive-to-authoritative queries profiles from the query data from individual authoritative servers. What we would like to measure is the relative query load presented to each authoritative service provider, and assess market centrality based on these query proportions.
The best place to obtain recursive-to-authoritative query profile data is from the recursive resolvers. But this is easier said than done. Recursive resolvers sit in a privileged position in the DNS, as they are exposed to both the identity of the stub resolver (the ‘user’) and the DNS names that they are querying, so it is perfectly reasonable that access to such recursive resolver data is extremely uncommon and typically comes with limitations.
At APNIC, we have limited access to the data relating to the use of the 1.1.1.1 recursive resolver under the terms of a collaborative research agreement with Cloudflare. In this case, we do not necessarily know who is querying, but we are given the query name that is being presented to the Cloudflare resolver system. This is pre-cache query data, in that it’s not the queries that the recursive resolver makes to authoritative servers — which is essentially a record of local cache misses — but a record of the queries being passed to the recursive resolver for resolution. The market share of Cloudflare’s open resolver service is around 5% of users (Table 1), which is a non-trivial resolver in the open resolver set (ranked #2 in terms of market share of open resolvers, as already noted).
The analysis we use here to parse the query data is to find the closest nameserver for each query name. We are looking for the nameserver that will be used to provide the response to the query. This means resolving the NS records to follow the delegation chain and resolving CNAME and DNAME alias records on the way. We take the IP address of this nameserver and use the routing table to map this address into an origin AS, essentially locating the network operator of the server in question. If there are multiple nameservers for a domain, then we just use the first nameserver from the server list. We then resolve this nameserver name and take the first IP address for the nameserver. We then use the current routing table to map this IP address into an AS number (ASN) of the network that advertises this prefix.
In this measurement exercise, we intentionally discount the effects of local caching in the resolver. It’s not the actual query rate of the authoritative server that we are using for this metric, but the rate at which users are using responses from this server, whether or not they were generated from the resolver’s cached entry.
We are looking at the query-count weighted ranking of the DNS authoritative server providers. If an authoritative nameserver hosts a very popular domain name, then it’s likely that the query count will be high. If a service operator hosts a very large number of domains on its authoritative server infrastructure, then the query count may be high. In some ways, these two situations, a large volume of served names and serving a highly popular name, are routing equivalent in terms of ‘share’ of the authoritative server market. So, we will characterize the authoritative service hosting market participants by their query-based ‘market share’.
The measurement approach we used in this experiment was to take a 24-hour snapshot of queries that were presented to the Cloudflare resolver. We grouped the query names and then performed our own resolution of these names to find the ‘closest’ authoritative nameserver for the query name using a local resolution environment. Arbitrarily, we take the first nameserver name in the nameserver list. At this point, we discard the query names and concentrate on the nameservers. We then resolve the nameserver names to IP addresses and discard the nameserver names. Then we map the IP addresses to ASNs, discard the IP addresses, and group the query counts into ASNs and rank by query share.
Mapping query names to authoritative service providers
Let’s take the query name www.apnic.net. The first step is to find the closest nameserver:$ dig +short NS www.apnic.net
www.apnic.net.cdn.cloudflare.net.
This is a mapped domain name that points to a cloud service provided by Cloudflare. We query the cloud prefix to see if it is a delegated domain:$ dig +short NS cdn cloudflare.net.
This is not a delegated domain, so we move up a domain to find the nameservers for the next level up:$ dig +short NS cloudflare.net.
ns3.cloudflare.net.
ns4.cloudflare.net.
ns5.cloudflare.net.
ns1.cloudflare.net.
ns2.cloudflare.net.
Let’s take the first nameserver name and resolve it to an IP address:$ dig +short A ns3.cloudflare.net
108.162.198.252
Now let’s find the network ASN and AS name of the network that originates a route to this address prefix:$ dig +short TXT 108.162.198.252.ipasn.net
"108.162.198.252|IPv4|ADVERTISED|108.162.192.0/24|13335|Cloudflare,_Inc.|US|United_States_of_America|arin|108.162.192.0/18|assigned|2011-10-28|VLD|108.162.192.0/24|24|13335|ARIN"
In this case, the query name www.apnic.net maps to a name that is served by Cloudflare.
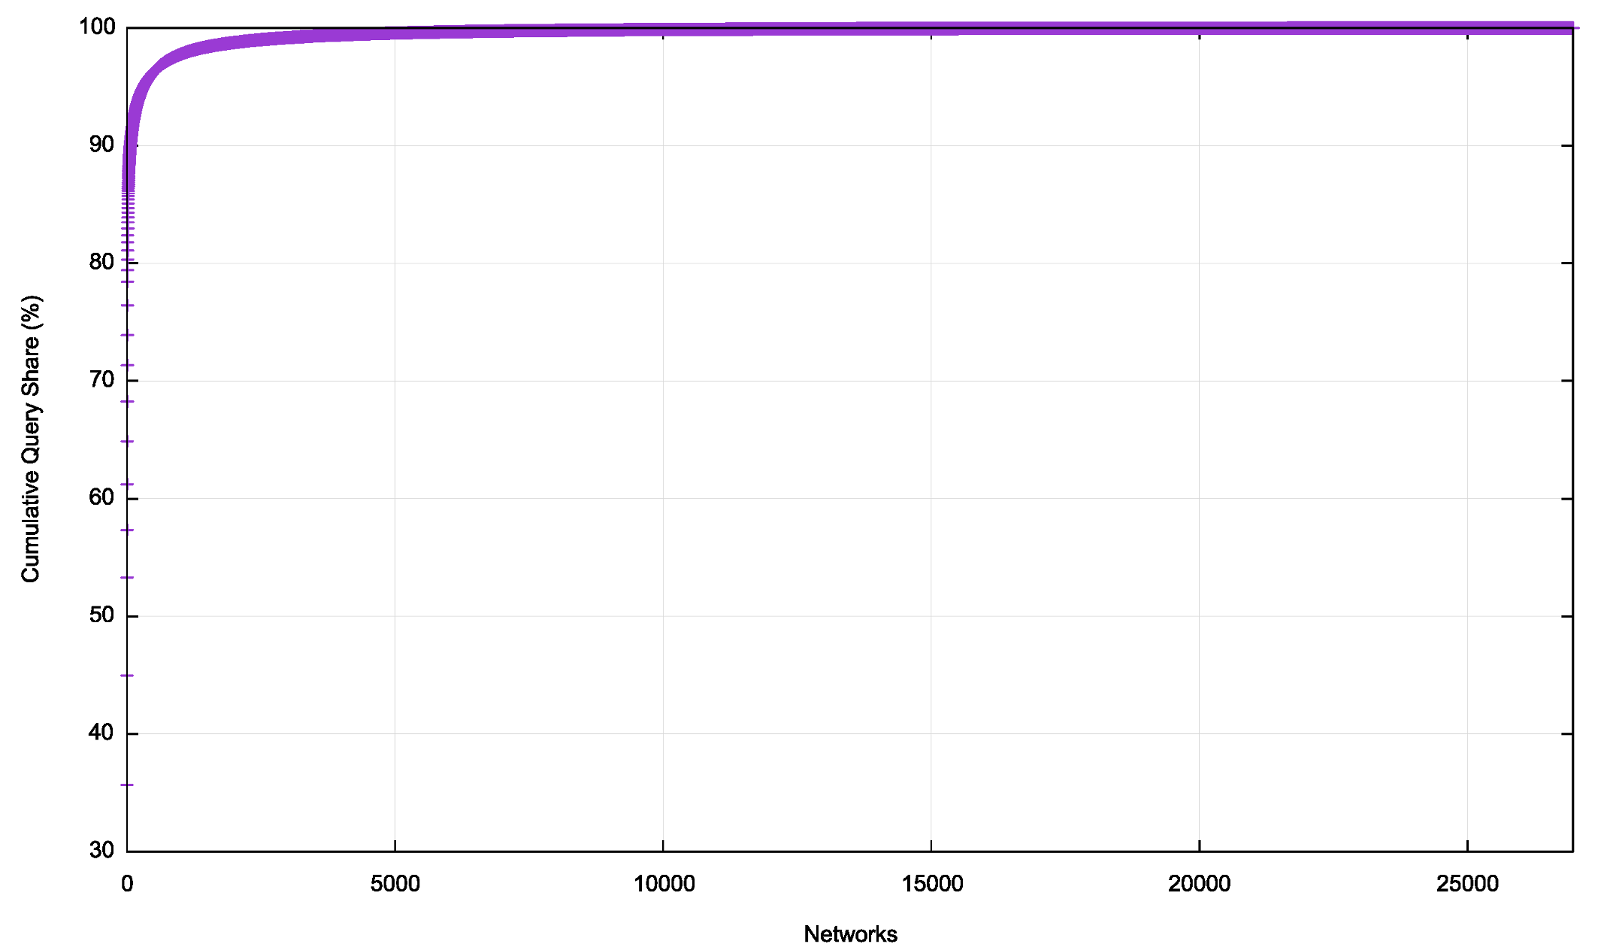
The 24-hour data capture in May 2026 identified 20,513 unique ASNs (out of a total of 79,000 unique ASNs in the routing table). While approximately one quarter of networks host at least one queried authoritative nameserver, the top 50 ASNs have 86% of the query share, a figure that appears to point to some level of consolidation in the nameserver domain.
A cumulative distribution plot bears out this indication of a high degree of centrality in this space (Figure 8).
The largest ten authoritative nameserver providers are listed in Table 2, ranked by Cloudflare’s relative query count.
| Rank | ASN | 2022 share | 2026 share | Name |
| 1 | AS16509 | 35.6% | 17.7% | Amazon, US |
| 2 | AS15169 | 8.3% | 14.6% | Google, US |
| 3 | AS13335 | 9.3% | 11.6% | Cloudflare, US |
| 4 | AS21342 | 4.0% | 8.2% | Akamai, US |
| 5 | AS32934 | – | 5.0% | Meta, US |
| 6 | AS8075 | 3.9% | 3.8% | Microsoft. US |
| 7 | AS714 | 3.4% | 2.2% | Apple, US |
| 8 | AS12008 | – | 1.5% | Registry Services, US |
| 9 | AS54113 | – | 1.4% | Fastly, US |
| 10 | AS396544 | – | 1.1% | VeriSign Global Registry Services, US |
Collectively, these ten DNS authoritative nameserver hosting services account for 67% of the total number of queried names in this data set. In 2022, the ten largest services accounted for 76% of queried names, so, to a small extent, the level of centrality has declined slightly, due primarily to a loss of share by Amazon.
Let’s look at the ‘market’ of DNS authoritative server providers using this query-weighted ranking:
- Single Entity Dominance: Amazon has 17.7% of the Authoritative server market.
- Four-firm concentration: Amazon, Google, Cloudflare, and Akamai have 52.1% market share.
- HHI index: 7% (was 15% in 2022).
The DNS authoritative server market appears to be close to market concentration, but this is only evident in the four-firm concentration metric.
In 2022, there was a clearer indication of market concentration here, predominantly due to Amazon hosting a significant proportion of heavily queried domain names. Amazon’s market share has halved in the intervening four years, and while Google, Cloudflare, Akamai and Meta have gained market share, there is a greater dispersal in the 2026 numbers across these service providers.
Caveats and comments
Geopolitical centrality
Ten network entities host the authoritative nameservers that have a query share of two-thirds of the recursive-to-authoritative DNS query volume. All of these ten networks are operated by US entities. CIRA, the registry service that operates the .CA domain for Canada is ranked 14, Tencent, which operates largely in the Chinese market (.CN) in ranked 15, and Yandex, which provides service in Russia, is ranked at 16th position.
The root question
About 2.5% of queries result in NXDOMAIN responses from the root zone. Yet the reports from the root server operators indicate that around 70% of queries seen at the root servers elicit NXDOMAIN responses.
This seems to be somewhat contradictory, but there are some additional considerations that may explain this. DNS queries that are seen at the root servers can be assumed to be queries from recursive resolvers and are the result of cache misses or cache expiration. It may be that the query volume seen by recursive resolvers is considerably greater than the query volume seen by the root servers, and the 2% of queries seen at recursive resolvers corresponds to 70% of the root server query volume.
Amazon and Route 53
The Amazon number, corresponding to servers in AS16509 is actually two sets of authoritative servers. Amazon has its own authoritative server service, Route 53, and in addition, many users use Amazon’s virtual servers to run their own authoritative servers. In this exercise, we’ve joined the two together as both platforms are operated by Amazon.
Limitations
This analysis is based on a single 24-hour data set from a single open recursive resolver service. The query sample set is not completely uniform, and there is a potential bias to enterprise use and some browser use. Using query volumes as a proxy for some form of market share is not a universally accepted analytic metric. So, while we might suspect that there is some skew in the data, there is no alternative source of information that would allow us to work on this suspected skew and compensate for it in some way.
Conclusions
Is the DNS resolution market centralized? Are most DNS queries being handled by a small set of operators in the recursive resolver space? And what about authoritative servers? Is the market for these services highly centralized?
For the recursive resolver market, it appears that the majority use of the ISP-provided recursive resolver offsets the high degree of centralization in the open recursive resolver market, and the global market appears to be appropriately balanced in terms of diversity of providers. The same does not apply when we constrain the scope of this examination to just the open recursive resolvers or look at certain economies, where there is a high degree of centrality.
We have also looked at the market for authoritative servers, and here there is a somewhat different picture. Using a query-weighted metric to calculate market share, the largest four service providers account for 50% of queries, and the market for authoritative servers appears to be slightly centralized.
There are several concerns that are associated with a highly centralized market, particularly as it relates to the provision of common infrastructure services, such as the DNS. One is the emergence of critical vulnerabilities where the entire activity — and to be clear, here we are talking about the digital economy — is reliant on the services undertaken by a small clique of providers, or even a single provider. While this is a potential concern in the case of the provision of authoritative servers in the DNS, it is not a concern in the provision of recursive resolution services, where ISP-provided services provide a necessary balance to the position of Google’s public DNS offering.
Another concern is that centralization can lead to monopoly or cartel-like behaviour, resulting in price gouging and other forms of market abuse. The issue is consumer protection, where price escalation in the provision of essential infrastructure services can cause inefficiencies throughout the entire digital economy.
A somewhat anomalous aspect of recursive resolution is able to reduce this concern for consumers. The market for DNS recursive resolution looks like a complete economic failure! None of the service’s DNS clients pays for the service! Users do not, in general, directly pay a transaction fee to have their queries answered, and users do not pay to have their potential future responses held in the cache of recursive resolvers for faster service when needed. From the consumer perspective, this has the superficial appearance of a free service! Name operators also do not pay recursive resolvers to resolve their names on their behalf. So, nobody pays.
The concern that centralization would lead to the emergence of price escalation in this market through the imposition of monopoly rentals seems like a very distant prospect right now. There are some specialized DNS resolution services where the client does pay, including so-called ‘scrubbing’ DNS services, which pre-emptively remove the resolution of certain DNS names, but these tend to have a specialized client base and do not seem to have an impact on the larger DNS resolution market, at least so far.
Is there a potential user impact contained in the emerging centralization of the authoritative nameserver service? To some extent, yes, this is a distinct possibility, but for me, this topic is bound up in the larger topic of the nature of monopoly and competition in digital markets. The economic environment of the digital world is far removed from that of the physical industrial world of the 1890s, where the concept of regulatory responses to monopolistic behaviours was crystallized in the Sherman Act in the US. It’s sufficiently different that it merits some consideration as a topic on its own in a future article.
The views expressed by the authors of this blog are their own and do not necessarily reflect the views of APNIC. Please note a Code of Conduct applies to this blog.