

At APNIC Labs, we publish several measurements of the deployment of various technologies that are being adopted on the Internet. In this post, we will look at how we measure the adoption of IPv6.
IPv6
By 1990, it was clear that IP had a problem. It was still a tiny Internet at the time, but the growth patterns were exponential, doubling in size every 12 months. We were stressing the pool of Class B IPv4 addresses, and in the absence of any corrective measures, this available address pool would be fully depleted in 1994.
The short-term expedient response from the Internet Engineering Task Force (IETF) was to drop the Class structure in the IP address architecture and allow networks to use an address prefix length more precisely suited to each network. Routing protocols, including BGP, were quickly modified to support these classless address prefixes.
As variably sized address prefixes became common, the allocation process grew more complex. To manage this, the Internet community introduced the Regional Internet Registry (RIR) system, enabling each region to handle its own detailed address allocation and registry operations. This regional structure improved the precision of allocations and ensured that resources were distributed more carefully, allowing for a more disciplined and conservative approach to address management.
At the same time, the idea of ‘address sharing’ through Network Address Translation (NAT) began to gain traction among ISPs. NAT not only simplified address administration but also played a major role in easing pressure on overall address consumption.
The adoption of these measures during the early 1990s transformed what had appeared to be a two-year address exhaustion crisis into a more manageable decade-long depletion scenario. However, they were never regarded as a permanent solution. It was widely recognized that a sustainable long-term response would require extending the 32-bit address field used in IPv4.
At the time, computing was shifting rapidly from mainframes to personal and portable systems, with further miniaturisation and the rise of embedded devices already on the horizon. It was clear that an address space of four billion unique identifiers would be insufficient for the scale of growth expected in the years ahead.
After considerable debate, the IETF decided in 1994 to make the smallest possible set of changes to IP, aside from expanding the address size. The address fields in the IP packet header were increased to 128 bits, a Flow ID field was introduced, fragmentation behaviour was modified and moved to an optional header, and the Address Resolution Protocol (ARP) was replaced with multicast-based mechanisms.
The bottom line was that IPv6 did not offer any new functionality that was not already present in IPv4. It did not introduce any significant changes to the operation of IP. It was just IP, with larger addresses.
However, even these minimal changes were enough to make IPv6 incompatible with IPv4. A host running an IPv4 network protocol stack cannot directly communicate with an IPv6-only host. This meant that the transition to IPv6 would necessarily occur in two stages.
First, all hosts and network infrastructure would need to support both IPv4 and IPv6 simultaneously — a configuration known as dual-stack. Only once this dual-stack capability was universal could IPv4 be safely phased out. While the final step of removing IPv4 could, in theory, happen quickly once dual stack deployment was complete, the initial transition to a dual stack environment was never expected to be rapid. Still, few anticipated that the Internet would remain in this transitional state more than 30 years later.
Measuring IPv6 deployment
The question we’d like an answer to: ‘How much longer will this transition to universal dual stack support take?’ This question is more easily answered by using a slightly different formulation: “What proportion of users support the use of IPv6?”
The reason this is an equivalent question is that if we can measure the level of IPv6 deployment, then this measurement is equivalent to measuring dual-stack support. A time series of this measurement can be used to formulate a predictive model, which can provide an answer to the question of how much longer this process will take.
Measurement by advertisements
APNIC Labs uses online advertisements (ads) to perform such measurements. The ad material includes a script component that is executed by the user’s browser when the ad is impressed. The script’s functional capabilities are highly limited in the context of ads, but they do permit the script to perform the retrieval of URLs. A URL requires the resolution of a DNS name and then an HTTP operation to fetch the identified resource. The DNS name used in these ads is unique in that each measurement test in each ad uses a different DNS label. This is to remove the interference from caches in the operation of the measurement.
The measurement system is configured to present between 25M to 30M ad impressions per day. The ad impression pattern across the Internet is not uniform, so we use additional data from the UN Statistics Division and the ITU-T to relate the number of ad impressions per economy per day to the Internet user count per economy per day. The per-economy ad data is weighted by the relative user count per economy to adjust for this implicit ad presentation bias.
We cannot instrument the user’s browser, so we set up a known set of URL fetches to be performed by the client and configure the URLs such that the tested client browser has to resolve a DNS name and perform a web fetch. We can infer the behaviour of the tested client by looking at the DNS queries and web fetch logs that are generated on our servers. We also perform a full packet capture and can analyse this to establish the round-trip time (RTT) and calculate the difference between IPv4 and IPv6 RTTs.
We are also interested in the behaviour of the tested client with the dual-stack test. A browser that supports the ‘Happy Eyeballs’ (RFC 8305) mechanism should prefer to use IPv6 when the access times to the server are comparable in both protocols.
IPv6 deployment reports
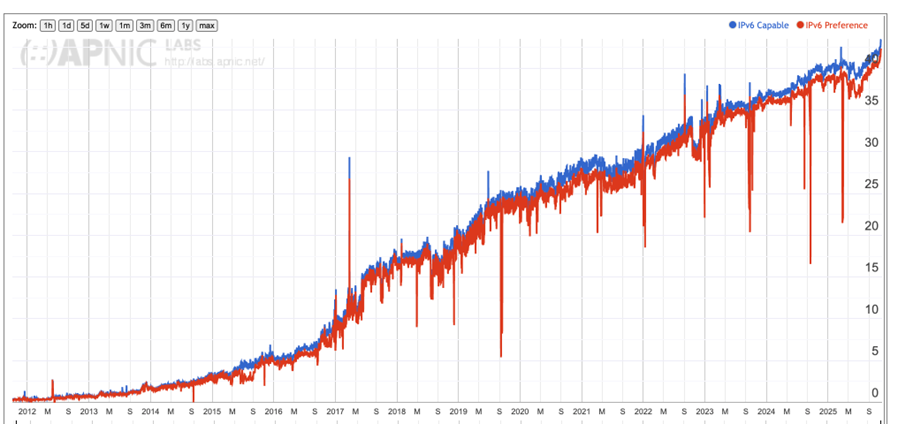
At APNIC Labs, we’ve been undertaking this measurement daily since 2012. The overall results of the adoption of IPv6 as a time series plot of daily measurements are shown in Figure 1.
There are two time series plots in this figure. The blue trace shows the proportion of tested end users that can retrieve the IPv6-only web object, indicating that they have IPv6 capability. The second trace is the proportion of users who use IPv6 to retrieve the dual-stack web object using IPv6. There are times when a dual-stack capable host uses IPv4 in preference to IPv6 to fetch a web object.
The most commonly used procedure to select which protocol to use is termed Happy Eyeballs, and it relies on the relative timing to resolve the DNS name of the web object into an IPv4 and an IPv6 address. The Happy Eyeballs host uses the protocol whose DNS resolution completes the fastest, but biases the test by giving the IPv6 resolution task a head start, generally set to 50ms. In our case, the DNS and web objects are all located on the same servers, so the only major difference is the network path used by the two protocols. If they differ such that the IPv6 path is slower than the IPv4 path, then the likelihood that the IPv6-capable host will select IPv4 to retrieve the dual-stack web object increases.
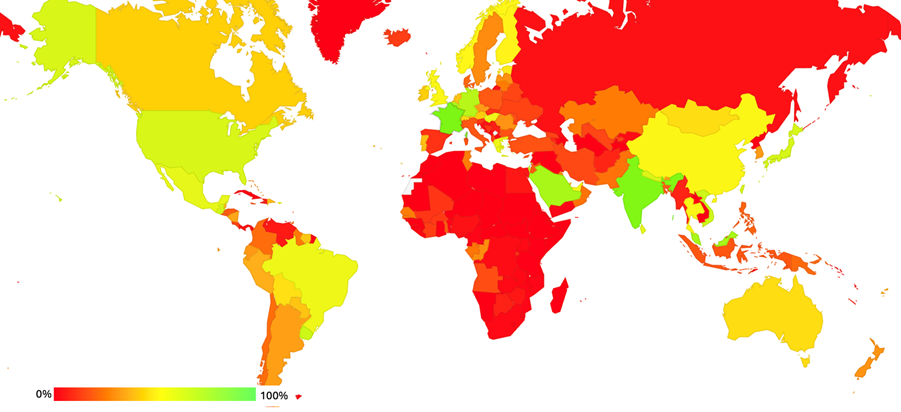
IPv6 uptake rates on a per-economy basis are highest in France, India and Saudi Arabia. Across most of the African continent, Eastern Europe and Western Asia, the IPv6 adoption rates remain quite low.
The IPv6 reports at APNIC Labs provide an interactive form of navigation that generates time series DNSSEC validation reports down to the level of individual network providers in each economy.
This measurement also looks at the timing of the initial TCP packet exchange (the SYN/ACK 3-way handshake) and performs a server-side measurement of the RTT to send a packet from the server to the client and back again. The IPv6 test also includes an IPv4-only web object in addition to the IPv6-only web object, so for dual-stack hosts, we will have an RTT measurement in IPv4 and in IPv6.
Because the RTT is a critical factor in overall service performance, we have used this RTT difference data to generate a per-economy view of RTT differences, shown in Figure 3.
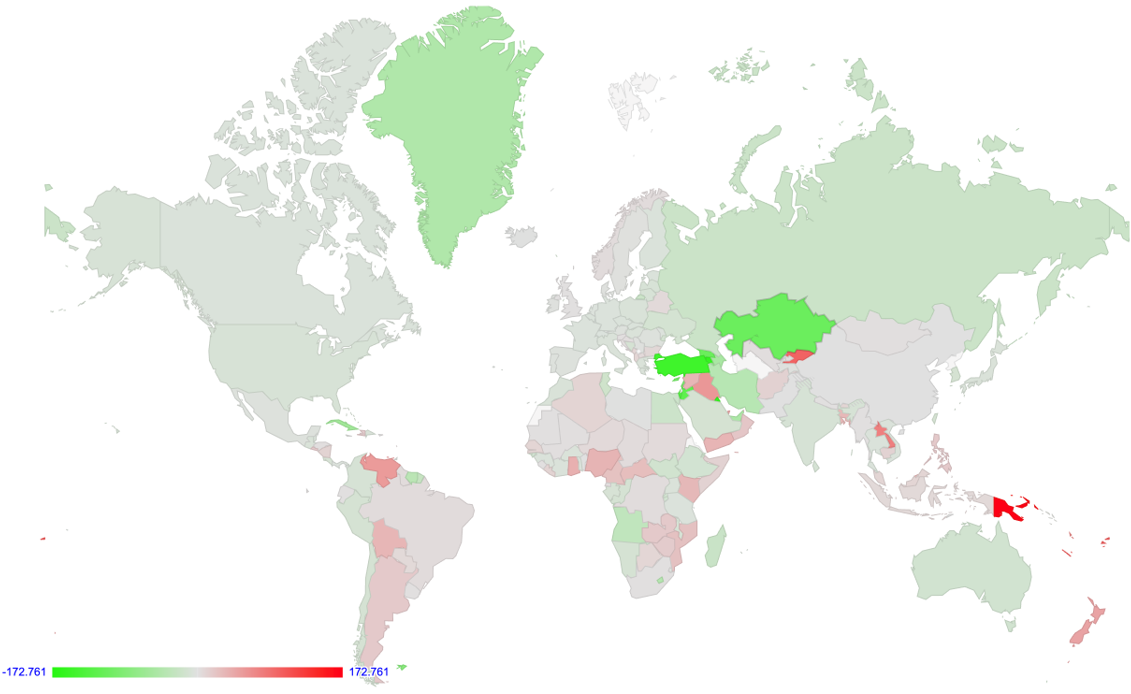
As indicated in this map, across much of the world, there are only small differences between the RTT for these two protocols, with some notable exceptions in South America, Western Asia and Oceania
One of the key differences between IPv6 and IPv4 lies in the handling of packet fragmentation. In IPv4, if a packet is too large to be forwarded to the next hop, the router automatically breaks it into smaller fragments. The IPv4 header includes fields that indicate the packet has been fragmented and specify each fragment’s position within the original packet. These fragments are then forwarded to the destination host, which is responsible for reassembling them into the original packet.
This mechanism proved extremely useful for building an Internet that operates across a wide variety of underlying transmission technologies, and for supporting various forms of packet encapsulation tunnels.
IPv6, however, changed this behaviour. Routers are no longer allowed to fragment packets in transit. Instead, if a packet is too large, the router sends an ICMPv6 Packet Too Big message back to the sender. It is then the sender’s responsibility to fragment the packet before retransmission, using a fragmentation extension header for each fragment.
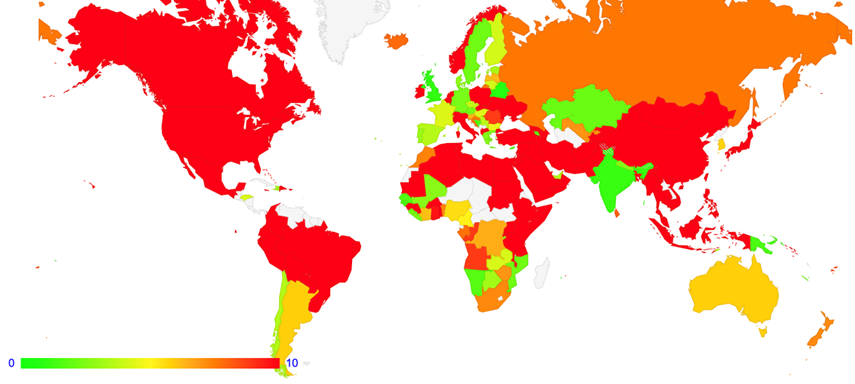
We test IPv6 fragmentation behaviour as part of the IPv6 measurement set, and a map of IPv6 fragmentation drop rates on an economy basis is generated daily. The current map is shown in Figure 4.
Getting IPv6 fragmentation handled correctly in networks is evidently quite challenging. More recent IPv6 deployments appear to handle fragmentation far more successfully than more mature IPv6 deployments. For example, the IPv6 fragmentation packet drop rate in Japan is an average of 20% of all users, while the same measurement in India has a far smaller 1% drop rate. But this is not always the case, and the IPv6 fragmentation drop rate in China, where the IPv6 deployment is currently underway, has a 6% drop rate.
There is an opinion that this drop rate of IPv6 fragmented packets will decline over time, and an opposite view that this is an intractable problem and the burden is on the application to always use packets that are sized below the IPv6 maximum unfragmented packet size of 1,280 octets.
The outlook for IPv6
Much has been said on the outlook for IPv6, and I have added my own share of the word count on this topic (such as this article from October 2024).
As Figure 2 indicates, the IPv6 map shows a very fragmented picture. Many of the economies with a well-developed and mature Internet infrastructure with high Gross Domestic Product (GDP) per capita have made progress with IPv6, but there are also some notable exceptions, such as India, which has made major steps with a high volume IPv6 deployment in an economy that has a low GDP per capita.
The IPv6 deployments in Africa, the Middle East and Eastern Europe are generally very low, and if we want to see the overall IPv6 deployment measurement lift above 50% then much needs to be done on IPv6 deployment in these regions of our world. There are significant challenges that need to be overcome along this path, and it’s perhaps best not to be too impatient in waiting to see the IPv6 deployment measurement lift up to a level that shows a comprehensive adoption of a IPv6-capable Internet.
The views expressed by the authors of this blog are their own and do not necessarily reflect the views of APNIC. Please note a Code of Conduct applies to this blog.