
The DNS is a strange and surprising environment. One could take a simple perspective and claim that the aim of the DNS is to translate DNS names into IP addresses. And you wouldn’t be wrong, but it’s also so much more.
The DNS is used as a verification tool, a signalling protocol and a rendezvous mechanism. There is a lot of information that forms part of the DNS. Not only does the DNS describe the set of service names defined on the Internet, but if an observer can associate the query name in DNS queries with the identity of the querier then a vast trove of data is opened up. Almost every network transaction starts with a call to resolve a DNS name, so knowledge of a user’s sequence of DNS queries can be associated with a likely scenario of that user’s online activity.
The DNS is ubiquitous, so it’s no surprise that it’s been used by malware to operate command and control functions for distributed malware systems. DNS query data can be used to track the operation of malware platforms, and DNS query data has formed the core of a number of threat intelligence systems. Perhaps, surprisingly, it’s not just queries about names that exist in the DNS that can be informative; queries about names that do not exist in the DNS are informative as well.
If a query is passed to an authoritative server for a zone where the queried name is not defined in the zone, then the server will respond with a response code of 3. This is the NXDOMAIN response.
$ dig a.nonsense.dns-name

; <<>> DiG 9.18.15 <<>> a.nonsense.dns-name
;; global options: +cmd
;; Got answer:
;; ->>HEADER<<- opcode: QUERY, status: NXDOMAIN, id: 53374
;; flags: qr rd ra ad; QUERY: 1, ANSWER: 0, AUTHORITY: 1, ADDITIONAL: 1

;; OPT PSEUDOSECTION:
; EDNS: version: 0, flags:; udp: 4096
; COOKIE: 660df947a084a9dd0100000064a3929c3db746c4e9584a77 (good)
;; QUESTION SECTION:
;a.nonsense.dns-name.		IN	A

;; AUTHORITY SECTION:
.			10800	IN	SOA	a.root-servers.net. nstld.verisign-grs.com. 2023070301 1800 900 604800 86400

;; Query time: 277 msec
;; SERVER: ::1#53(::1) (UDP)
;; WHEN: Tue Jul 04 13:31:40 AEST 2023
;; MSG SIZE  rcvd: 151
The NXDOMAIN response normally includes an authority section, providing the Start of Authority (SOA) record of the authoritative zone asserting that the name does not exist. For names where there is no corresponding Top-Level Domain (TLD) name the DNS response includes the SOA record of the root zone, as in the above example. Where the name where the right-most label sequence does match a delegated domain name, the SOA record in the authority section includes the SOA record of the innermost enclosing zone.
As an aside, the NXDOMAIN response should not be confused with the NODATA response, which is a NOERROR response code (0) and an empty answer section in the response. NODATA indicates that the name is defined, but the query’s requested Resource Record (RR) does not exist for this name.
So, there’s an obvious question — what proportion of DNS queries are for non-existent names?
That’s an incredibly challenging question to try and answer if you wanted to use a comprehensive capture of all DNS queries as the base input to the analysis. The best we can do here is to capture queries from within a particular circumstance or locale that is hopefully reflective of the larger space, calculate the NXDOMAIN ratio and then perform some further analysis to understand to what extent this result truly reflects the broader reality of the entire DNS.
Where can we gather a set of such DNS queries that is ‘representative’ of the broader DNS activity set?
One response is to turn to the DNS root zone servers and the data that they record relating to queries seen at these servers. Helpfully, the root server operators have agreed to collect and publish a daily count of queries seen at each of the root server clusters. The data sets collected in this manner by the root service operators are described in RSSAC002 (PDF).
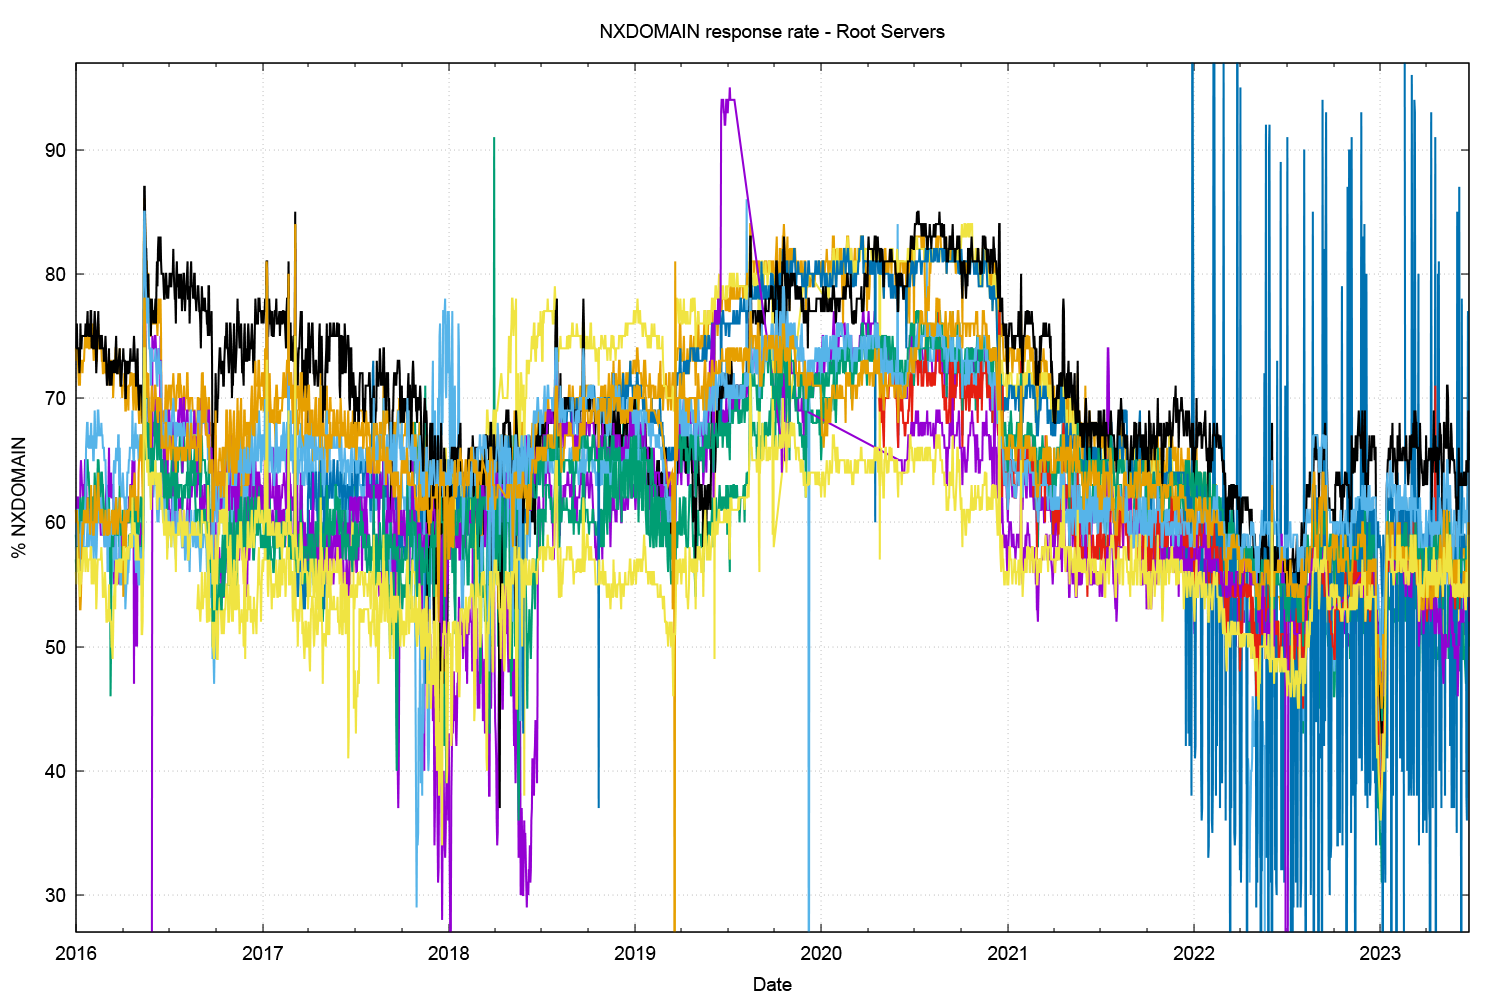
Figure 1 shows the percent of queries seen at the root servers that generate the NXDOMAIN response, showing the data per root server cluster basis for each day since the start of 2016. Currently, the NXDOMAIN response rate is between 50% and 65%. It has been higher in the past than this current level, and it peaked at the end of 2020 with an NXDOMAIN response rate of between 62% and 82%.
A very curious aspect of this behaviour is that the percentage of query traffic seen by each of the root service letters appears to vary significantly (up to 20%). In many respects, the root servers are intentionally identical, and all operate a distributed anycast service environment with geographically diverse locations, so it is unusual to see such variation in the root zone query profiles from each root service.
Chromoids
What is behind the rise and fall of the NXDOMAIN response rate between 2016 to the present time? As Verisign’s Matt Thomas reported on the APNIC Blog in mid-2020, the Chrome browser generates three single-label DNS queries, where the label is between 7 to 15 characters in length and composed of alpha characters.
The intent of these queries is to allow the browser to determine if the browser is located within a DNS environment that performs NXDOMAIN substitution. By this, it’s meant that instead of returning an NXDOMAIN response, the local DNS environment returns a response that points to some other Internet service, often some form of search engine.
Before February 2015, the code used by the Chrome browser generated only 10-character labels in the text, and the switch to randomized lengths as well as randomized labels were made in code releases as of February 2015. The Chrome browser engine makes these queries at browser startup, and when the local IP address changes, or if the local DNS server changes.
The motivation for Google’s Chrome browser to perform this test is pretty obvious. By replacing the ‘no such domain’ response with a synthetic pointer to a search page, the network operator can open up a potential revenue stream from the search system that may pay some form of bounty for search referrals, allowing the ISP to monetize all those NXDOMAIN responses from their DNS servers with very little upfront cost.
From Google’s perspective, this NXDOMAIN substitution is not well regarded. Search is a major path to advertisement placement and advertising is Google’s core revenue; having the DNS redirect users’ queries to non-existent DNS names to a competitor’s search environment is clearly not in Google’s own commercial interest. So how can Google’s Chrome browser platform detect network environments where NXDOMAIN substitution is happening? Simple. Have the browser test the DNS with its own nonce random string queries to see if NXDOMAIN substitution is taking place.
This supposedly innocuous probe of the DNS should’ve been pretty harmless to the DNS infrastructure. But there is a lot of Chrome out there these days. Some two-thirds of all browsers in use in today’s Internet are reported to use the Chrome browser, and the number rises when you include other browsers that are based on the Chrome engine.
It’s also useful to note the effect of caching at the recursive resolver level and the way in which this behaviour impacts root server observations. For example, if some 10% of queries at a recursive resolver are for random-string TLDs, while the remainder is conventionally cacheable, and if we assume that caching is 90% effective, then slightly more than half of the queries that this resolver would pass on to the root servers are for these random names. In other words, under such circumstances, the root would see a 50% NXDOMAIN query rate, while the recursive resolver would see a 10% NXDOMAIN rate.
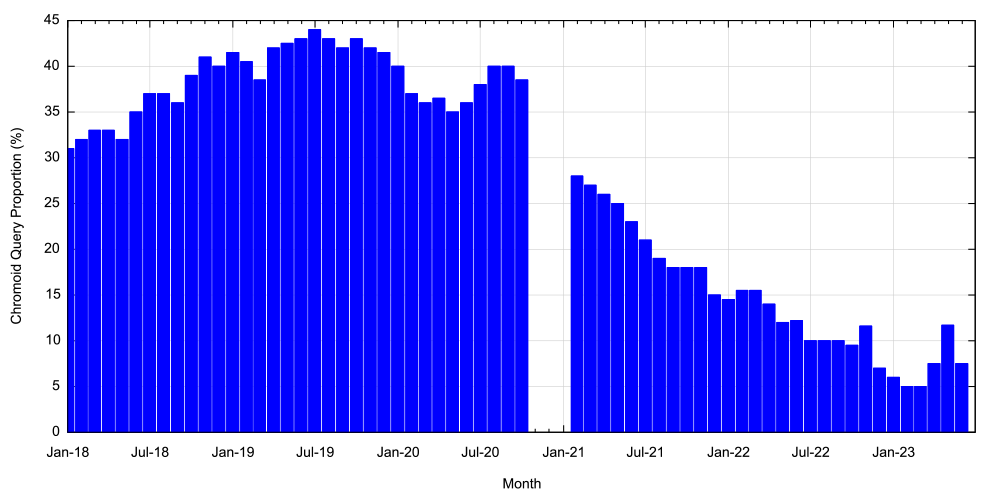
Google has evidently taken steps to stop the generation of these Chromoid queries. The Chromoid query rate as seen by the L-root servers appears to have dropped from a peak of some 43% in May 2019 to some 7% today (Figure 2).
ICANN IHTI Data
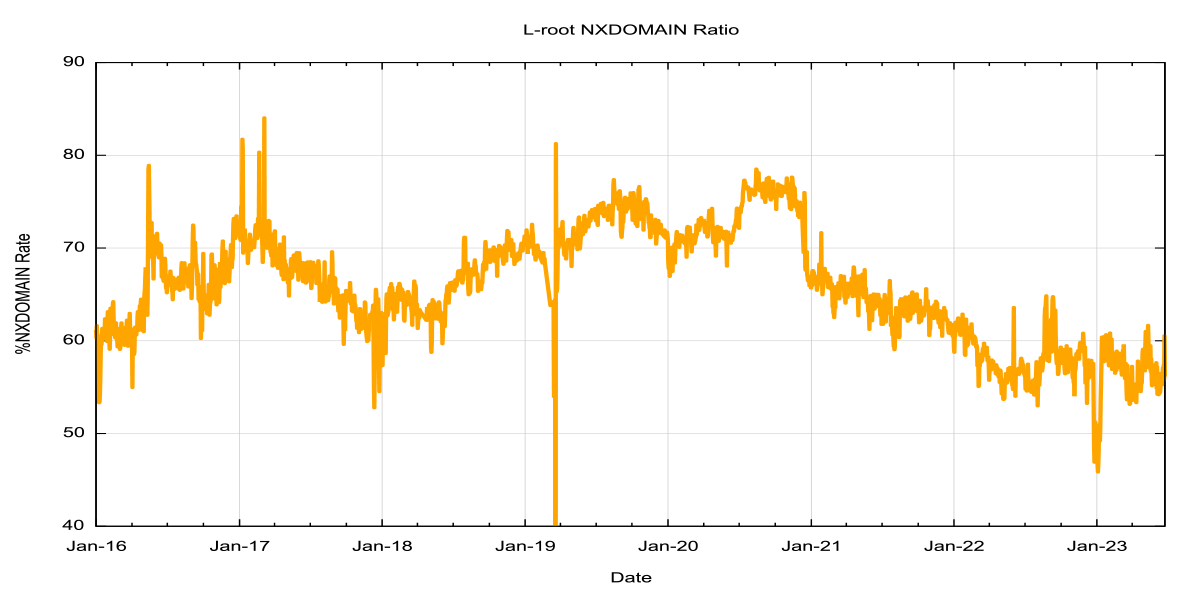
As well as the RSSAC002 data, ICANN performs an analysis of the queries made to the L root server to produce the Identifier Technologies Health Indicator (ITHI) report. As of June 2023, the report notes that 54.88% of queries presented to this root service generate NXDOMAIN responses. The time series of this NXDOMAIN data for the L-root service is shown in Figure 3.
The top 20 TLDs of these NXDOMAIN query names are shown in Table 1.
| TLD | % of all queries | % NXDOMAIN | Cumulative |
| local | 5.9% | 10.7% | 10.7% |
| internal | 2.7% | 4.9% | 15.6% |
| test | 2.0% | 3.6% | 19.2% |
| home | 1.2% | 2.1% | 21.4% |
| dhcp | 1.2% | 2.1% | 23.5% |
| ctc | 1.0% | 1.9% | 25.4% |
| lan | 1.0% | 1.8% | 27.2% |
| bbrouter | 0.8% | 1.4% | 28.6% |
| localdomain | 0.6% | 1.1% | 29.7% |
| localhost | 0.6% | 1.1% | 30.8% |
| arpa | 0.4% | 0.7% | 31.5% |
| wifi | 0.4% | 0.7% | 32.2% |
| k8s | 0.4% | 0.7% | 32.9% |
| resolve | 0.3% | 0.6% | 33.5% |
| invalid | 0.3% | 0.6% | 34.1% |
| openstacklocal | 0.3% | 0.6% | 34.7% |
| comhttps | 0.3% | 0.5% | 35.3% |
| corp | 0.3% | 0.5% | 35.7% |
| svc | 0.2% | 0.5% | 36.2% |
This is a skewed distribution in that some 10% of all NXDOMAIN query names are in .local (used by Apple in their multicast DNS environment), and the top 10 such TLDs encompass 30% of the NXDOMAIN query names.
Recursive resolver data
The next question is to what extent the root server measurement of NXDOMAIN responses, as shown in the ICANN ITHI study, are indicative of behaviours of the larger DNS? This is a challenging question to attempt to answer in that we do not have a comprehensive snapshot of ‘all of the DNS’. Once we move beyond the root server data then the next potential large-scale data source is the query profile of the larger DNS recursive resolvers. The issue here, as we’ve already noted, is that such recursive resolver data is, quite properly, treated as highly sensitive data.
In the generic model of the DNS, stub resolvers in end systems do not directly pass queries to the root servers. They pass queries to recursive resolvers who attempt to answer the query from their local cache. It’s only the cache misses that are then passed to the recursive resolution process.
Cached in the recursive resolver is the fact that this query name does not exist, not that the topmost domain does not exist. Hence queries for label1.no_such_tld and label2.no_such_tld are independently cached as NXDOMAIN entries. A zone file does not have a specified time-to-live (TTL) for non-existent names. The DNS uses the minimum TTL value in the zone’s SOA record as the cache time for NXDOMAIN entities (RFC 2308).
Is the profile of NXDOMAIN responses on recursive resolvers the same as the profile observed at the root, or is it different?
APNIC has entered into a collaborative research agreement with Cloudflare over access to certain analytical data sets that relate to the use of the 1.1.1.1 DNS open recursive resolver service. While APNIC has no visibility into the details of individual user queries, we do have access to some profile information for queries that are passed to this open recursive resolver service. Part of this profile information includes the transport protocol used to convey the query to the 1.1.1.1 resolver, and that is what will be looked at here.
Firstly, let’s look at the NXDOMAIN ratio for this recursive resolver.
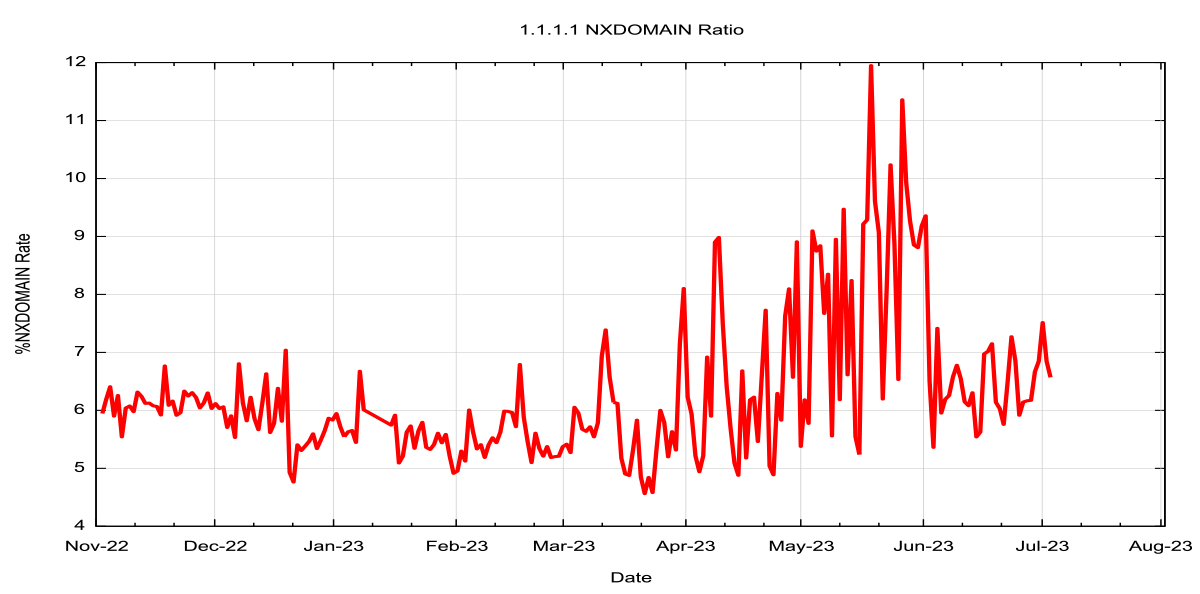
Comparing the data in Figures 3 and 4, it’s clear that the NXDOMAIN rate is some ten times higher in the root server data set as compared to the data from this recursive resolver service. This is not surprising given the high level of self-similarity of queries for defined names in the DNS, whereas NXDOMAIN names appear to have a higher level of variability, making caching far less effective.
| TLD | % of all queries | % NXDOMAIN | Cumulative |
| local | 3.24% | 49.34% | 49.3% |
| internal | 0.90% | 13.75% | 63.1% |
| test | 0.17% | 2.56% | 65.6% |
| lan | 0.08% | 1.23% | 66.9% |
| home | 0.07% | 1.14% | 68.0% |
| invalid | 0.05% | 0.74% | 68.8% |
| corp | 0.03% | 0.44% | 69.2% |
| js | 0.03% | 0.38% | 69.6% |
| loc | 0.02% | 0.37% | 70.0% |
| 6 | 0.01% | 0.22% | 70.2% |
| 1 | 0.01% | 0.19% | 70.4% |
| consul | 0.01% | 0.17% | 70.5% |
| intra | 0.01% | 0.13% | 70.7% |
| com:80 | 0.01% | 0.12% | 70.8% |
| com:443 | 0.01% | 0.11% | 70.9% |
| gateway | 0.01% | 0.10% | 71.0% |
| 8 | 0.01% | 0.10% | 71.1% |
| ____ | 0.01% | 0.10% | 71.2% |
| domains6 | 0.01% | 0.09% | 71.3% |
The list of the top 20 TLD names of these NXDOMAIN queries. The skew in this data is greater than that of the L-root set, and .local is just under one-half of all NXDOMAIN names. The top three names are the same as in the L-root data, namely .local, .internal and .test.
Chromoids are also visible in this data set, but in the recursive resolver data set they account for some 0.6% of all queries.
| TLD | % of all queries | % delegated queries | Cumulative |
| com | 39.6% | 42.4% | 42.43% |
| net | 10.9% | 11.7% | 54.08% |
| arpa | 8.3% | 8.9% | 62.96% |
| org | 2.3% | 2.4% | 65.39% |
| io | 1.2% | 1.3% | 66.67% |
| ru | 1.1% | 1.2% | 67.87% |
| cn | 0.9% | 0.9% | 68.82% |
| de | 0.9% | 0.9% | 69.74% |
| br | 0.8% | 0.9% | 70.60% |
| jp | 0.7% | 0.7% | 71.34% |
| me | 0.6% | 0.6% | 71.96% |
| xyz | 0.5% | 0.5% | 72.48% |
| co | 0.4% | 0.5% | 72.95% |
| uk | 0.4% | 0.5% | 73.41% |
| fr | 0.4% | 0.4% | 73.81% |
| tv | 0.3% | 0.4% | 74.17% |
| us | 0.3% | 0.3% | 74.51% |
| pl | 0.3% | 0.3% | 74.83% |
| au | 0.3% | 0.3% | 75.16% |
| cloud | 0.3% | 0.3% | 75.46% |
We can also look at the relative use of the various delegated top-level domain names in this data. This is shown in Table 3. The pair of .com and .net. accounts for 54% of all delegated name queries, showing a strong level of centrality in the DNS namespace when looking at query profiles.
The report of query name profiles as seen by the 1.1.1.1 DNS recursive resolver can be found at APNIC Labs.
Conclusions
The L-root data set and the 1.1.1.1 data set agree on the three TLDs that are the largest TLDs for NXDOMAIN queries, but quickly diverge thereafter.
If one were to take the L-root data as the sole determinant of potential name collision were the TLD to be delegated in the root zone, then this data may lead to some potentially misleading conclusions.
It’s difficult to place the 1.1.1.1 query data into some broader perspective given that there are no further large-scale data sets to use in comparison. If the aim is to determine which TLD names represent an elevated risk of name collision, were they to be delegated in the root zone of the DNS, then it may be appropriate to look at other forms of measurement to complement this query-based data.
The views expressed by the authors of this blog are their own and do not necessarily reflect the views of APNIC. Please note a Code of Conduct applies to this blog.
Thank you Geoff, very good article, helped us to see more data and truth.
I have a question, is the ratio of NXDOMAIN in Table 1 and Table 2 calculated as the ratio of the domain name or the ratio of the number of requests?
the latter – its a ratio of the number of queries (requests).
1. I noticed that all the TLDs shown in your Table 2 do not exist. For the data where the TLD is valid but the query name does not exist, were they also included in the statistics for Table 2, just not shown in the top 20? Or did I misunderstand something?
2. Do the “% of all queries” in Table 2 and Table 3 refer to queries containing all response types?
1. Its only TLDs. Here we are trying to understand the difference between recursive resolvers and root services. As the root servers are not recursive resolvers we look at the queries that return NXDOMAIN based on the TLD used in the query.
2. yes
Thank you for your reply. May I understand it this way,
1. In order to compare with the root server, all the NXDOMAIN responses for the 1.1.1.1 recursive resolver mentioned in the blog only include NXDOMAIN responses for FQDNs where the TLD is not delegated. It does not include NXDOMAIN responses for non-existent domain names under delegated TLDs. The ‘NXDOMAIN ratio’ shown in Figure 4 also does not include the NXDOMAIN response requests for all the query names from the 1.1.1.1 resolver.
2. Similarly, the “% NXDOMAIN” statistics in Table 2 do not include the NXDOMAIN response requests for FQDNs under delegated TLDs.
3. The “% delegated queries” in Table 3 refers to the percentage of requests for domain names under delegated TLDs among all response requests.
Hi,
Yes, you are correct in all three cases.
(The data feed we receive from the recursive resolver is queries, not responses We have no a priori knowledge of what responses the resolver provided to the query, and we need to perform the query ourselvers if we want to know).