

I sought to find out if a Raspberry Pi could be a useful tool to monitor inside customer networks, given that they are low cost and take up very little space.
Before developing the monitoring system, I thought it prudent to first create the monitoring system requirements. The main purpose of the monitoring system is to check the upload/download speeds and latency on a user’s network. The monitoring system needs to be cheap, portable, and work on both wireless and wired networks. Data collection and reporting are also important requirements of our monitoring system.
Importantly, Raspberry Pi supports wireless networks, as most users use Wi-Fi, and Linux OS, which can be optimized. A major advantage of the Raspberry Pi for network monitoring is that it can use a power bank for power supply, allowing the quality of the Internet to be easily monitored from any part of the premises or household.
To develop a monitoring system that meets the above requirements, the following tools were used:
- Raspberry Pi — This device is low cost and small. The most important advantage is that it works in wireless and wired networks. A Raspberry Pi 4 Model B running the Ubuntu operating system is a good solution because it has 4GB RAM, a 1.5GHz CPU, and 16GB SD card storage.
- Python — To automate processes, such as measuring upload/download speeds, inserting data to MySQL, and so on.
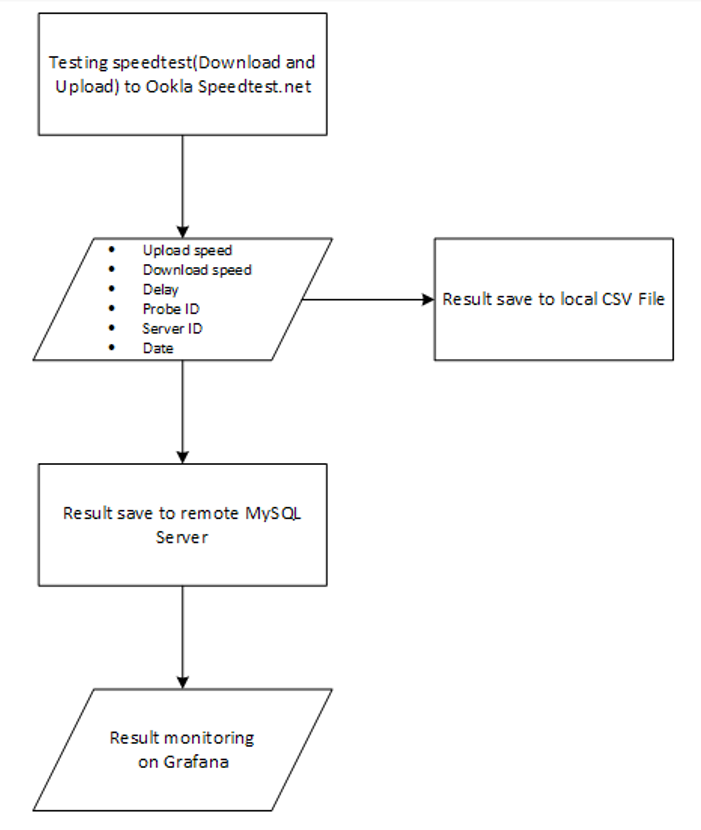
- Speedtest® by Ookla — The Raspberry Pi is configured to measure upload and download speed values using speedtest.net servers.
- MySQL and Grafana — Values stored in MySQL are reported using Grafana.
How it works
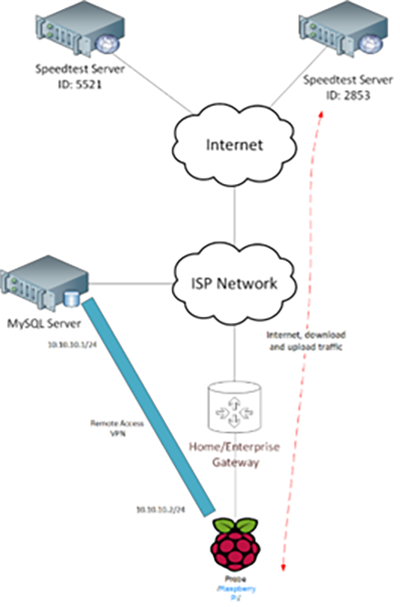
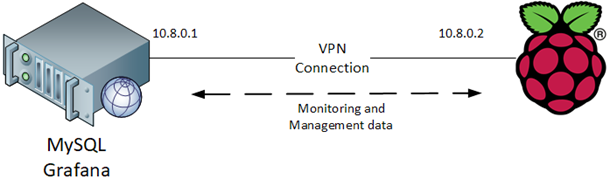
The Raspberry Pi will be positioned in the customer network as a probe to monitor network speeds and upload speed measurements to the MySQL server with the help of a remote access VPN. The collected data can then be viewed using Grafana.
Monitoring system reporting and visualization
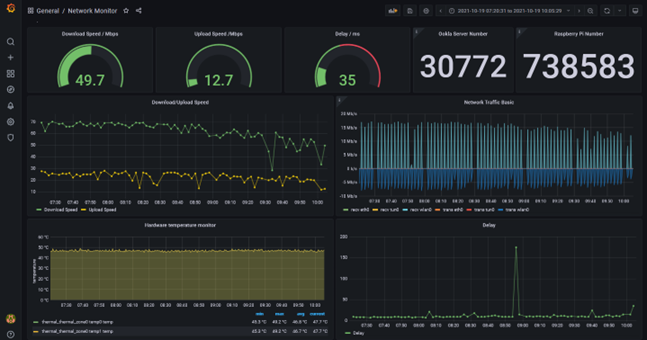
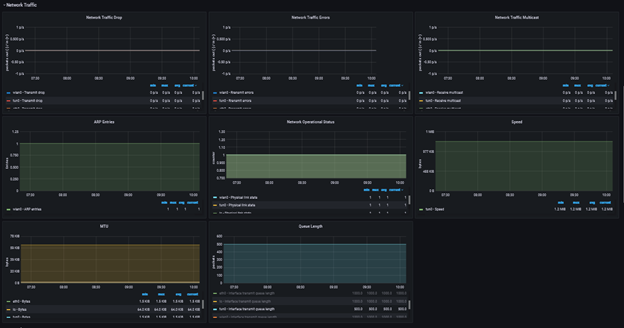
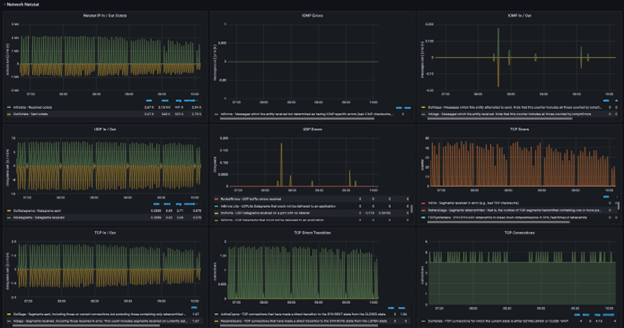
Grafana has two dashboards — one for network monitoring and one for probe monitoring. Figure 3 shows the network monitoring dashboard’s structure, with Ookla’s server and probe numbers alongside current server upload and download speeds, and latency. You can also view historic upload and download speeds, temperature, and traffic volume at timed intervals. In the network traffic section, you can monitor errors and drop packets (Figure 4), and categorize traffic on Netstat (Figure 5).
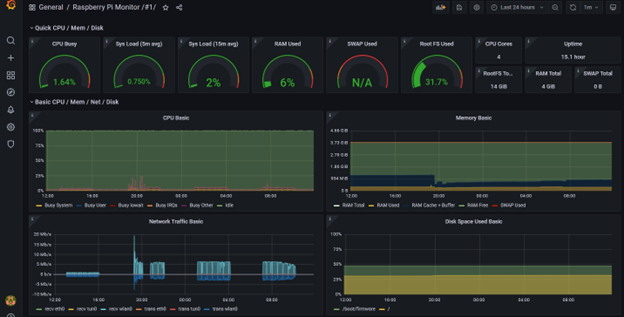
The ‘probe’ dashboard monitors hardware resources such as RAM, CPU, and local storage usage.
Tools
Install the following tools to use the probe monitoring dashboard.
- ubuntu@ubuntu:~$ pip install speedtest-cli
- ubuntu@ubuntu:~$ apt-get install speedtest
- ubuntu@ubuntu:~$ pip install mysql-connector-python
Speedtest CLI is a command-line interface for testing Internet bandwidth using speedtest.net, which has migrated to using pure socket tests instead of HTTP-based tests.
To connect to a MySQL server from Python, you need a database driver (module). MySQL Connector Python is the official Oracle-supported driver to connect MySQL through Python.
OpenVPN
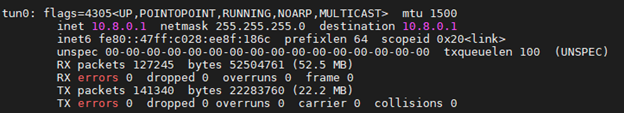
A remote VPN connection is used to insert data into MySQL for managing and monitoring. This is found in the ‘etc’ configuration of the VPN server. The default gateway IP address isn’t used on the tunnel interface of the VPN client so the VPN client will transfer traffic only used by MySQL and SSH access.
Database
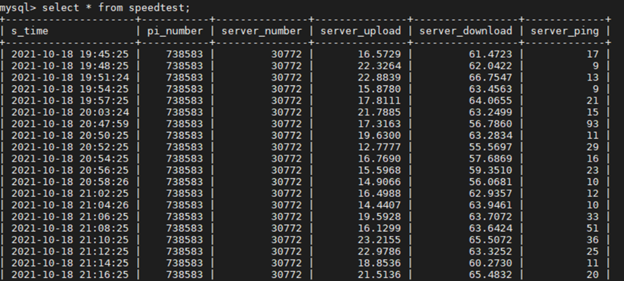
Figure 8 shows the structure of the MySQL table, containing the speed test start time, identification numbers of the Raspberry Pi and Speedtest server, download speed, upload speed, and the delay between the Speedtest server and Raspberry Pi. The identification number is useful when using multiple Raspberry Pis.
Monitoring and management of data transmutation
Remote access VPN is used for managing the connection and to connect MySQL databases on Probe. The Prometheus open-source tool is recommended for the probe’s hardware monitoring.
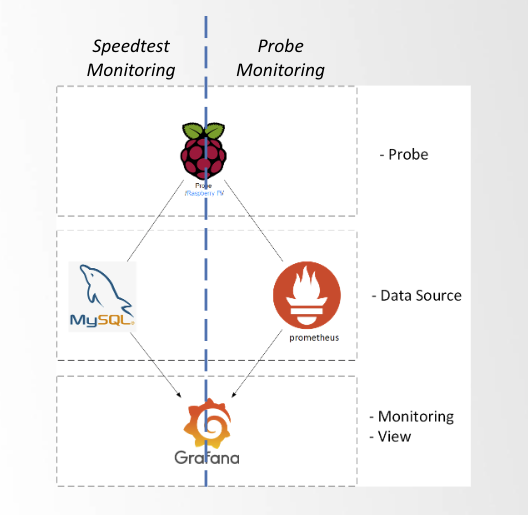
Grafana’s two dashboards named ‘Network Monitoring’ and ‘Probe Monitoring’ use MySQL and Prometheus respectively and their collected data can be used for creating reports. As shown in Figure 10, Grafana speed test monitoring will check the various results of speedtest.net while probe monitoring monitors the hardware resources and traffic load of the Raspberry Pi.
Results and future work
So far, two Raspberry Pis have been deployed successfully. During one week of testing, the average Raspberry Pi RAM usage was 6% and the average CPU usage was 3%. While the Raspberry Pi was operating, the temperature reached a high of 70 degrees Celsius; however, using a cooled case reduced the temperature to 50 degrees Celsius.
Using remote access VPN solves some security issues by monitoring data and SSH connections received on the tunnel interface and upgrades can be performed via remote connection. When Remote access VPN fails, the SSH connection is interrupted. However, the Speedtest measured value is stored in local storage. Currently, when the VPN fails or is blocked by customer, troubleshooting must be done in the onsite environment. There are still some security issues to resolve. This project is a work in progress, with security and operation log processes still being developed
Watch Byambajargal ‘s APRICOT 2022 presentation on this topic:
Byambajargal Jamsran is an IP Network Engineer and member of the mnNOG organizing team.
The views expressed by the authors of this blog are their own and do not necessarily reflect the views of APNIC. Please note a Code of Conduct applies to this blog.