

For a while, I have been looking for a SmokePing (GitHub) alternative to monitor different servers for latency. While SmokePing has survived well over time, in 2023 it feels like an outdated package, with limited options and lacks federation.
This post from Karan Sharma / Zerodha on ‘Monitoring my home network‘ was exciting. His setup included a Telegraf agent on a local server, Prometheus, to scrap data and Grafana, to draw latency data. I explored doing the same, but in a distributed manner, with a bunch of servers spread around.
After some attempts, I didn’t like Telegraf. Don’t get me wrong — it’s a good ‘agent’ to run on Linux servers, but is primarily designed with the assumption that an agent will push its data to the creator’s own time series database, InfluxDB. However, I am still exploring it for a different use case (pulling SNMP data from switches).
Blackbox Exporter
For latency, I settled for Blackbox Exporter. Again, it’s an open source tool that can run as a container or a service on a Linux machine. It’s a single binary that just needs a config file and one is good to go. Besides ICMP, it can also do HTTP(s), DNS, TCP, and gRPC monitoring, making it a handy agent.
I have a use case where I want a native install instead of a Docker on most servers because all servers do not have a Docker engine. But at the same time, I need docker at home on Intel NUC because that way I can run two instances of Blackbox Exporter across two different containers that are routed behind each ISP at home using policy-based routing.
Another thing I liked about Blackbox Exporter is the config style. It takes only the probe config but actual measurement targets are provided in the Prometheus configuration. This gives me the option to have a single Prometheus config with all the targets for all the servers.
Here’s my setup for now:
- Blackbox Exporter — to trigger measurement.
- Prometheus (it holds targets that are provided during the scrapping of data).
- Grafana to plot it.
- Alert Manager to trigger alerts for high-latency.
This is a powerful and scalable setup. With a couple more things like backing up older metrics on an S3 endpoint, it can be scaled up easily. Plus, Blackbox Exporter with config is effectively a stateless container. Besides hosting it on my infrastructure, I can also host it on Google Cloud and that gives me instant distributed view/latency/HTTP checks from Google against my infrastructure without having to host an expensive server over there.
Here’s an example GET call to a Blackbox Exporter endpoint to check for ‘anuragbhatia.com’
anurag@desktop ~> curl -s 'lo.host01.bom.anuragbhatia.com:9115/probe?target=anuragbhatia.com&module=icmp4'
# HELP probe_dns_lookup_time_seconds Returns the time taken for probe dns lookup in seconds
# TYPE probe_dns_lookup_time_seconds gauge
probe_dns_lookup_time_seconds 0.130653477
# HELP probe_duration_seconds Returns how long the probe took to complete in seconds
# TYPE probe_duration_seconds gauge
probe_duration_seconds 0.132437039
# HELP probe_icmp_duration_seconds Duration of icmp request by phase
# TYPE probe_icmp_duration_seconds gauge
probe_icmp_duration_seconds{phase="resolve"} 0.130653477
probe_icmp_duration_seconds{phase="rtt"} 0.001477566
probe_icmp_duration_seconds{phase="setup"} 0.000116058
# HELP probe_icmp_reply_hop_limit Replied packet hop limit (TTL for ipv4)
# TYPE probe_icmp_reply_hop_limit gauge
probe_icmp_reply_hop_limit 62
# HELP probe_ip_addr_hash Specifies the hash of IP address. It's useful to detect if the IP address changes.
# TYPE probe_ip_addr_hash gauge
probe_ip_addr_hash 8.53196068e+08
# HELP probe_ip_protocol Specifies whether probe ip protocol is IP4 or IP6
# TYPE probe_ip_protocol gauge
probe_ip_protocol 4
# HELP probe_success Displays whether or not the probe was a success
# TYPE probe_success gauge
probe_success 1
anurag@desktop ~>
probe_icmp_duration_seconds{phase="rtt"} 0.001477566 gives the Round-Trip Time (RTT).
Here’s a sample job config for Prometheus:
- job_name: host01.bom.anuragbhatia.com-blackbox-icmp4 # To get metrics about the exporter’s targets
metrics_path: /probe
scrape_interval: 60s
params:
module: [icmp4]
static_configs:
- targets:
# Europe
- speedtestmera.vs.mythic-beasts.com #London
- nbg.icmp.hetzner.com # Hetzner Nuremberg
- fsn.icmp.hetzner.com # Hetzner Falkenstein
- hel.icmp.hetzner.com # Hetzner Helsinki
- s3.fr-par.scw.cloud # Scaleway Paris
- s3.nl-ams.scw.cloud # Scaleway Amsterdam
relabel_configs:
- source_labels: [__address__]
target_label: __param_target
- source_labels: [__param_target]
target_label: instance
- target_label: __address__
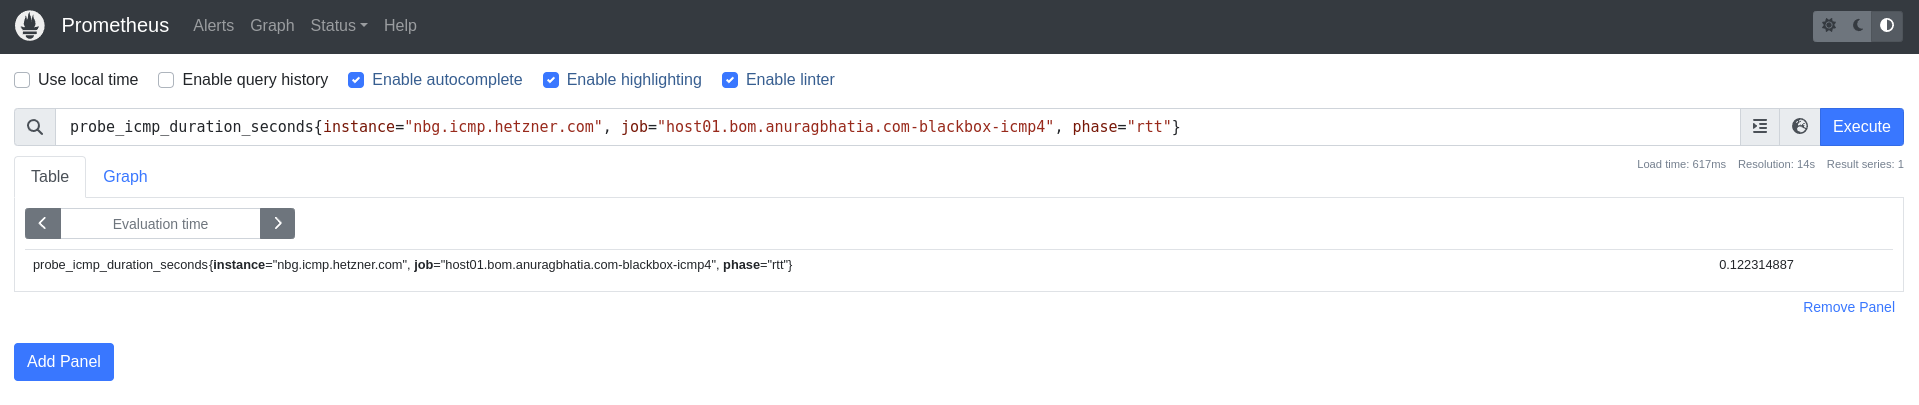
replacement: lo.host01.bom.anuragbhatia.com:9115 This triggers measurement against these targets every 60 seconds. Figure 1 shows a view of data from Prometheus’ time series database for Hetzner Nuremberg:
As shown in Figure 2, the same can be used in Grafana connected to this Prometheus instance:
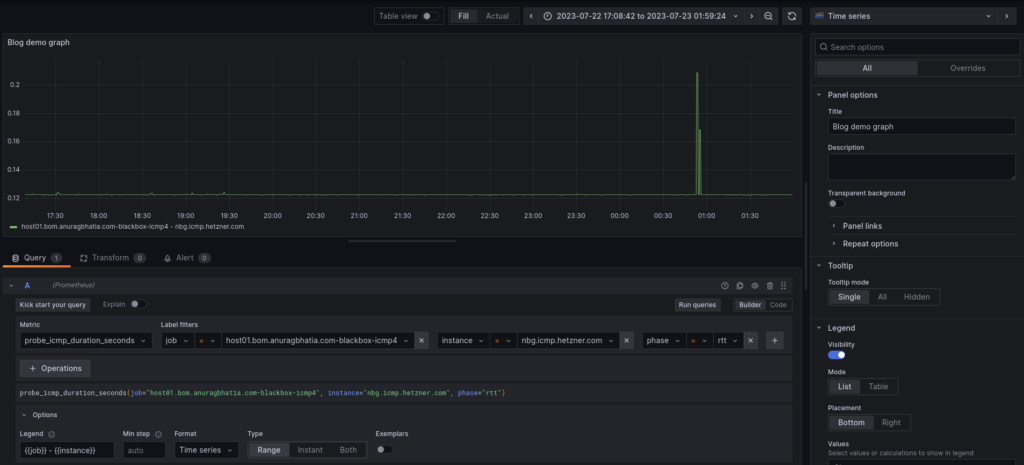
Eliminating instance matching allows for the inclusion of all instances within a single graph, which holds significant potential for comprehensively analysing latency to all destinations.
While the goal was to replace SmokePing, I’ve learned that with this setup, I can also replace LibreNMS and Uptime Kuma as well.
I’m currently loving the simplicity and power of Prometheus. However, before I can migrate away from SmokePing I need to add IPv6 probes, so it’s a work in progress for now.
Anurag Bhatia is a Network Researcher for Hurricane Electric (AS6939) working closely with BGP routing, IXPs, DNS, IPv6, anycast, and other related aspects of the Internet core. He’s also involved with Internet measurement startup, Lynkstate, as an advisor.
Adapted from the original post on Anurag’s blog.
The views expressed by the authors of this blog are their own and do not necessarily reflect the views of APNIC. Please note a Code of Conduct applies to this blog.