

WiFiMon is developed under the GN4-3 project and provided as a service by the pan-European GÉANT network. In this post, we will provide an overview of WiFiMon and its basic features, installation instructions, and useful links.
WiFiMon is an open-source toolset that provides methods for evaluating the performance of Wi-Fi networks. Its purpose is to assist network administrators to identify underperforming areas within their networks and act accordingly, such as installing additional access points.
WiFiMon combines two kinds of measurements:
- Crowdsourced
- Hardware probe measurements
Crowdsourced measurements are received from the end users of the Wi-Fi network and are used to evaluate network performance as experienced by end users, who may be at various points within the Wi-Fi network. Hardware probe measurements monitor performance from fixed points within the Wi-Fi network, providing a method to verify the accuracy of crowdsourced measurements.
Via crowdsourced and hardware probe measurements, WiFiMon gathers results for download throughput, upload throughput and HTTP Round-Trip Time (RTT). Also, WiFiMon collects additional data from the hardware probe wireless NICs, such as signal strength, bit rate, and link quality.
In IEEE 802.1X networks such as eduroam, WiFiMon provides additional capabilities for network administrators. Specifically, WiFiMon correlates performance results collected from Wi-Fi network end devices with information available from RADIUS and DHCP logs. Therefore, more accurate Wi-Fi network performance evaluation is possible, like throughput estimation per access point within the network.
The main idea of WiFiMon is to estimate the performance of Wi-Fi networks from the perspective of end users. WiFiMon differs from similar network monitoring solutions in that it uses appropriate technology to perform measurements without end-user intervention. Specifically, WiFiMon does not require installing any software on the end-user device and measurements are not triggered manually like Ookla Speedtest, but automatically.
Furthermore, WiFiMon leverages some appropriate open-source and lightweight tools to actively monitor networks without depleting the available bandwidth. These tools are:
Finally, WiFiMon includes mechanisms that secure the exchange and storage of sensitive information, such as end-user IP and MAC addresses or information collected from RADIUS and DHCP logs.
Components
WiFiMon consists of the following components:
- WiFiMon Software Probes: The end-user devices from which crowdsourced measurements are received.
- WiFiMon Hardware Probes: Devices that monitor the performance of the network from fixed points.
- WiFiMon Test Server: Software and hardware probe measurements are performed toward this component. Measurements mainly rely on JavaScript technology.
- WiFiMon Analysis Server: The central component of WiFiMon that receives measurement results as well as information available from RADIUS and DHCP servers. Data are then processed, analysed, correlated, and stored. Finally, the Analysis Server provides appropriate visualization of results to network administrators.
Operation
WiFiMon’s operation is depicted in Figure 1. Measuring with WiFiMon requires the network administrator to insert a few HTML lines in a commonly visited website. Such a website can be the main university website for campus networks or the website hosting the agenda for conferences. End devices within the Wi-Fi network that visit this website, namely software and hardware probes, download the HTML lines injected to the website and measurements towards the WiFiMon Test Server are automatically triggered. Subsequently, these devices download small images or files with test data, perform calculations on how fast the data were transmitted, and measurement results are then streamed to the WiFiMon Analysis Server. Within this server, measurement results are analysed and correlated with information available from RADIUS and DHCP logs. Finally, the results are provided to the network administrators through appropriately configured dashboards.
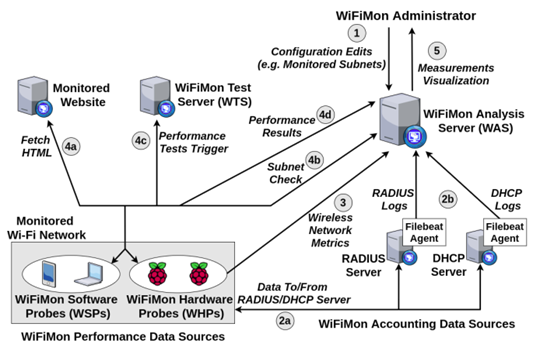
Figure 2 shows the Overview tab of WiFiMon, including statistics of all measurements processed by the Analysis Server daily. From this tab, administrators can inspect the total number of measurements performed during the day as well as the average, maximum, and minimum values of download throughput, upload throughput, and HTTP RTT (HTTP ping) reported by WiFiMon test tools.
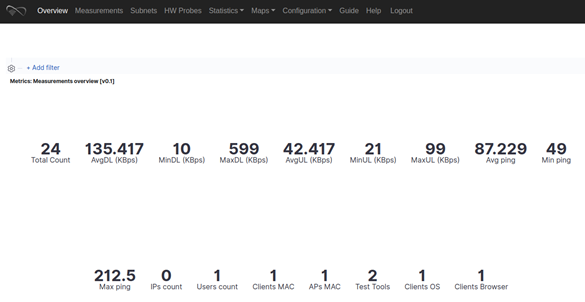
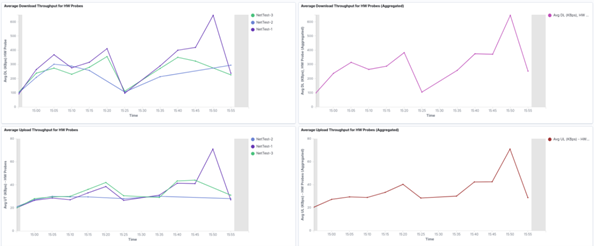
Figure 3 depicts the results of hardware probe measurements performed by WiFiMon during a recent time period, 60 minutes, for example. Specifically, this image includes charts reporting the download (upper row) and upload (bottom row) throughput as measured from fixed points within the monitored network. The charts on the left report measure performance per test tool used by WiFiMon, like NetTest, Akamai Boomerang, and LibreSpeed Speedtest, while charts on the right report measured performance, aggregated for all available test tools. Specifically, in the following image, we observe measurements gathered from three hardware probes, all using the NetTest test tool to monitor the Wi-Fi network.
Pilot results
WiFiMon has been mainly tested in two major GÉANT events: TNC19 in Tallinn, Estonia and GÉANT Symposium 2020 in Ljubljana, Slovenia. Results and conclusions from these events can be found in the recent WiFiMon publication at IEEE/IFIP WONS 2021.
Let’s look at the results of the GÉANT Symposium 2020 in Ljubljana, where WiFiMon monitored the eduroam ESSID for roughly 250 participants. The necessary HTML lines required by WiFiMon were inserted in the agenda of the symposium.
Figure 4 shows the average download throughput reported by crowdsourced measurements during the first symposium day. WiFiMon reported two major performance drops in the time periods following coffee breaks during the event (marked with number 1 in the chart). During these intervals most participants were, presumably, visiting the symposium agenda to pick the next session to attend. WiFiMon also reported a notable performance drop during and after the lunch break of the first symposium day (marked with number 2 in the chart). During this interval, most participants gathered in a less physical space, overloading specific access points of the venue. Finally, during the periods marked with 3, participants were distributed across the different sessions of the symposium, therefore specific access points were not overloaded and WiFiMon reported higher throughput.
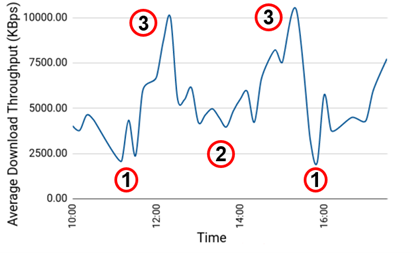
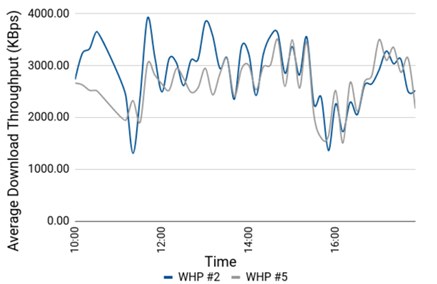
Figure 5 shows the average download throughput reported by two hardware probes during the same time period (first symposium day) as the crowdsourced measurements in Figure 4. Notably, we observe that both hardware probes report results follow similar trends, while both hardware probes can capture major performance drops reported by the crowdsourced measurements in the previous chart. The difference in the two graphs is a consequence of the hardware probes’ fixed locations, while the crowdsourced measurements are an average of all the participants at the venue. This shows that both types of measurements provide insights into the quality of experience for network users, but crowdsourced measurements, which are unique in WiFiMon, capture it more accurately.
WiFiMon installation
The Analysis Server can be installed in three different ways:
- In user premises (automated solution) using an Ansible Playbook.
- In user premises (manual solution) by installing all necessary software step-by-step.
- In a cloud environment (automated solution) via the NMaaS platform.
For the first and third option, we recommend physical or virtual machines with at least four cores, 8 GB RAM, and 50 GB free storage. The installation of the Analysis Server has been tested on Ubuntu 18.04 and 20.04, as well as on Debian 9 and 10.
Instructions for installing components are available. The Test Server can be installed on a simple machine. A prerequisite for this server is to be located relatively close to the network under evaluation so that the RTT between the devices and the Test Server is minimized. This delay is accounted for in the measurement results.
To facilitate the installation of hardware probes, the WiFiMon team provides preconfigured images in the installation instructions. These images are made for Raspberry Pi version 3 or 4.
Useful information, presentations, and installation instructions for WiFiMon are available. Here is the WiFiMon source code. If you need installation support or for information about operating WiFiMon, join the following mailing list: wifimon-ops@lists.geant.org.
For more detailed information read our paper presented at the IEEE / IFIP WONS 2021 International Conference or watch the presentation from TNC21:
Pavle Vuletic co-authored this post
Nikos Kostopoulos is a Ph.D. Student at NTUA. His research focuses on network security tailored to the DNS.
The views expressed by the authors of this blog are their own and do not necessarily reflect the views of APNIC. Please note a Code of Conduct applies to this blog.