

Mobile access technologies such as 5G and Wi-Fi 6E have made significant progress in recent years as key enablers for a wide range of emerging applications such as the metaverse, autonomous vehicles, and 3D Ultra-HD videos. For example, 5G and Wi-Fi 6E, the latest cellular and Wi-Fi technologies can support up to 20Gbps and 9.6Gbps bandwidth respectively.
Unfortunately, these figures have not been seen in the wild with reports from large-scale bandwidth testing services (BTSes) revealing that as of late 2021, the median 5G bandwidth is around 135Mbps in the US and 304Mbps in China, while the median Wi-Fi bandwidth is only 137Mbps in the US and 153Mbps in China.
To understand why these new technologies are significantly under delivering in real-world deployments in China, my colleagues and I at Tsinghua University, the University of Minnesota, and UIUC collaborated with UUSpeedtest to measure and analyse 23.6M bandwidth tests from 3.54M end users in China.
In this post, I will share several key findings from this research that we published and presented at SIGCOMM 2022.
Nationwide measurement of mobile access bandwidth
UUSpeedtest bandwidth testing uses the standard ‘probing by flooding’ approach. Upon a test request, the app first downloads large files from a nearby server through a HTTP connection(s) for ten seconds, and then samples the throughput statistics over time to estimate the access bandwidth (Figure 1).
Figure 1 — Bandwidth testing logics of UUSpeedtest
UUSpeedtest only collects bandwidth samples and the latency between the client and server, which is too coarse-grained for performing an in-depth analysis of its results and understanding the root causes of the undesirable access bandwidth. To overcome this shortcoming, we built a cross-layer and cross-technology data collection module for UUSpeedtest (Figure 2), that passively and selectively collects physical and MAC-layer information through standard Android APIs.
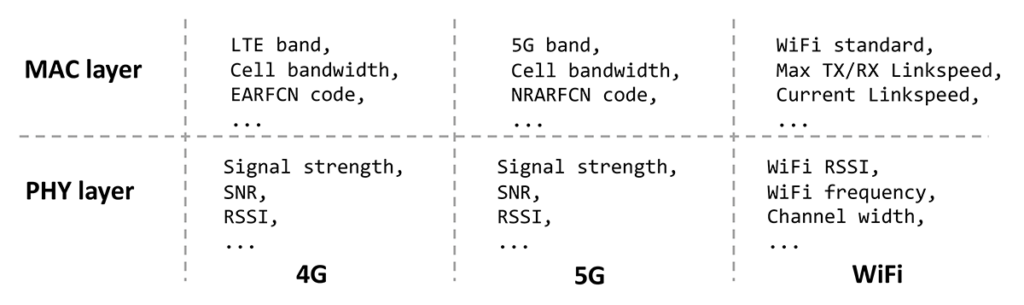
This module is implemented as a lightweight plugin for UUSpeedtest with no additional privileges and negligible CPU/memory/network overhead. We integrated this into UUSpeedtest and over the course of a year collected 23.6M bandwidth tests from 3.54M end users in China, involving 2.04M base stations, 4.47M Wi-Fi access points, 191 phone vendors, and 2,381 device models.
Spectrum refarming affects 4G access bandwidth
We captured all nine LTE bands used in China, referred to as Band 1, 3, 5, 8, 28, 34, 39, 40, and 41. Table 1 lists each band’s downlink spectrum (our study focused on the download mobile access bandwidths), maximum supported channel bandwidth, and corresponding ISP(s). Note that one band can be multiplexed by multiple ISPs.
| Band | DL Spectrum | Max Channel Bandwidth | ISPs |
| Band 28 | 758 — 803MHz | 20MHz | ISP-4 |
| Band 5 | 869 — 894MHz | 10MHz | ISP-3 |
| Band 8 | 925 — 960MHz | 10MHz | ISP-1, 2 |
| Band 3 | 1805 — 1880MHz | 20MHz | ISP 1, 2, 3 |
| Band 39 | 1880 — 1920MHz | 20 MHz | ISP-1 |
| Band 34 | 2010 — 2025MHz | 15MHz | ISP-1 |
| Band 1 | 2110 — 2170MHz | 20MHz | ISP-2, 3 |
| Band 40 | 2300 — 2400MHz | 20MHz | ISP-1 |
| Band 41 | 2496 — 2690MHz | 20MHz | ISP-1 |
Table 1 — LTE bands used in China (Green = H-Band, Blue = L-Band)
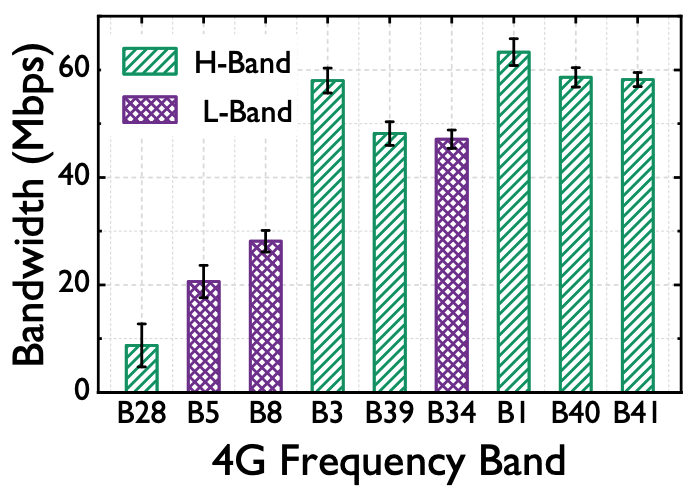
According to 3GPP’s LTE specifications, the channel bandwidth should reach 20MHz to realize the theoretical bandwidth limit of 4G access, so we denote the bands that support the 20MHz channel bandwidth as high-bandwidth bands (H-Bands for short), and the others as low-bandwidth bands (L-Bands for short).
We also observed that the average 4G access bandwidths on H-Bands are higher than that on L-Bands (Figure 3). Note that the result of Band 28 is highly biased here since Band 28 is assigned to the 5G-first ISP-4, and only two 4G bandwidth tests in our dataset are run on this band.
Since H-Bands are superior to L-Bands in terms of access bandwidth, most mobile users should be served by H-Bands. As shown in Figure 4, the majority (85.6%) of LTE bandwidth tests are conducted on H-Bands. Note the highly skewed workload distribution on H-Bands — Band 3 alone serves 55% tests.
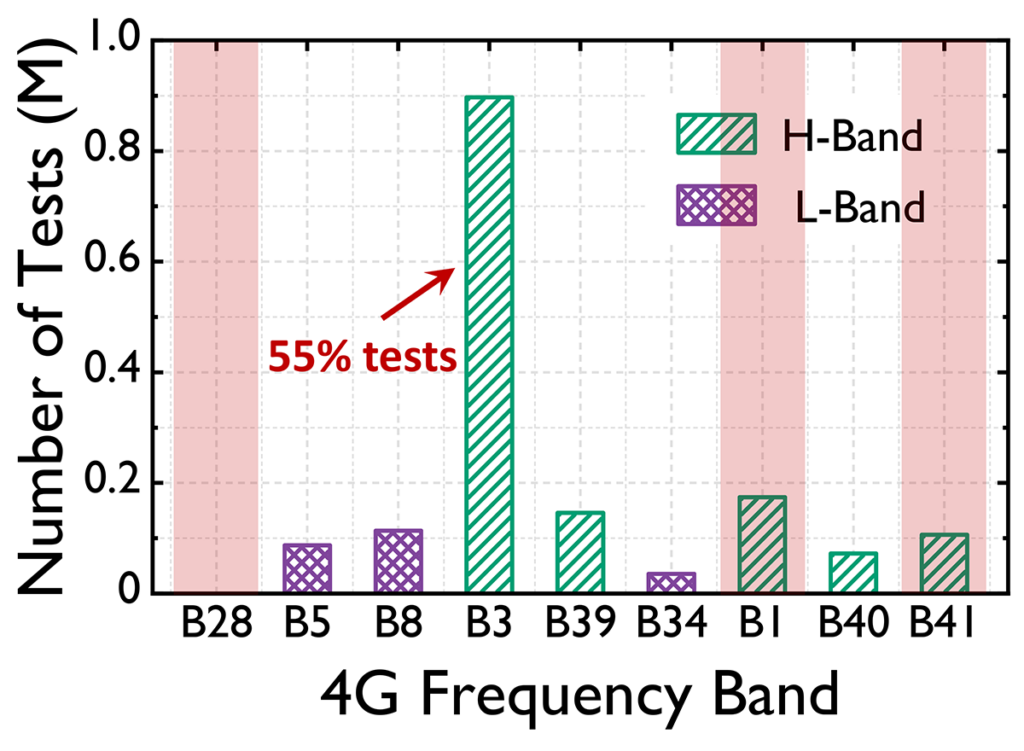
Deeper investigations showed that such skewed workload distribution was attributed to the recent migration of radio resources from other LTE H-Bands to 5G. In early 2021, a large portion of LTE H-Band spectrum was ‘refarmed’ for 5G usage; the affected bands included Band 1, Band 28, and Band 41, which together occupy 58.2% of the entire H-Band spectrum. Such an aggressive migration makes the original 4G workloads crowded in the remaining LTE bands, which constitutes an important cause for the sharp decrease in LTE access bandwidth from 2020 (68Mbps on average) to 2021 (53Mbps on average).
Higher RSS ≠ higher 5G access bandwidth
Excellent Radio Signal Strength (RSS) usually implies a higher Signal Noise Ratio (SNR), and higher access bandwidth. While our data showed that RSS and SNR are indeed positively correlated, a counter-intuitive finding was that RSS and 5G access bandwidth are not.
Figure 5a shows that as the RSS rises from level 1 to level 4, the average 5G bandwidth monotonously grows from 204Mbps to 314Mbps. However, when the RSS becomes excellent (level 5), the average 5G bandwidth sharply drops below that with level 3 and level 4 RSS. The situation is similar when we examine the median 5G bandwidth.
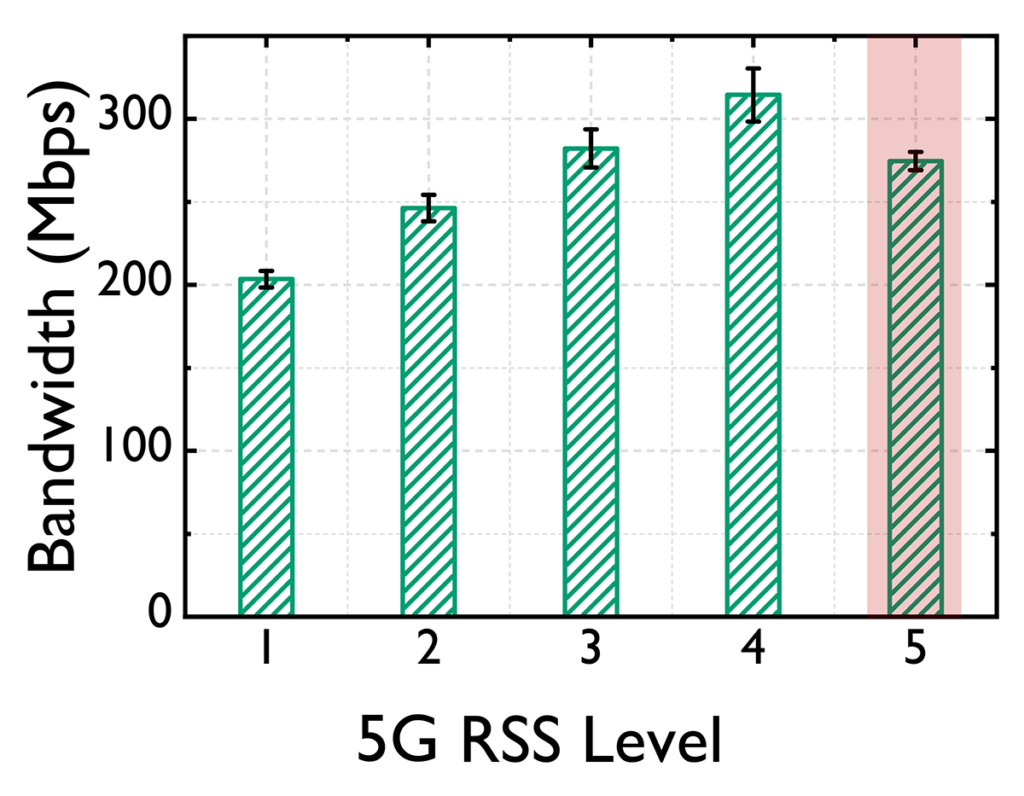
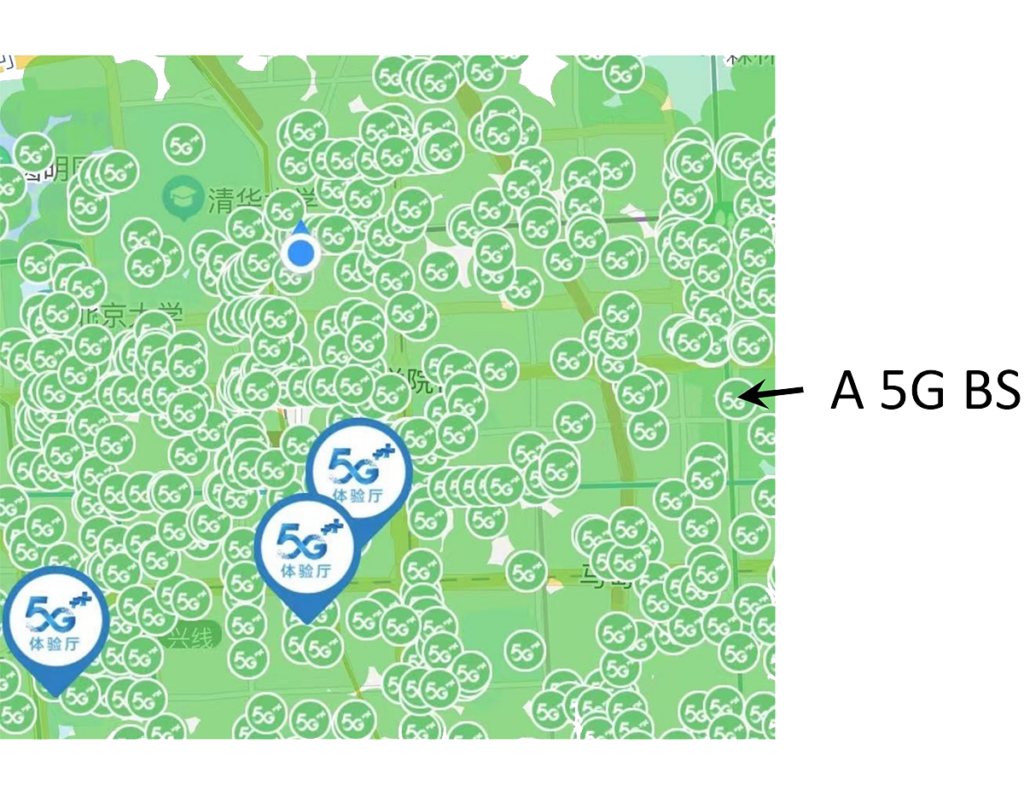
Upon further investigation, we noticed that the above-mentioned excellent-RSS 5G bandwidth tests are mostly performed in crowded urban areas, where 5G base stations (BSes) in close proximity tend to yield consistently low bandwidth.
Areas with high populations often require more 5G BSes (termed gNodeBs), as demonstrated in the Figure 5b. Although this provides higher signal strength, improper gNodeB placement and antenna configurations can easily lead to cross-region coverage — overlaps of different gNodeBs’ signal coverage — which can aggravate the already complex multipath and co-channel interference in urban areas with dense buildings, as well as the various load balancing issues and poor handover problems. This may especially be the case given that current 5G technology and deployment are rather immature. In comparison, we did not observe such a phenomenon on 4G access, given it is a much more mature, well-provisioned infrastructure deployed for 10+ years.
Wi-Fi bandwidth is limited by wired access
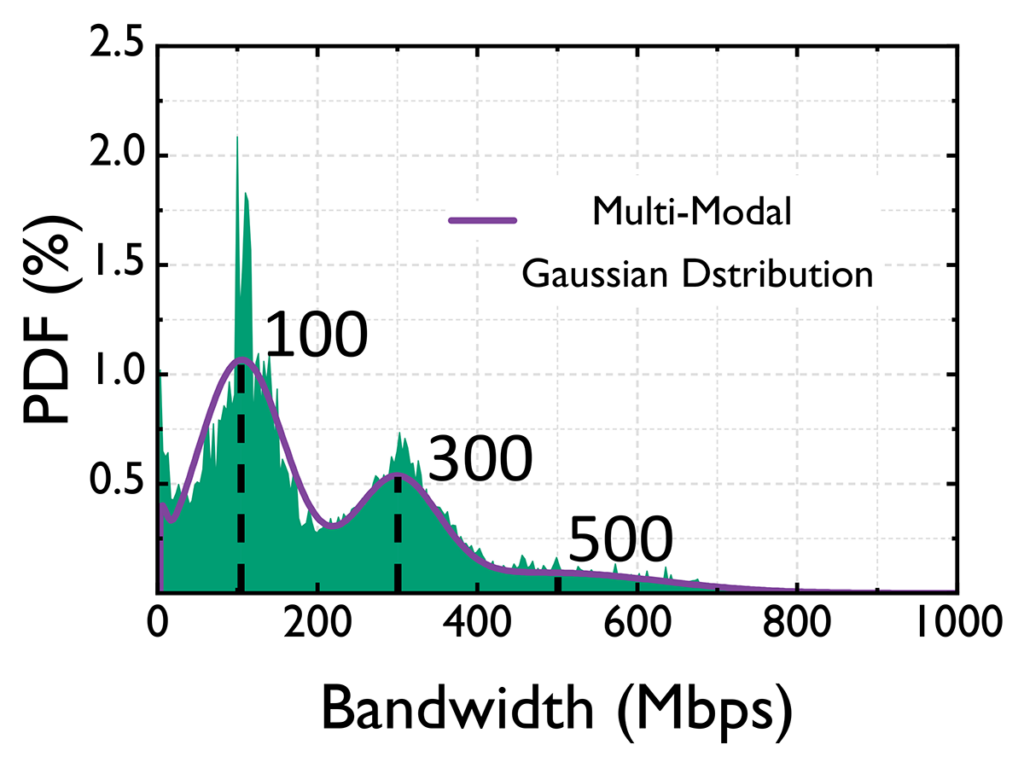
As part of our study into Wi-Fi networks, we noticed that for each generation (that is, Wi-Fi 4, 5, and 6), the Wi-Fi access bandwidths tend to cluster around certain 100x values, for example, 100 Mbps, 300 Mbps, and 500 Mbps for the Wi-Fi 5 network. Similar ‘clustered values’ also exist in Wi-Fi 4 and Wi-Fi 6 networks.
Interestingly, we found that these 100x values match the promised bandwidths of ISPs’ typical fixed broadband plans. In a sense, they reflect the distribution of Wi-Fi users’ purchased fixed broadband plans.
Based on this heuristic, the fixed broadband plans of ISPs, and other public reports on the bandwidth distribution of fixed broadband in China, we roughly inferred that around 64% of the Wi-Fi users are still using no higher than 200Mbps fixed ‘broadband’ Internet access. Consequently, the technical advantages of Wi-Fi 5 and Wi-Fi 6 are in fact largely offset by the tardy evolution of wired Internet access.
Learn more
Read our paper for more information on our study, including our findings into ISPs and infrastructure deployment, software and hardware configurations of user devices, diurnal traffic pattern of cellular network, and details of an ultra-fast, ultra-light bandwidth testing tool we develop called Swiftest based on the insights obtained from our measurement. Swiftest is featured by highly efficient bandwidth probing with statistical guidance, and can finish a bandwidth test in around one second.
Contributors: Hao Lin, Zhenhua Li, Feng Qian.
Xinlei Yang is a PhD student at the School of Software in Tsinghua University, Beijing, China, advised by Professor Zhenhua Li.
The views expressed by the authors of this blog are their own and do not necessarily reflect the views of APNIC. Please note a Code of Conduct applies to this blog.
Small portions of wifi compare to 5G