

We all know by now that monitoring the correctness of the Border Gateway Protocol (BGP) is a fundamental activity for any actor operating on the public Internet. Monitoring BGP is not only useful for identifying hijacks committed by other Autonomous Systems (ASes) but especially for timely identification of what your AS is doing.
Indeed human error is the first cause of network incidents, and being able to immediately identify a prefix you were not supposed to announce (for example, a typo) or a loss of visibility due to a wrong just-deployed configuration can drastically reduce the impact on the availability of both your and other operators’ services.
In an Internet composed of thousands of entities, with different levels of automation and expertise, providing free and easy-to-use tools for monitoring the correctness of the BGP is a key operation in improving the stability of the global Internet. For this reason, we at NTT are putting a lot of effort into developing and releasing open-source tools that we use to operate one of the world’s largest global Tier-1 IP backbones.
For the specific task of monitoring the BGP, we developed BGPalerter, which we released on GitHub under the BSD-3 license. We will use this application in the following tutorial. After completing it you’ll be able to:
- Monitor your prefixes, just by running an application, with no other dependencies or configurations.
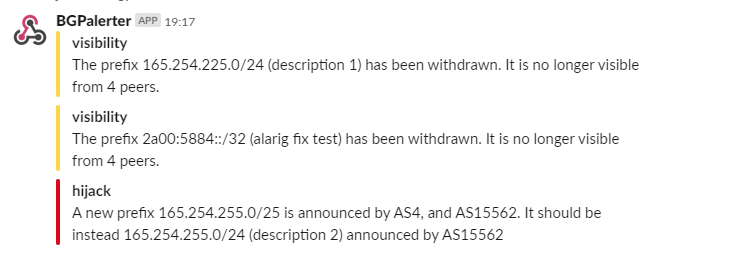
- Receive real-time alerts if something happens.
- Monitor hijacks and loss of visibility.
- Monitor if your AS starts to announce prefixes you were not expecting (for example, a typo in the configuration).
- Automatically store the BGP updates that triggered an alert (for later troubleshooting).
- Monitor the uptime of the monitoring process (for example, integrate it in Nagios).
Installation
BGPalerter can be executed from the pre-compiled binary, the source code, or in Docker. Here we will use the binary. Refer to the documentation if you are interested in the source code or Docker.
Steps:
- Download the binary here (BGPalerter is currently compiled for Linux, Mac, and Windows).
- Execute the binary (for example,
chmod +x bgpalerter-linux-x64 && ./bgpalerter-linux-x64). - The first time you run it, the auto-configuration will start.
That’s all; the installation is completed!
Auto-configuration
The first time BGPalerter is executed, a configuration wizard will start and ask you the following questions:
- The file prefixes.yml cannot be loaded. Do you want to auto-configure BGPalerter?
Answer “yes” to proceed with the auto-configuration wizard.
- Which Autonomous System(s) do you want to monitor?
You can monitor multiple AS numbers (comma-separated). You can have user groups to notify specific users about specific AS numbers.
- Are there sub-prefixes delegated to other ASes?
Answer “yes” to this question if at least a portion of the address space assigned to you is announced by another AS.
- Do you want to be notified when your AS is announcing a new prefix?
Answer “yes” to this question if you want to be notified every time a prefix that was not part of the previous configuration starts to be announced.
When the auto-configuration is completed, BGPalerter will start monitoring.
Next time you run it, the monitoring will start immediately since the configuration is persisted (in config.yml and prefixes.yml). If you get a warning that some of your prefixes are not covered by Resource Origin Authorizations (ROAs), I would suggest you review prefixes.yml by hand.
How will I be notified if something happens?
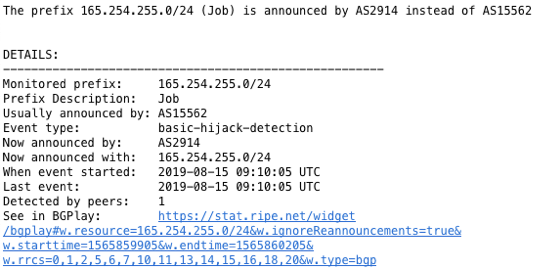
By default, you will find all the logs inside the directory logs/. In particular, alerts are going to be collected in the reports-YYYY-MM-DD.log files.
In config, under the “reportFile” section, you can configure additional parameters for the file reporting, including the persistAlertData parameter, which, if set to ‘true’, will enable you to store BGP updates that triggered the alerts.
It goes without saying that if none of the alerting conditions are met (for example, no hijacks happened), nothing will be logged in the report files.
Of course, this is not the most efficient way to get notified. BGPalerter can report alerts by using various channels, including email, Slack, Kafka, Webex, Alerta dashboard, Syslog, or any HTTP end-point. This list is constantly growing.
I am going to show you below how to enable email notifications — the same process applies to all the other channels.
Email notification
The best way to enjoy all the features of BGPalerter is to edit the config.yml file automatically generated on its first execution.
In this file, you will find the configuration for all the possible modules of BGPalerter. The only thing that you need to do is uncomment the related file portion. Nothing has to be downloaded or added to BGPalerter — the binary already contains all the modules. While the modules are already in the binary, they are not loaded and executed if the related section is commented in config.yml.
To enable email reporting, we have to uncomment the “reportEmail” section. This section includes some parameters that need to be configured, such as senderEmail, auth, and notifiedEmails. This module allows for local or remote smtp servers — see here for the documentation.
   - file: reportEmail
     channels:
       - hijack
       - newprefix
       - visibility
     params:
       senderEmail: bgpalerter@xxxx
       smtp:
         host: smtp.example.org
         port: 465
         secure: true
         auth:
           user: username
           pass: password
       notifiedEmails:
         default:
           - joe@example.org
Remember, every time you edit config.yml or prefixes.yml you have to restart the BGPalerter process.
Uptime of BGPalerter
For a production system, you should monitor that BGPalerter is up and running. This step is not mandatory but strongly suggested.
In config.yml you will find a processMonitors section that contains two modules:
 processMonitors:
   - file: uptimeApi
     params:
       useStatusCodes: true
       host: null
       port: 8011
   - file: uptimeHealthcheck
     params:
       url: url_to_poll
       intervalSeconds: 300
       method: get
uptimeApi— is an API that can be queried to get information about the current status of the BGPalerter process. By default the URL ishttp://localhost:8011/status. The API returns a JSON that contains a boolean fieldwarning. If BGPalerter is not correctly working, awarningis set to ‘true’ and the API will return an HTTP 500 status code. You can integrate this API in Nagios or services like UptimeRobot (free).uptimeHealthcheck— is a module that will periodically call the URL provided in the configuration. This can be easily integrated with services like Healthcheks.io (free).
Where is the data coming from?
BGPalerter connects to public data sources (not managed by NTT) and the entire monitoring is done directly in the application (there are no NTT servers involved).
A data source can be integrated with a connector component. In this way, you can also use your data if you would like.
Currently, BGPalerter connects automatically to RIS live, an amazing project by the RIPE NCC. RIS live collects BGP updates coming from more than 600 peers. The updates are streamed to BGPalerter in real time for an unprecedented detailed and responsive monitoring.
The data collected by RIPE RIS is publicly available — consider contributing to the project by peering with them.
For researchers
While for production purposes it’s usually enough to monitor some prefixes, for research purposes you might need to monitor the entire address space (for example, to investigate the average convergence time).
As such we’ve put great effort into making BGPalerter suitable for research purposes. In particular, the application is designed to be able to handle many more BGP messages than the current RIS live streaming produces in total, with a small CPU and memory footprint.
Additionally, researchers can implement their own monitor method focusing only on the conditions to verify in the BGP messages without worrying about the rest of the data handling. More information about that is here.
Many more advanced features are available and documented here.
Please get in touch if you have any feedback or require any requests:
- For feature requests and bug reports, open an issue here.
- For direct feedback, contact Massimo Candela at massimo [at] ntt [dot] net or on Twitter at @webrobotics.
Last but not least, consider contributing to the code!
Adapted from original post which appeared on RIPE Labs.
Massimo Candela is a Senior Software Engineer with NTT.
The views expressed by the authors of this blog are their own and do not necessarily reflect the views of APNIC. Please note a Code of Conduct applies to this blog.
Another story 🙂
https://github.com/a-kuzik/risinformer