

There is no doubt that Internet of Things (IoT) devices can deliver increased efficiency and cost-savings. Unfortunately, to keep costs down there are some IoT manufacturers that have compromised on the quality of their device’s security, which is costing organizations millions in ransom and reputation to fix.
IoT devices are relatively easy targets for malicious attackers who can use them to access networks and the confidential data they may hold, or recruit them into a network of compromised devices, called a botnet, to launch distributed denial of service (DDoS) attacks with the purpose of bringing down websites and servers. Such outages can cost organizations anything from USD 120,000 up to a couple of million.
Even when an attack fails, it can be costly: In 2018, the website of a security researcher was targeted by a botnet-powered DDoS attack. The attack failed to bring down the site, but estimates put the cost to the host of the blog at over USD 300,000.
Even detection can be problematic, as some variants of botnets, such as dark_nexus, have detection evasion features.
This requires researchers to think outside of the box, and one creative example uses graph theory — a branch of mathematics that uses mathematical structures to model pairwise relationships between objects — to visualize what the botnets are doing.
“A picture speaks a thousand words, but a graph says so much more; they help us gain actionable insights and make better data-driven decisions based on them,” says Raihana Syahirah Abdullah from Malaysia’s Universiti Teknikal Malaysia Melaka, who is heading up a project to analyse botnet behaviour across a range of IoT devices.
Spotting botnets among the noise
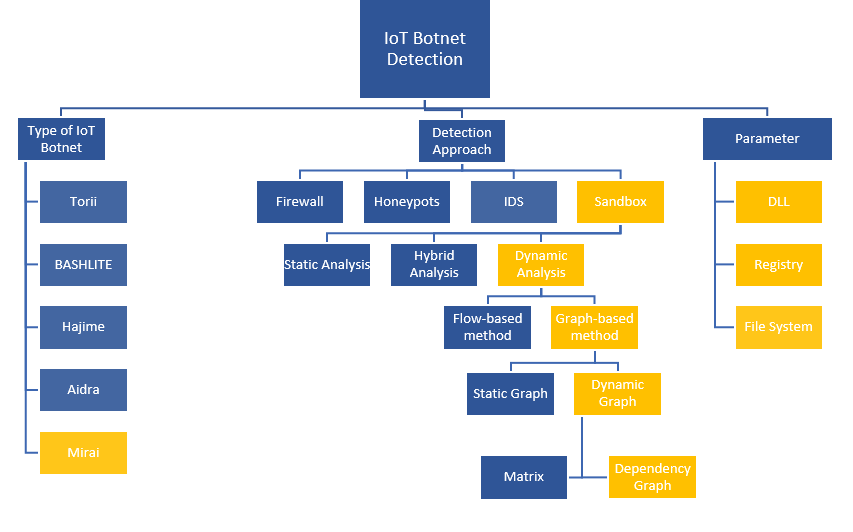
Typically, IoT botnet attacks focus on locations including the Windows registry, file system, and dynamic link library (DLL). The existing techniques to detect botnet activity involve firewalls, honeypots, intrusion detection systems (IDS), and sandbox techniques.
The approach of Raihana’s team was to use a sandbox technique incorporating graph-based, dynamic analysis to identify DLL, registry, and file system activity. They used the Mirai botnet as a case study because it was the first botnet of its type and has a particularly damaging track record.
“Mirai and its variants account for some of the largest and most catastrophic DDoS attacks in the world,” Raihana says. “Over the years botnet operators have tinkered with it to exploit IoT devices and systems, which are becoming more common and are easy targets due to their questionable security standards.”
Mirai is quite simple in some ways — it uses a list of common default passwords to gain access to home routers and network-enabled cameras, which have less robust protections than many other IoT devices. This technique allowed Mirai to control nearly half a million devices, launching large-scale DDoS attacks in 2017, with China and India at the time identified as economies among the most vulnerable to Mirai attacks.
Even today, the Mirai code is still repurposed and used in multiple botnets, including dark_nexus, which has been upgraded more than 40 times in 2020 alone.
Observing botnets in captivity
To observe the impacts of Mirai in a test environment, Raihana allowed a variant of it to run rampant in a Cuckoo Sandbox using a Linux/Unix platform. This can be more challenging than it sounds as there are a variety of methods used by malware programs to cover their tracks, such as domain generation and domain fluxing. They can also exploit safety vulnerabilities to disseminate malicious code.
The Cuckoo Sandbox produces a number of analytical reports that need to be examined for botnet activity. Raihana focused on the ‘svchost.exe’ process as this relies on a DLL process rather than simply being an independent executable file — which ties it to the registry and provides extra avenues for examining registry keys for malicious impacts.
If there are differences in this process, it may be a sign of malicious activity. For analysis, the svchost.exe process was chosen for all sample malware.
In Tables 1 and 2 we can see examples of two svchost processes, both from Raihana’s research. The first table is a benign example:
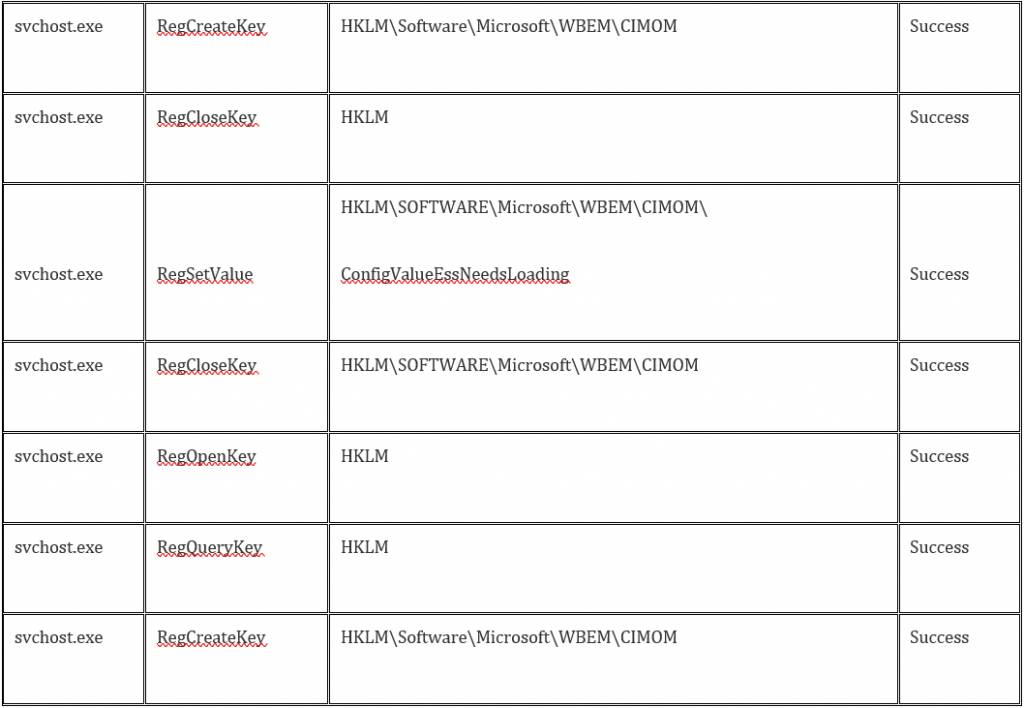
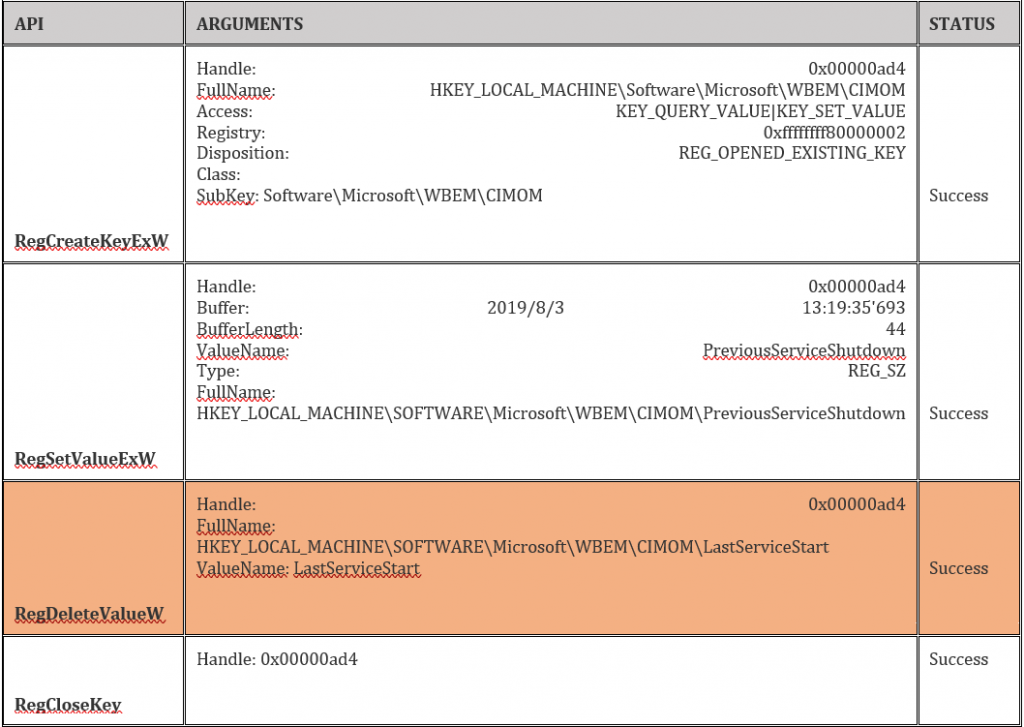
Table 2 is a malicious example. Note the highlighted deleted registry key.
Representing botnets in graphs
The project also involved mapping the activity of each botnet to gain a greater understanding of their behaviour and impacts.
“A graph theory detection approach can help to prevent an attack from being started, because a user knows the behaviour and attack pattern for the IoT device,” explains Raihana.
Five examples of malware were analysed using a Windows mirror capture and each showed very distinct patterns.
Take the following example:
Hkey_local_machine\software\microsoft\windows nt\currentversion\schedule
This registry key represents the P1 node in Figure 2. Each node represents a particular registry key being accessed. The lines represent sequences between various path nodes. Note that a given node could be accessed multiple times, meaning that more than one sequence can connect to a node. There were 14 nodes and 21 sequences.
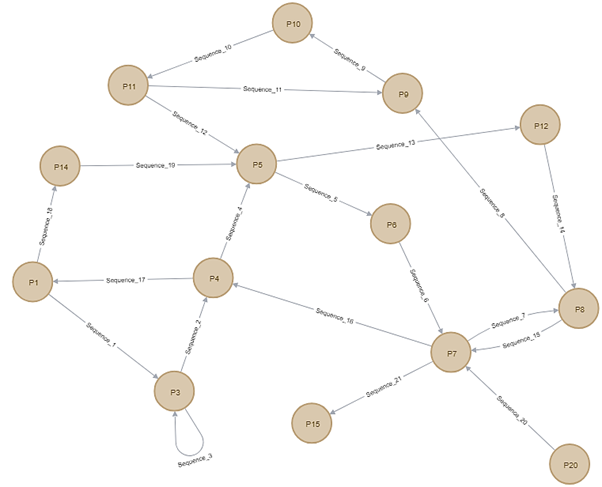
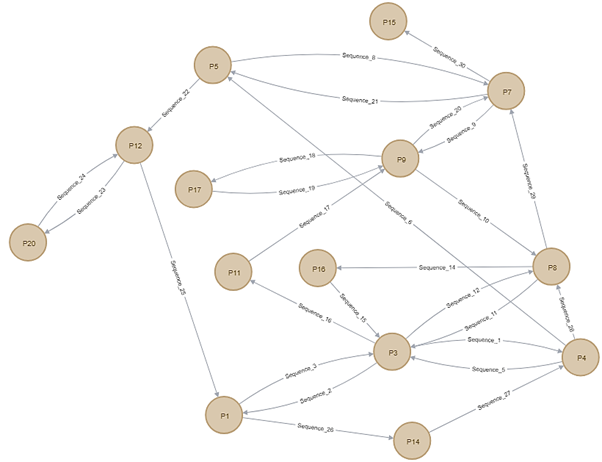
However, the behaviour of malware 2 was quite different as can be seen in Figure 3. The sequences here start from P3. P3 is the following registry key:
Hkey_local_machine\software\classes
Note that P3 is accessed multiple times as the malware accesses P3, then P1, then back to P3 again.
Once the graphs were generated, the team tested if these had the correct attack pattern. Tables listing the path taken by the malware in svchost were compared against these graphs, noting the frequency a given registry key was accessed. This allowed specific rules to be created.
“The registry key frequency is important for building the pattern of Mirai malware,” says Raihana.
Applying the research
The model Raihana’s team is developing could lead to a host of new tools for administrators to examine their networks and spot botnet activity, and will play an important role in further mitigation of threats to IoT devices.
“Multidisciplinary research is the solution to this problem where computer scientists, psychologists, economists, systems analysts, and software engineers can work together to provide innovative research that addresses various aspects of the problem,” she says.
This research was supported through the APNIC Foundation ISIF Asia 2018 grants, under the Internet Operations Research Grant funded with APNIC contribution. A USD 13,000 grant was awarded to the Faculty of Information Technology Communication at Malaysia’s Universiti Teknikal Malaysia Melaka.
You can find the full report on the ISIF Asia website.
The views expressed by the authors of this blog are their own and do not necessarily reflect the views of APNIC. Please note a Code of Conduct applies to this blog.