

Monitoring networks and services is crucial to ensure their quality and security. As this can be a time consuming and monotonous process, there is a growing tendency and need to automate this.
A Distributed Measurement System (DMS) is one solution, which deploys devices over networks, embedding applications that periodically measure some network features (for example, routing and traffic) or services (for example, content-delivery and web quality). These measurements are then sent to servers for dashboarding, alerting, and so forth; and are further used to better understand the behaviour of networks and services.
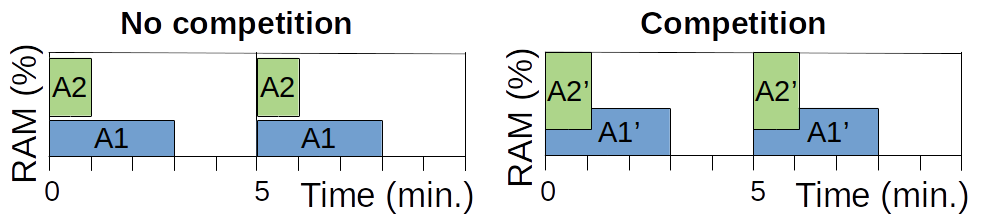
Designing a DMS is challenging especially as they must scale and provide reliable measurements — when many applications are co-located on the same machines, issues such as resource shortage can arise, which can lead to measurement inaccuracies (Figure 1).
While there have been improvements on orchestration technologies allowing better control and deployment of applications, this still remains a difficult task: it is a matter of satisfying new demands and optimizing resource allocation and the scheduling of tests to ensure the accuracy of the monitoring system.
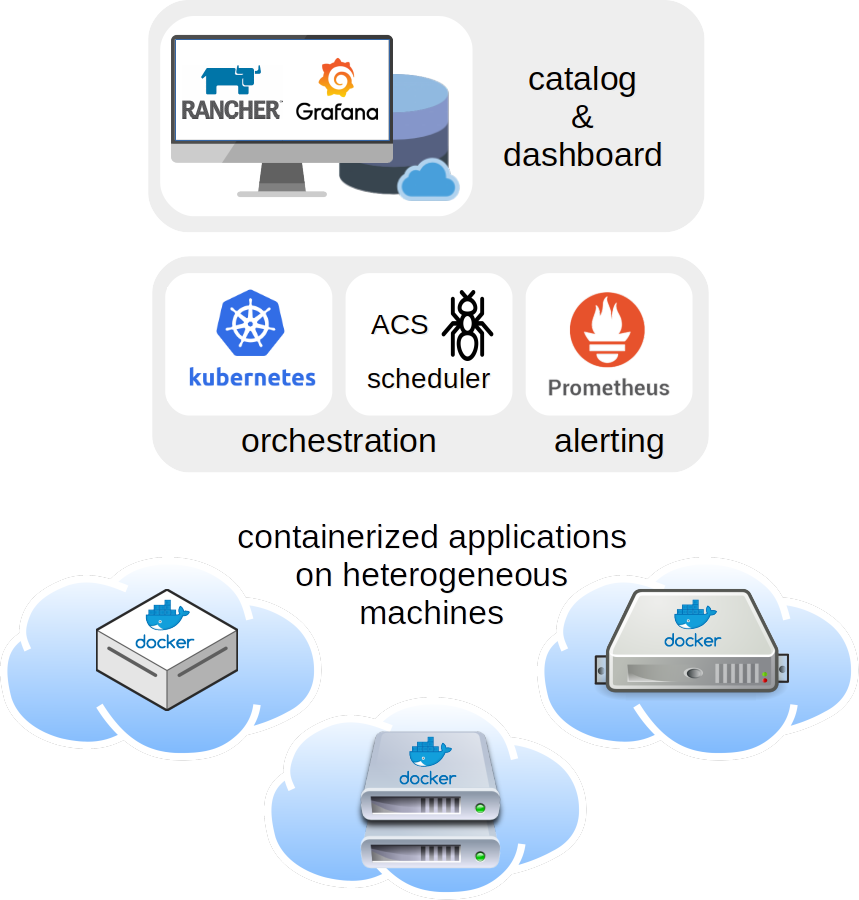
To this end, we, at Orange Labs, have been trialling Network Management as a Service (NMaaS), an open-source, publicly available platform, which enables you to deploy and manage containerized measurement applications on a pool of physical machines (Figure 3). As part of this trial, we’ve added a scheduler to ensure applications do not compete for resources.
NMaas enables you to address two main use-cases:
- Private DMS — people can download an NMaaS instance and deploy it on nodes in their network(s) to measure the performance of their network(s) and services.
- Public DMS — people can download an NMaaS instance and deploy it on nodes over potentially multiple networks to set up a large-scale public DMS.
A NMaaS instance is accessible via an online application allowing you to:
- Choose measurement applications from a predefined catalogue to be deployed on machines in the network.
- Visualize and manage their pool of machines, as well as the measurement applications deployed on them.
- Examine the results of the measurements and alerts raised.
The main roles in an NMaaS environment should be defined as follows:
- User: registers for credentials to deploy apps and run tests.
- Node Owner: deploys and manages physical devices in networks.
- App Developer: submits apps to be added to the catalogue.
- Validator: checks for security on nodes, apps and users.
Platform overview
NMaaS tackles several common measurement and monitoring tasks that can be easily dealt with using open-source solutions (because we want this project to remain open-source, flexible and open for contribution).
Below are the current tasks that users can manage using our setup:
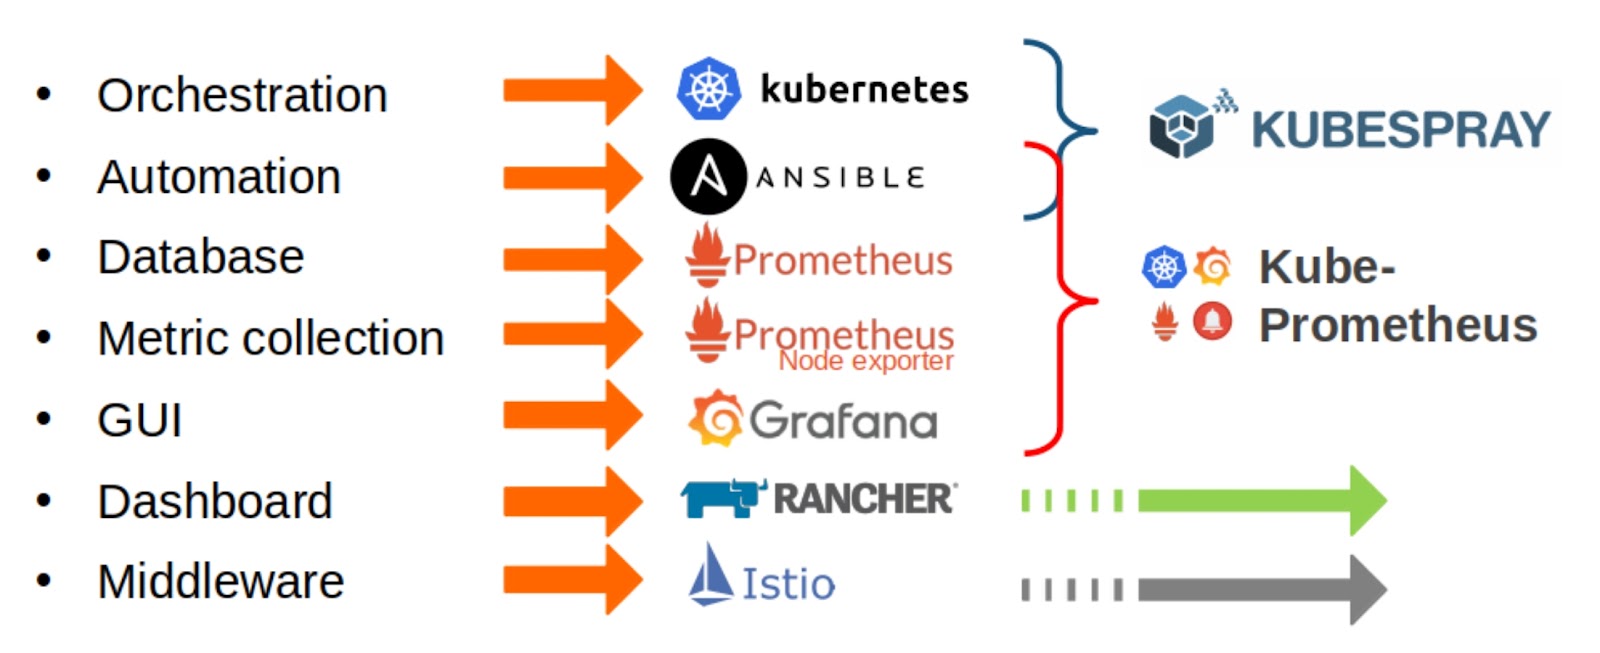
- Orchestration is an efficient way to manage a pool of equipment. Since Docker is used as a container tool, the cluster will be orchestrated thanks to Kubernetes.
- Configuring every server added to the platform calls for automation, a service which Ansible enables.
- The collected data should be stored in a database. In this case, Prometheus is tailored to handle metrics.
- Data collection should be considered to standardize the output of any deployed application. Hopefully, with the Prometheus database comes its metric collector Node exporter that acknowledges new pieces of information to query.
- All the gathered data needs to be illustrated on a graphic user interface for users to have a quick live overview of their network state. Grafana fits this job perfectly with its display of customizable graphs.
- A dashboard delivers a proper deployment of applications, but the Kubernetes dashboard is lacking in features. However, Rancher includes the catalogue feature that lets us choose applications from a private repository.
- The conjunction of all these modules hinders the data flow without a middleware to administer it accordingly. The mesh of microservices is made easier with Istio.
Furthermore, our setup has benefitted from previous open-source projects, including:
- The automated deployment of a Kubernetes cluster on a pool of machines, made available with Kubespray.
- The implementation of a monitoring system on a Kubernetes cluster, which exists through Kube-Prometheus scripts.
At the time of writing, the implementation of Rancher is currently underway, which will be closely followed by the addition of Istio later on.
Moreover, these solutions provide the following added value:
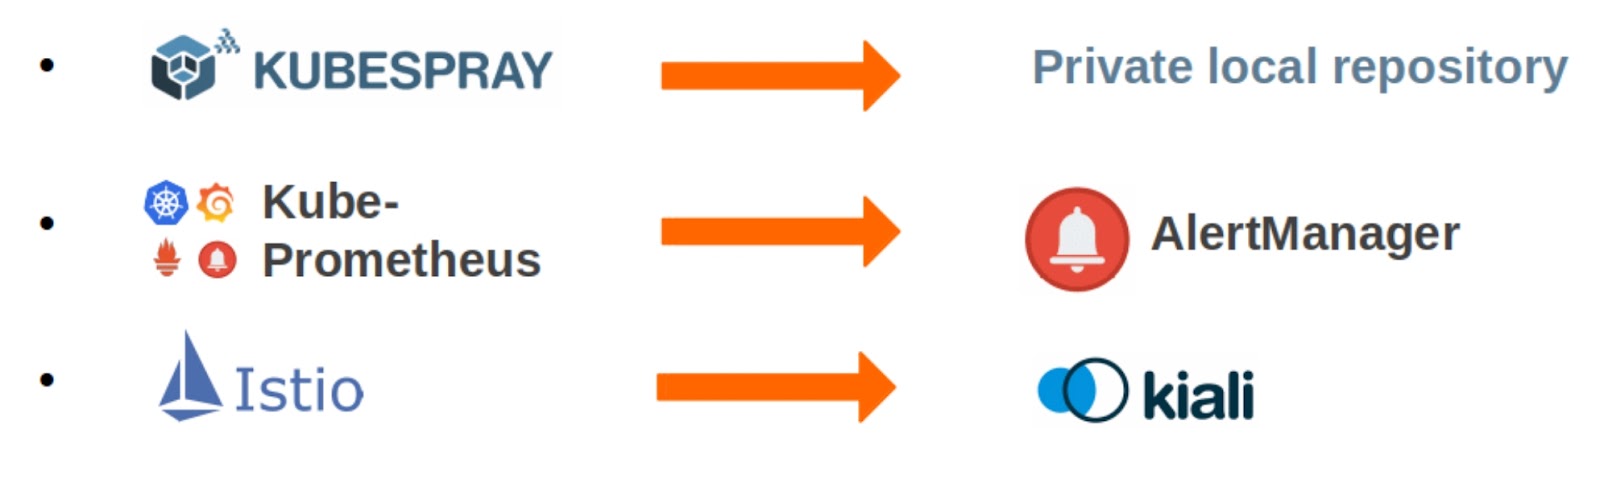
- While Rancher displays an application store to the user, Kubespray allows the creation of a private local repository to store these applications while initializing the cluster.
- AlertManager is included in the Kube-Prometheus monitoring system. It’s a module notifying users whenever a metric reaches a specific threshold, whether it affects the analysed network or the nodes themselves.
- The Istio middleware is supported with Kiali, a GUI to visually operate the data flow among nodes and their hosted applications.
Under the hood
We added a scheduler to our NMaaS setup that brings together different strategies into an innovative allocation and scheduling policy. Impressively, it can do all of the activities below without overloading computation resources:
- Deploy on-demand measurement applications.
- Respect applications’ periodicity and delay.
- Take into account affinity and anti-affinity applications.
- Readapt the system through container migration over a fine-grained time horizon.
The easy and rapid integration of applications to the platform is a key feature of our NMaaS setup and is made possible thanks to the catalogue system and its container-based architecture.
The first catalogue contains: an IP spoofing detection app; a web (resp. streaming) QoS measure app; and a web (resp. streaming) cartography app.
The goal is to motivate users (you) to propose new apps to be added to the catalogue.
In the following example of our NMaaS platform, I will use various nodes and links to clear up some challenges:
- Kubernetes works as a Master-Worker model, so our NMaaS platform does this as well. Here, the Master can also be a worker.
- The nodes can work on the same LAN or on different LANs.
- The NMaaS platform can be installed from one’s own machine, which is depicted here as the Installer.

Here is a macro overview of the deployment :
- Step 1: Register all the nodes from the Installer with the automation tool (Ansible).
- Step 2: Initiate the registered nodes cluster with the orchestrator (Kubernetes).
- Step 3: After deploying the NMaaS platform, the pool of equipment might grow. Consequently, the process will be the same to scale with additional nodes. Just repeat Steps 1 and 2 for the new server, wherever it is located.

Masters and Workers get their own automation agent (Ansible) and orchestration agent (Kubernetes) with Docker included, and their membership to the cluster enables inter-communication through a container network tunnel.
Here is a micro overview to understand what is happening to the nodes afterwards.
- Step 4: Install the required modules through automation (Ansible), which are affiliated to the database (Prometheus), metric collector (Prometheus Node Exporter), GUI (Grafana), dashboard (Rancher) and middleware (Istio).
- Step 5: Link additional modules with the middleware (Istio). As the list of microservices grows, it might be wise to distinguish their use by linking them manually. It can also be used to link two applications that need to communicate between themselves only in order to work.
Workflow
The basic endeavour of a user goes like this:
- The user chooses and deploys its applications from the dashboard (Rancher).
- Then, the query is ordered to the orchestrator (Kubernetes), which will assign it to the designated worker through the cluster tunnelling.
- Once the applications are up and running, the metric collector (Prometheus Node Exporter) collects them and stores them on the database (Prometheus).
- Finally, the user can check the GUI (Grafana) to visualize graphically the results of these applications.
Security
For the node credentials, Ansible Vault plays around with the YAML variables to run its playbook. This tool tags along the Ansible specifically to encrypt sensitive variables and files them behind a vaulttext by concatenating the ciphertext and a SHA256 digest. See the user guide.
For the nodes themselves, the NMaaS runs in a cloud fashion, and thus trusts one’s own infrastructure. If anything, a VPN is recommended to ease the deployment. Furthermore, Kubernetes adds a layer for all API traffic and authentication, using X.509 generated certificates and role-based access control. For a user to access an application, Kubernetes uses entities called ‘services’, which expose specific endpoints as HTTPS. See the user guide.
How to deploy
Deploying the NMaaS platform is quick and does not require advanced knowledge to perform.
Step 1: Set up the environment
Exchange SSH keys:
sudo apt install openssh-server
ssh-keygen
ssh-copy-id {user}@{node}
Checkout your Kubespray and Kube-Prometheus preferred version if needed:
git clone https://github.com/kubernetes-sigs/kubespray.git
git clone https://github.com/coreos/kube-prometheus.git
Install the required modules:
sudo pip install -r requirements.txt
Step 2: List your nodes
Populate your pool of machines in inventory/hosts.yml with their IP addresses (the given example uses 1 master and 2 workers). Secure your credentials with Ansible Vault for each node (the given example checks for a machine called node1) and create an individual folder:
sudo mkdir -p inventory/host_vars/node1/
Write an inventory/host_vars/node1/vars file for undisclosed sensitive data, following this template:
ansible_user: "{{ vault_ansible_user_node1 }}"
ansible_port: "{{ vault_ansible_port_node1 }}"
ansible_become_password: "{{ vault_ansible_become_password_node1 }}"
Create a inventory/host_vars/node1/vault file where sensitive data is encrypted:
ansible-vault create inventory/host_vars/node1/vault
Save your credentials, following this template:
vault_ansible_user_node1: ssh_user
vault_ansible_become_password_node1: sudo_password
vault_ansible_port_node1: port_number
Concatenate every created vars file into one:
ansible-vault view inventory/host_vars/node*/vault >
inventory/host_vars/vault && ansible-vault encrypt
inventory/host_vars/vault
Step 3: Deploy the platform
Test the SSH connection and credential authentication from Ansible:
ansible all -i inventory/hosts.yml -m ping --ask-vault-pass
Launch it:
ansible-playbook -i inventory/hosts.yml --become --become-user=root
init.yml --ask-vault-pass  -e@inventory/host_vars/vault -vvv
Check if everything runs smoothly:
sudo ./inventory/artifacts/kubectl.sh --kubeconfig
inventory/artifacts/admin.conf get all --all-namespaces
This post is based on our NANOG 79 and IEEE/IFIP NOMS 2020 presentations. Read our paper and check out our slides.
Contributors: Anthony Lambert and Bryan To Van Trang (Orange Labs).
Raquel Rugani Lage is a research engineer and PhD student at Orange Labs and Telecom SudParis.
The views expressed by the authors of this blog are their own and do not necessarily reflect the views of APNIC. Please note a Code of Conduct applies to this blog.