
Back in 2017, I wrote a blog piece on the five-year view for IPv6 that explored the logistic supply curve. Like all good articles on curve-fitting it came with a mandatory health warning: The first thing to observe about this graph is that it is highly speculative.
So two years in to a five year view, how are we tracking? Has the story got any clearer?
Alas, the answer is both yes and no.
When I wrote the post in 2017, the IPv6 world was significantly simpler. A total of 15 economies represented over 95% of all visible IPv6 at scale, adjusting for the world population per economy and our measurements.
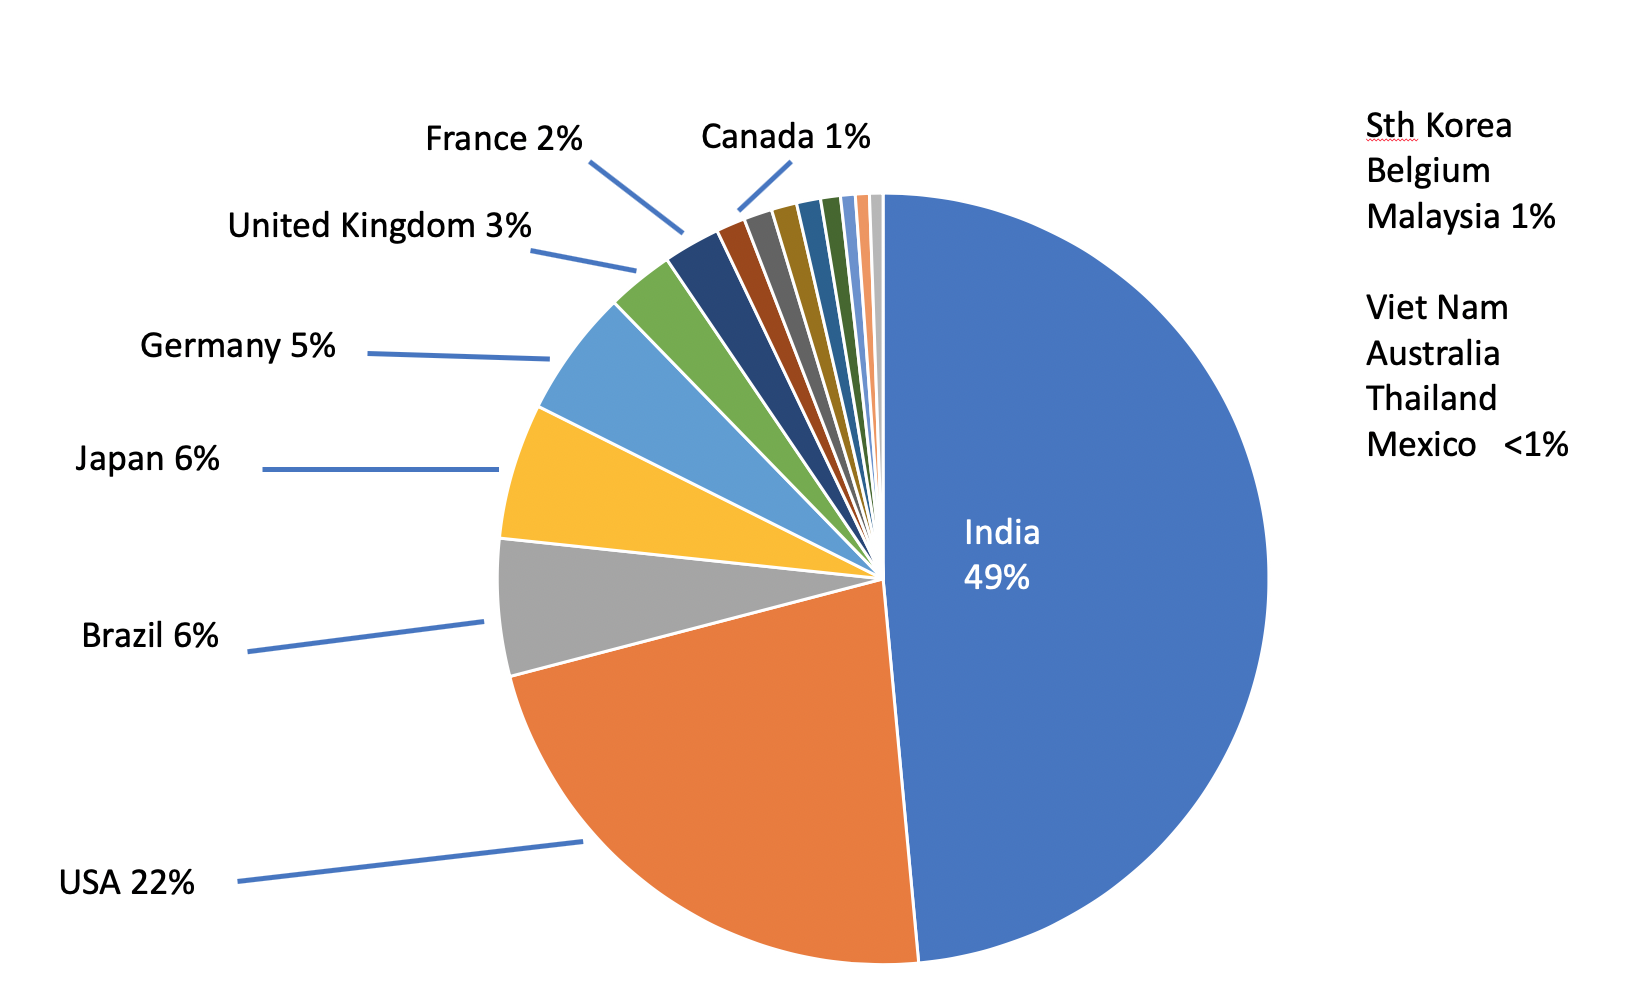
Figure 1 — Top 15 economies in 2017, contributing to 95% IPv6 of the world.
Let’s have a look at the top 15 rankings now.
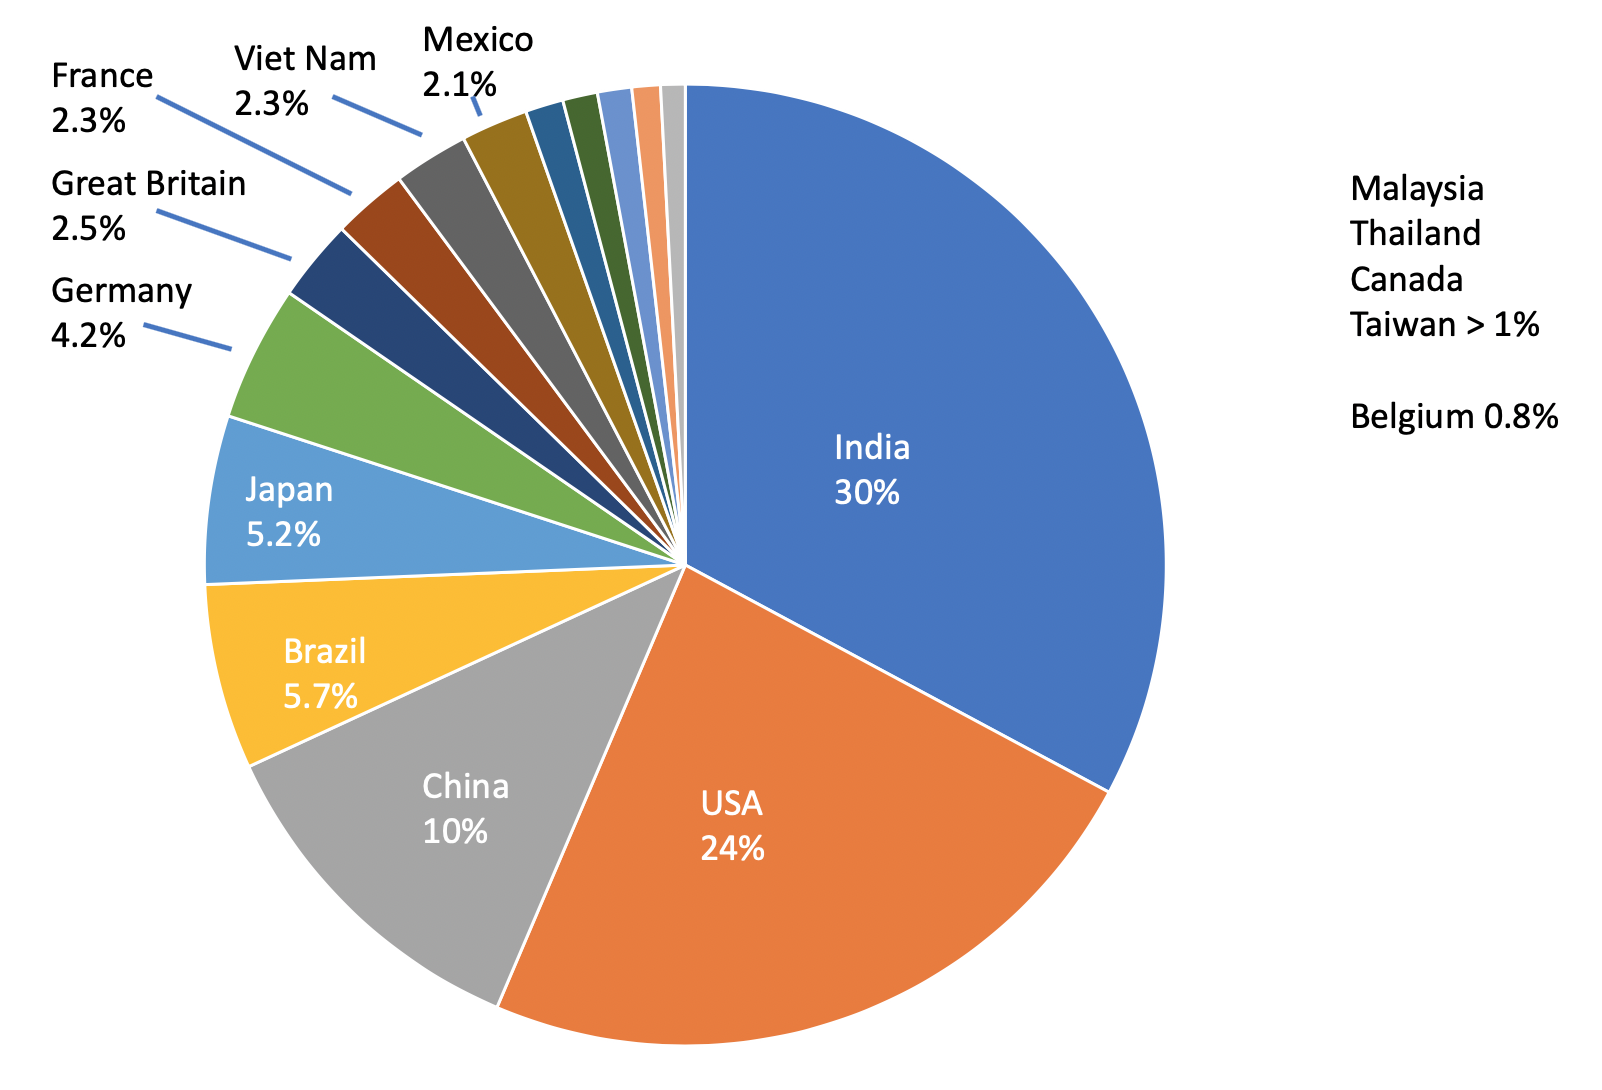
Figure 2 — Top 15 economies for IPv6 in 2019.
The single largest change is that China has now taken third place in the ranking, and contributes significantly more global IPv6 than 12 other economies. And, with a stated national plan to deploy significant IPv6, it is very likely over the coming two to three years there will be a continued increase in IPv6 inside China.
Read: IPv6 in China
A second significant change is that these 15 economies do not represent 95% of global IPv6 any more — they are actually now closer to 90%. This is because of a significant rise in other economies with IPv6 deployments. To get to 95% coverage you have to count 22 economies in total.
The economies, by cumulative contribution to world IPv6 data
| Rank | Economy code | Economy name | IPv6 capability (%) | IPv6 world population (%) | Cumulative total (%) |
| 1 | IN | India | 48.14 | 30.130 | 30.130 |
| 2 | US | United States of America | 56.49 | 21.631 | 51.761 |
| 3 | CN | China | 11.01 | 10.742 | 62.503 |
| 4 | BR | Brazil | 30.86 | 5.723 | 68.226 |
| 5 | JP | Japan | 34.16 | 5.202 | 73.428 |
| 6 | DE | Germany | 43.82 | 4.186 | 77.614 |
| 7 | GB | United Kingdom of Great Britain and Northern Ireland | 30.84 | 2.515 | 80.129 |
| 8 | FR | France | 31.12 | 2.317 | 82.445 |
| 9 | VN | Viet Nam | 34.71 | 2.311 | 84.757 |
| 10 | MX | Mexico | 26.37 | 2.067 | 86.824 |
| 11 | MY | Malaysia | 40.1 | 1.173 | 87.997 |
| 12 | TH | Thailand | 27.59 | 1.075 | 89.072 |
| 13 | CA | Canada | 24.33 | 1.055 | 90.127 |
| 14 | TW | Taiwan | 35.24 | 0.879 | 91.006 |
| 15 | BE | Belgium | 56.17 | 0.756 | 91.762 |
| 16 | RU | Russian Federation | 5.59 | 0.756 | 92.517 |
| 17 | KR | Republic of Korea | 12.67 | 0.734 | 93.251 |
| 18 | AU | Australia | 19.19 | 0.538 | 93.789 |
| 19 | SA | Saudi Arabia | 13.89 | 0.403 | 94.192 |
| 20 | AR | Argentina | 8.87 | 0.364 | 94.556 |
| 21 | PL | Poland | 9.84 | 0.357 | 94.913 |
| 22 | NL | Netherlands | 16.27 | 0.344 | 95.257 |
What does this mean for long term trends?
The future state of the graph is likely to continue to confound simple logistic curve fits. The trends at a national level are more about competition and capital investment, and state-directed activity, than they are about aggregate choices made by individuals.
Firstly, things didn’t continue in a simple linear/logistic curve manner
It is clear that the smooth trajectory of IPv6 deployment worldwide has not continued unchanged. In the APNIC Labs data it is easy to see there has been some change in the aggregate pace of deployment.
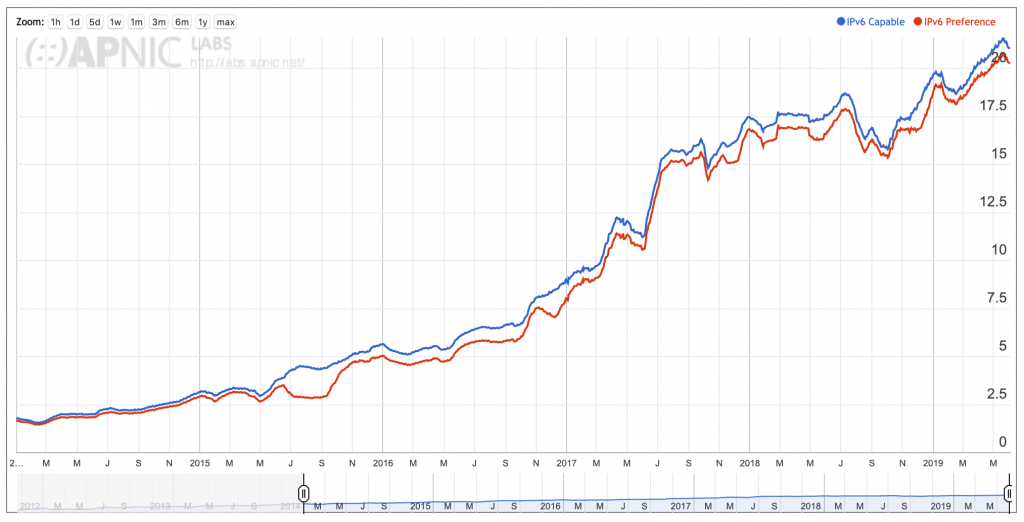
Figure 3 — World IPv6 capability and preference (Source: APNIC Labs).
This shows that since July 2017, there has been a period of much less intense deployment, and then a continuance at a lower pace overall, but at broadly the same levels. The variances in the chart are in part caused by changes in the experiment systems reachability and load but may also indicate periods where for whatever reason, IPv6 capability went backwards. Perhaps some AS owners disabled it, or there was a drop in connectivity in the APNIC Labs measurement system. So, since the 2017 story was a curve fit, clearly we would have to say from this data, the curve presented there no longer fits — we moved to a different rate of deployment. That’s the ‘yes’ part.
Let’s look at what’s been happening inside some economies
On the ‘no, its not clear’ side is the exposed story about individual ASes and economies, which suggests something more interesting has been going on underneath. Let’s look into things a bit more closely.
Here’s the current state of play in the United States of America. It’s the same data source, but charted to combine multiple ASNs into one display. It’s the top 10 ASNs in the USA by sample count, which is a rough approximation to eyeball share, assuming advertising placement is random within an economy.

Figure 4 — Top 10 IPv6-enabled ASNs in the USA by sample count.
OK, OK, it’s a messy chart. But, think about this: every line is a competing ISP in the US market, and at least 8 of the 10 ASNs are showing significant IPv6 activity, well beyond 25%. There are at least two that are north of 85%, which suggests the vast majority of their customers are using IPv6 almost all the time. This is a market with significant IPv6 deployment.
Lets look at India, a favourite since Reliance Jio deployed its clean-build IPv6 LTE network.
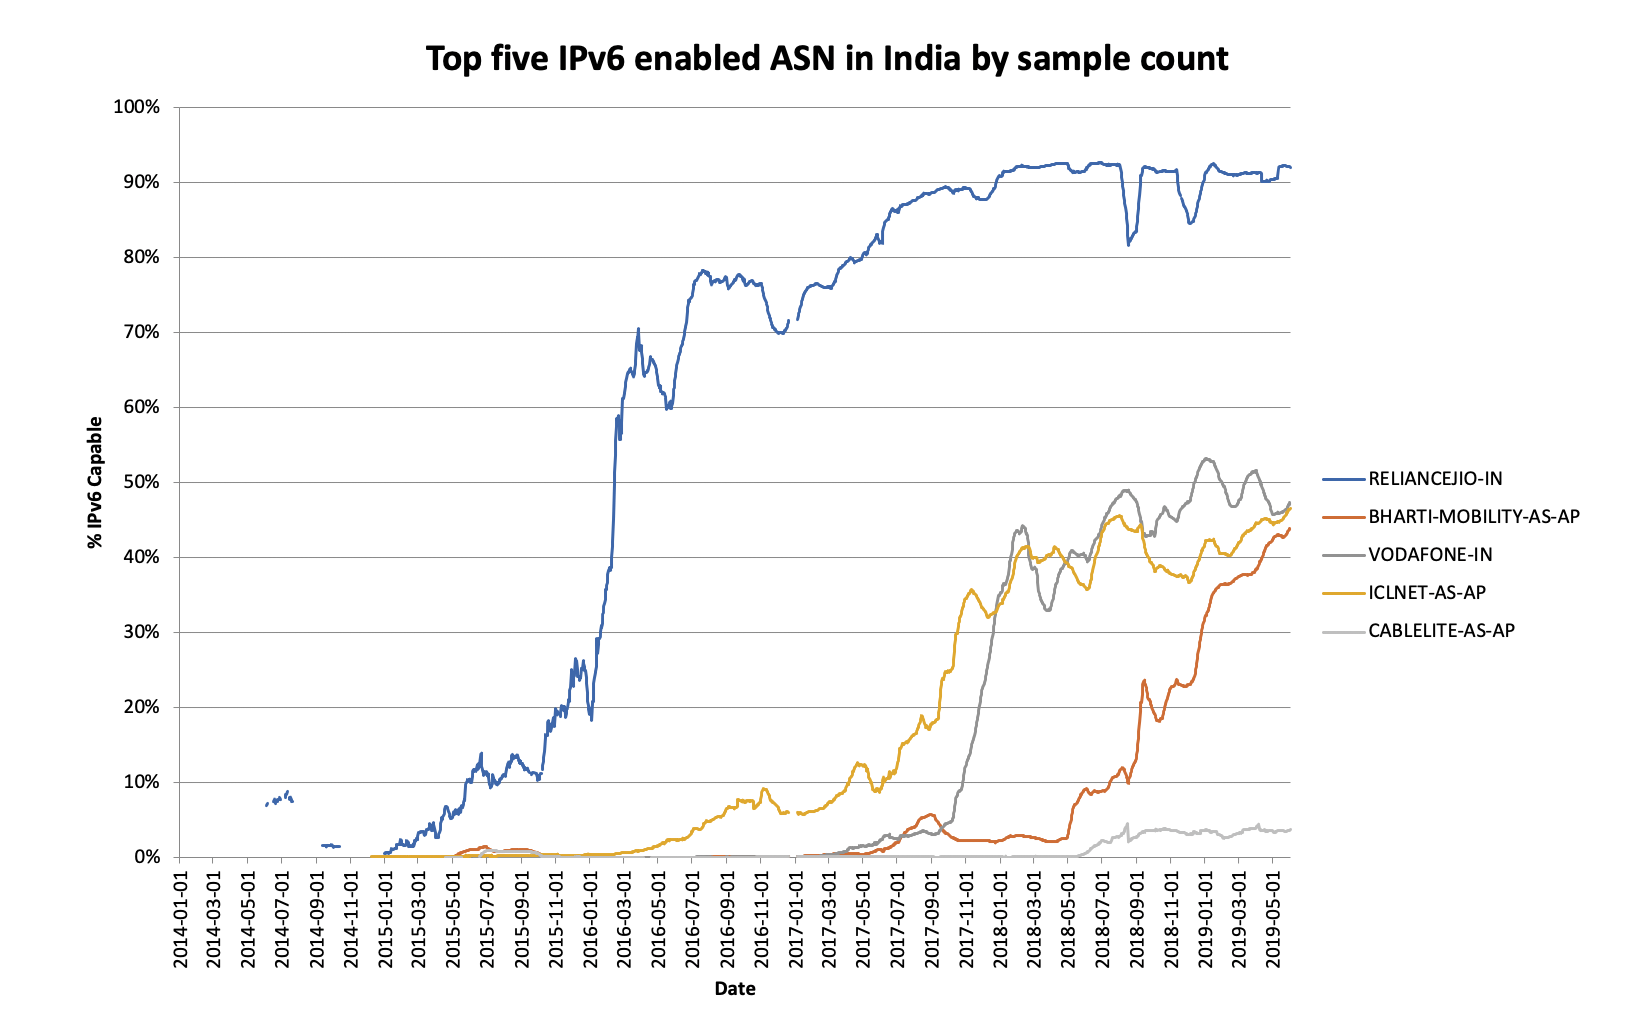
Figure 5 — Top five IPv6-enabled ASNs in India by sample count.
Since 2017, three other ISPs have entered the IPv6 market, and appear to be making large deployments. Not shown in this chart is the percentage sample count by ISP, but if we consider that Reliance was a small (15th ranked) ISP before deployment and then became the largest ISP by volume in the period of one year, it is reasonable to suggest the other ISPs have been strenuously attempting to recover market share by aggressive pricing and marketing. Although they have IPv6 deployments, they are still a work in progress and so perhaps some of the decline overall in IPv6, is because market share has swung away from a provider like Reliance, to the other large networks?
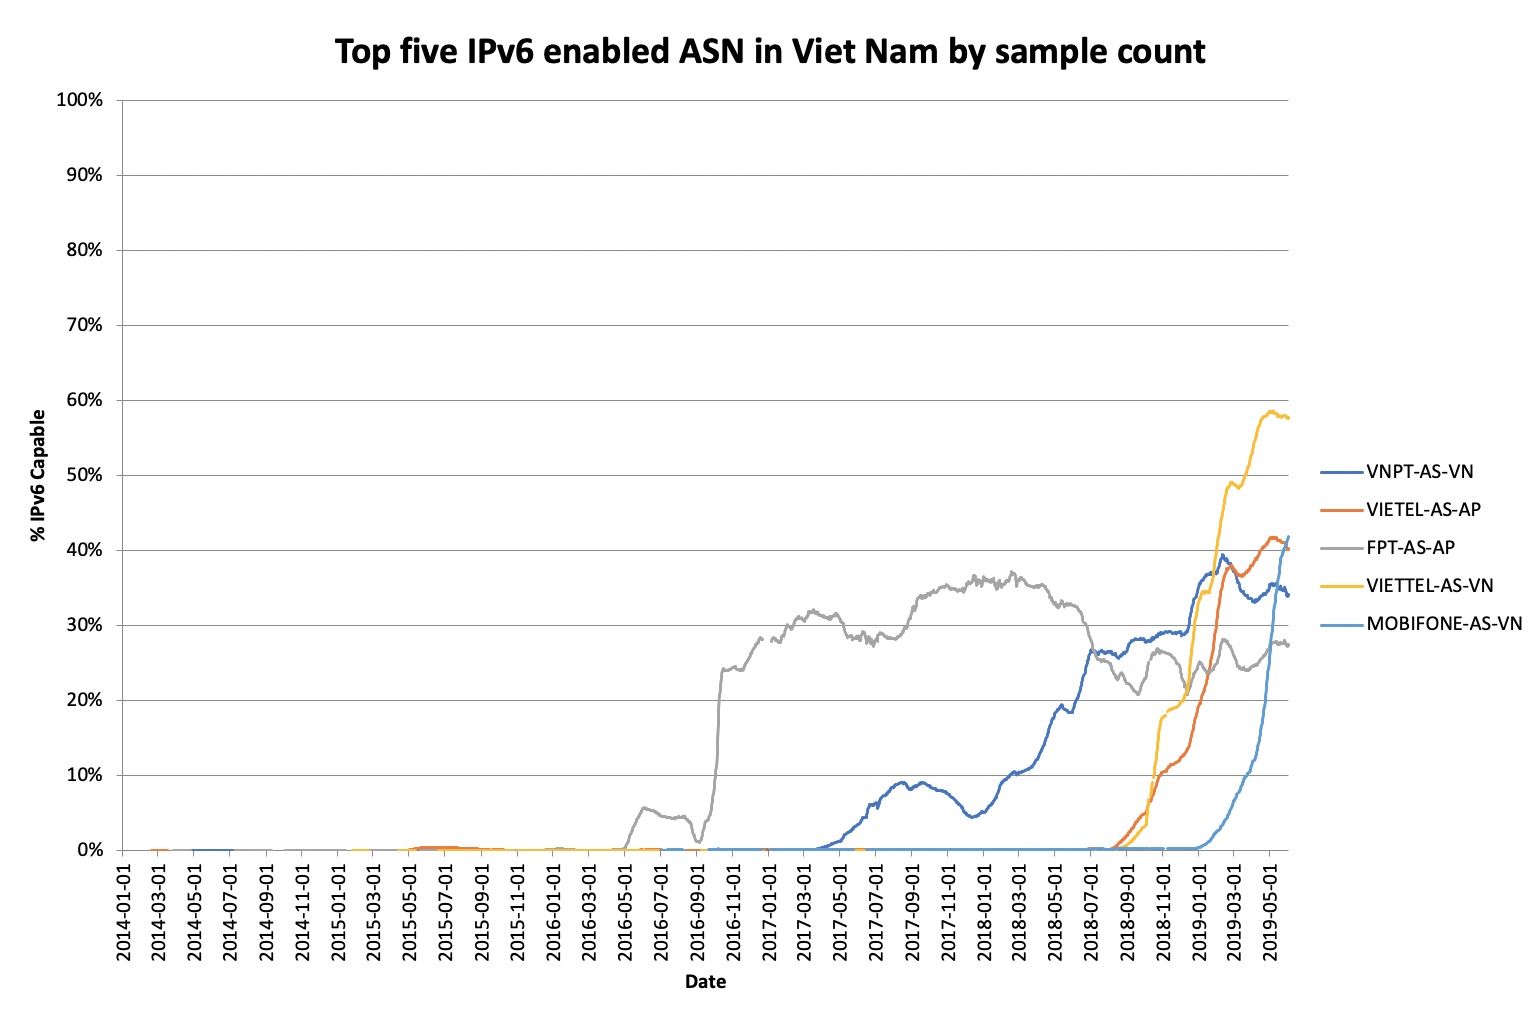
Figure 6 — Top five IPv6-enabled ASNs in Viet Nam by sample count.
A competitive market with significant coordination amongst the ISPs, Viet Nam initially had a single deployment by FPT. Subsequently the economy has seen four other large ISPs enter the market. This is still an early stage of deployment but the trends suggest there will be further growth in IPv6 inside the economy.
Or we can look at Thailand.
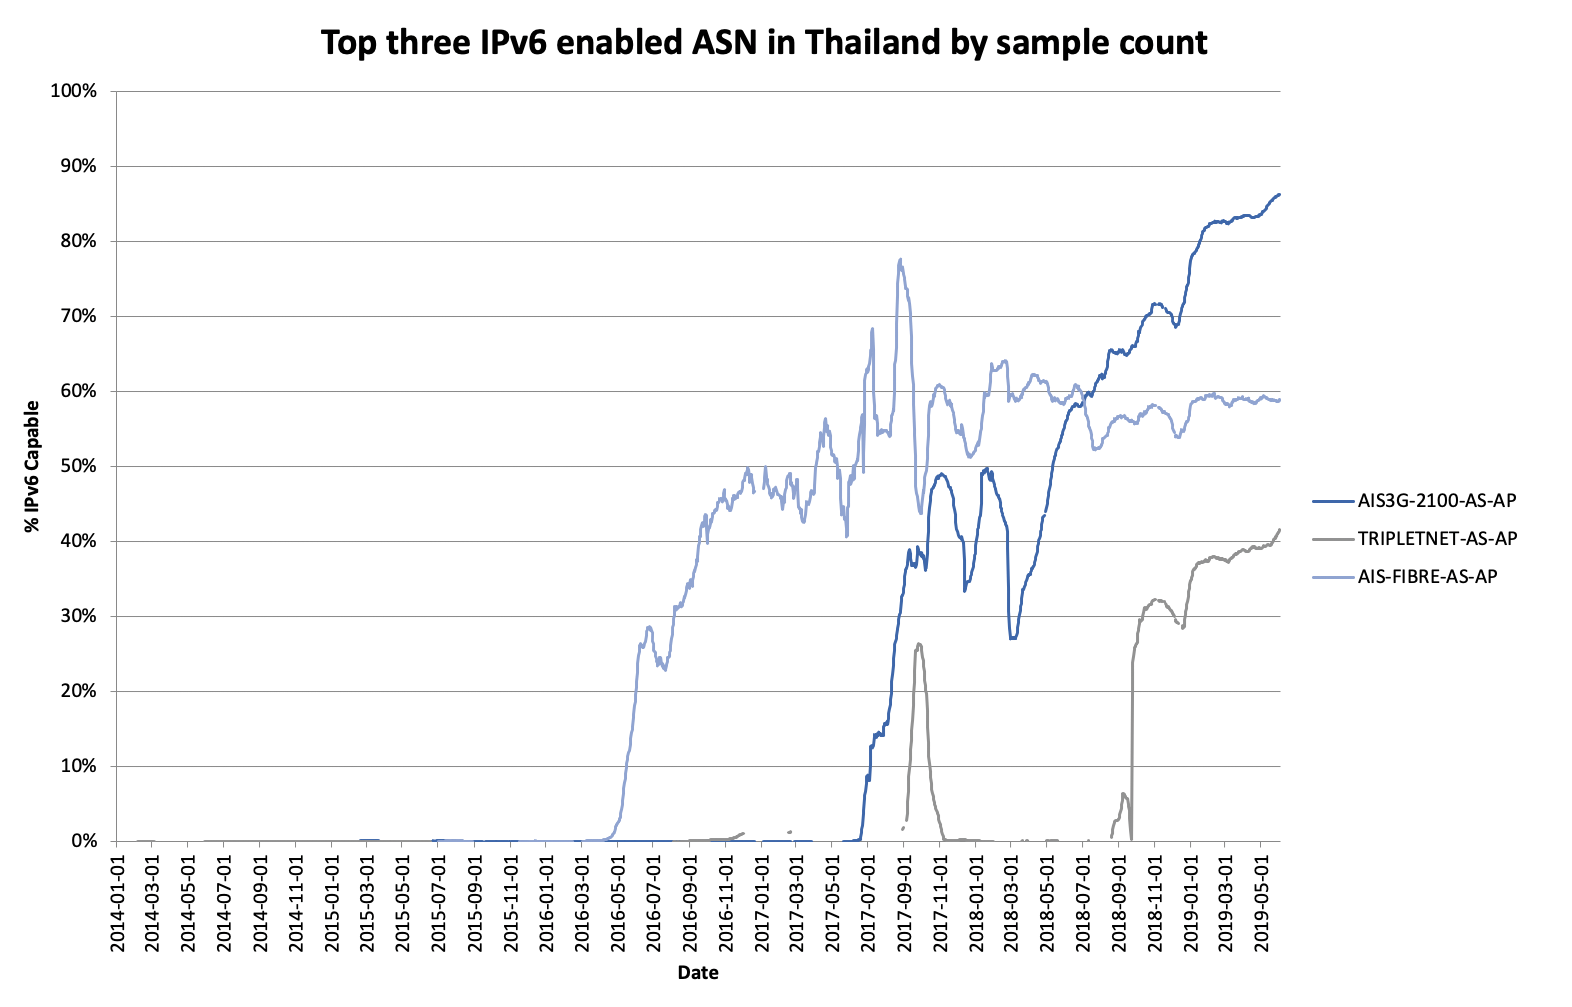
Figure 7 — Top three IPv6-enabled ASNs in Thailand by sample count.
Again, we can see that in a fully commercial competitive market, two large ISPs have made significant deployments in the last two years (AIS appears twice in this chart, once for its AS for its fibre business, the second time for its AS for its mobile business). These deployments are happening at scale, and have taken the economy to 27% capability overall.
Another thing is that some newer large economies have started appearing in the IPv6 sample set: Russia, Mexico and China. Let’s have a look.
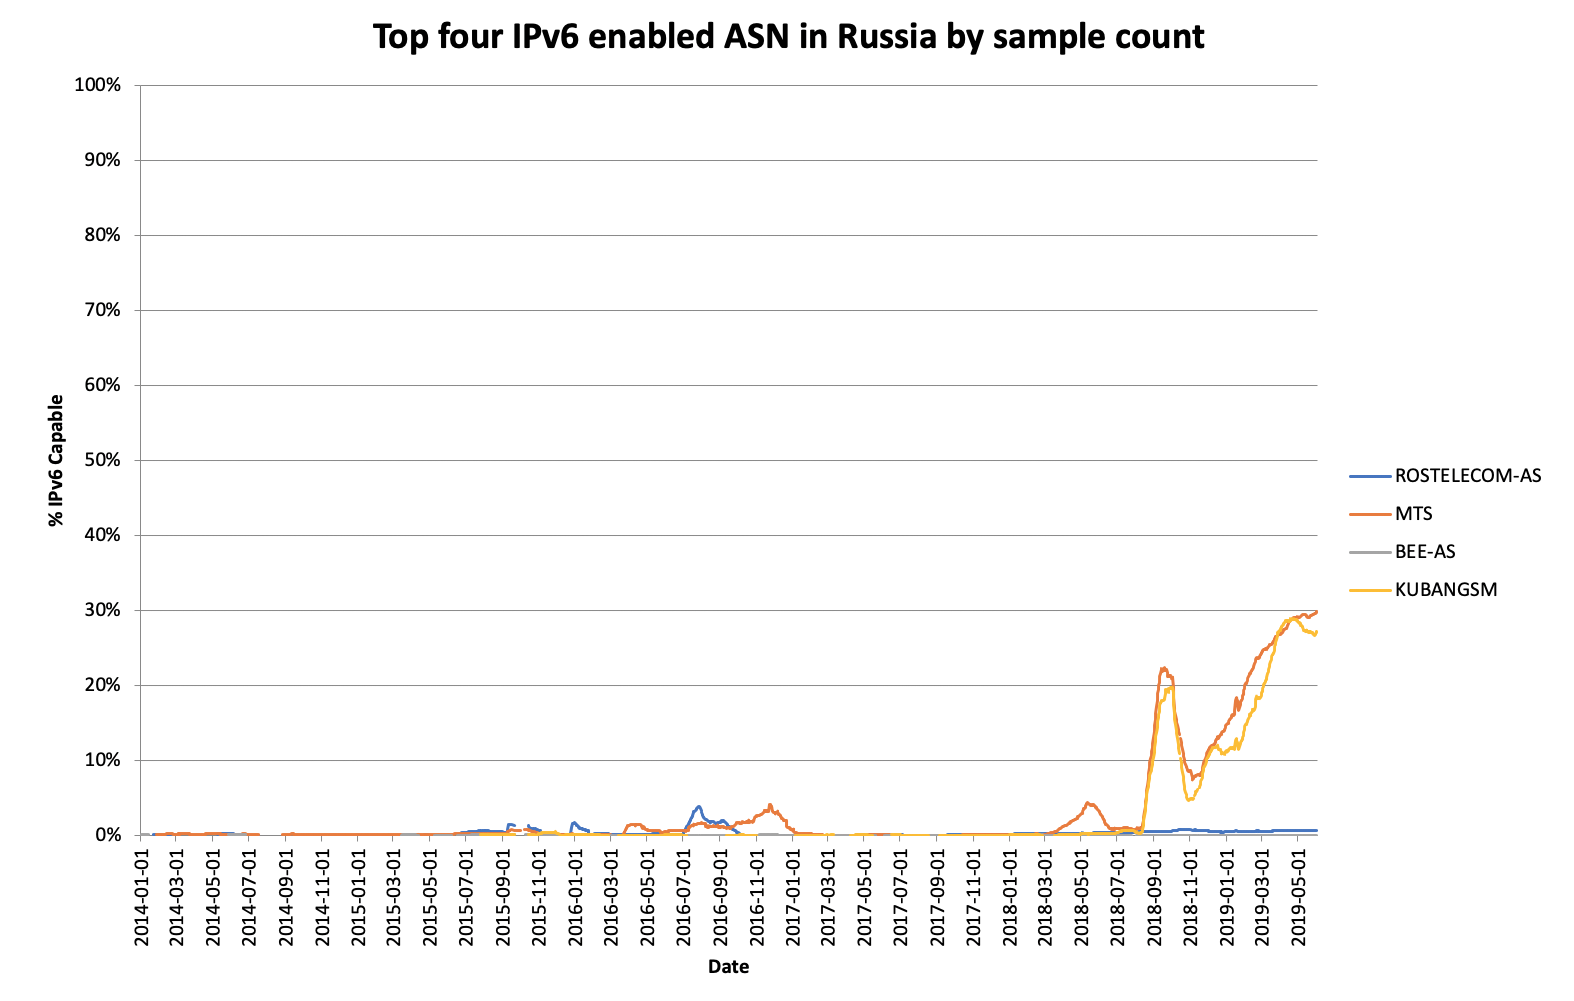
Figure 8 — Top four IPv6-enabled ASNs in Russia by sample count.
Of the top four ISPs by sample count in Russia, two are now in early stage deployment of IPv6. This is a competitive market, but with limited competition at scale in IPv6 at this time. Therefore, a lot of samples from Russia are likely to still show low IPv6 capability.

Figure 9 — Top 10 IPv6-enabled ASNs in China by sample count.
China has declared a national-strategic goal of deploying IPv6, and we can already see strong signs of this deployment from a mix of AS numbers across China Mobile, China Telecom and China Unicom. Because of the federated structure, the deployment story in China is not consistent, and it may be some time before we see a single coherent IPv6 capability, but it is clear the deployment is taking place at scale.
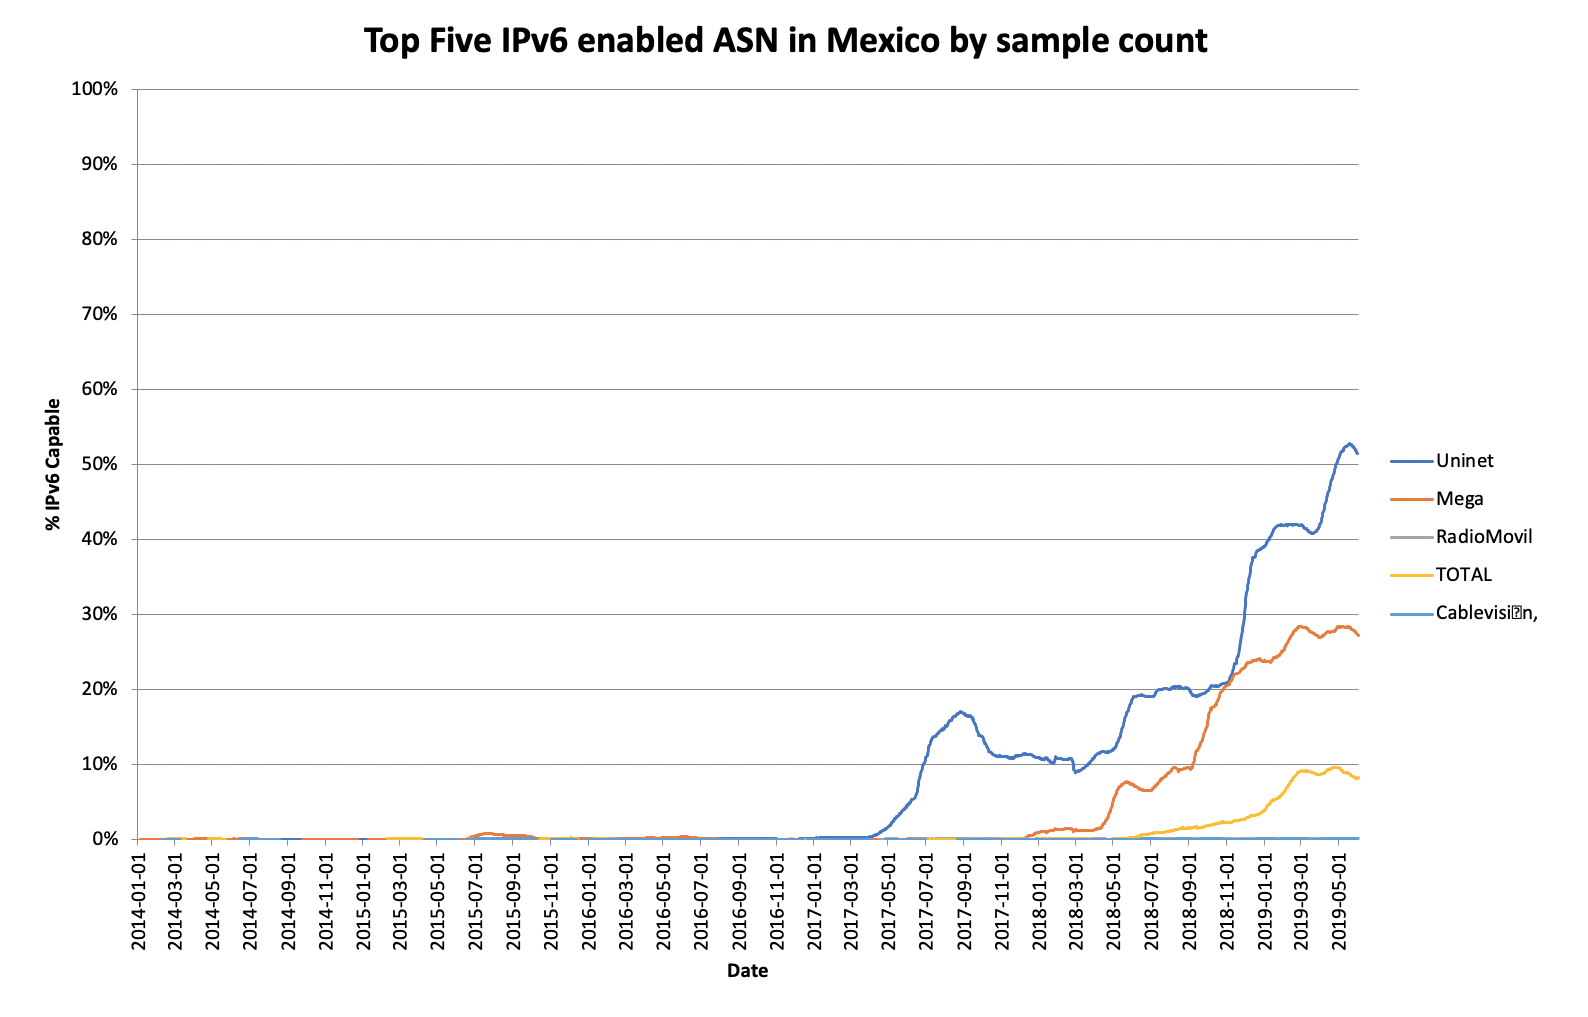
Figure 10 — Top five IPv6-enabled ASNs in Mexico by sample count.
Mexico is a less competitive market with a single large ISP. Called ‘Uninet’ here because of the registration of the ASN, this is TelMex, which is five times the size of its nearest competitor. However, even bearing this in mind, we can see that at least three large competing ISPs in Mexico have begun their IPv6 deployment.
Competitive pressures
Where a single ISP like Reliance Jio makes a huge move in the marketplace and secures significant market share, it is inevitable that there is some kind of reaction from its competitors. There was no overt signal in India that “IPv6 is better” but the decision to deploy IPv6 formed part of the logic, because we can see the reaction from competing telcos was to deploy IPv6 at scale.
It is very likely this is the signal we see in India, Thailand, Russia, the USA and Mexico. These are highly competitive markets. Viet Nam, whilst having competing ISPs, is a more coordinated economy and like China, is following a strategic plan. China faces additional barriers in a large population and a federated structure, which tends to make their deployment more complex.
If this is compared to the UK, Sky were able to deploy nationwide in a rolling program over a single year, and took their network to IPv6 at above 90% penetration. The reaction from BT and other carriers is clearly playing ‘catch up’, with Sky having achieved its national deployment now sitting at 90% consistently.
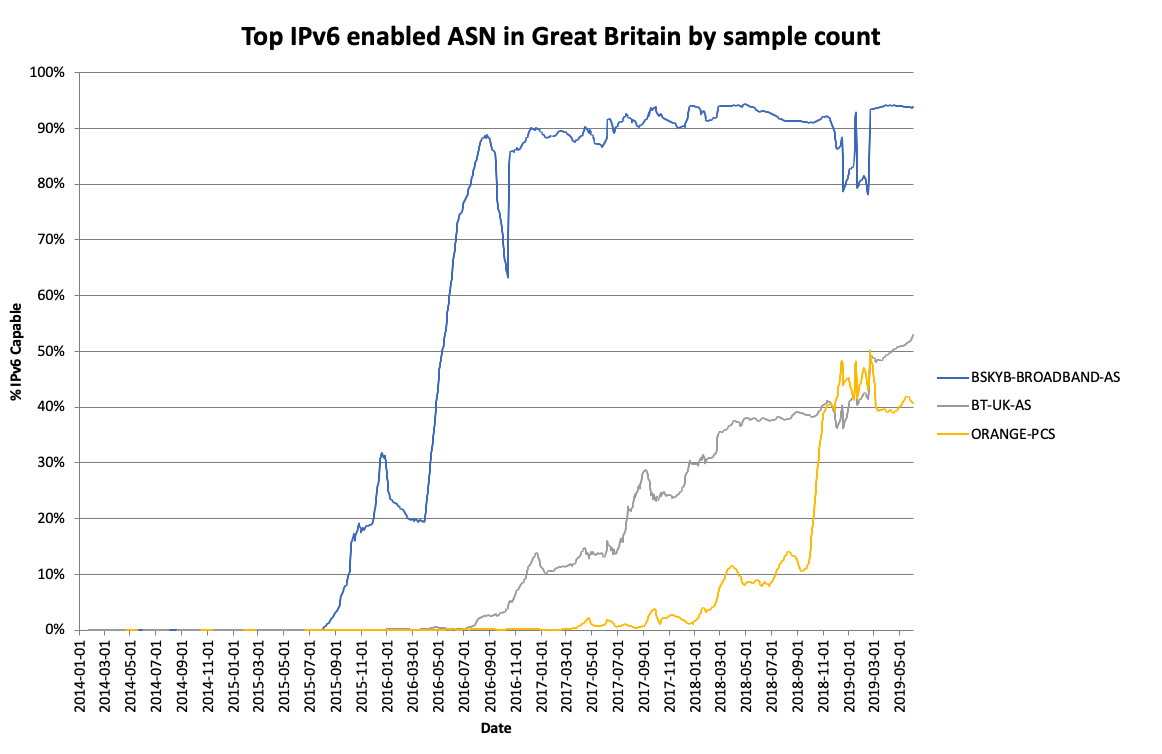
Figure 11 — Top IPv6-enabled ASNs in Great Britain by sample count.
Taiwan is perhaps in between the two situations, having an open market but a single large incumbent that can make market-forcing changes.
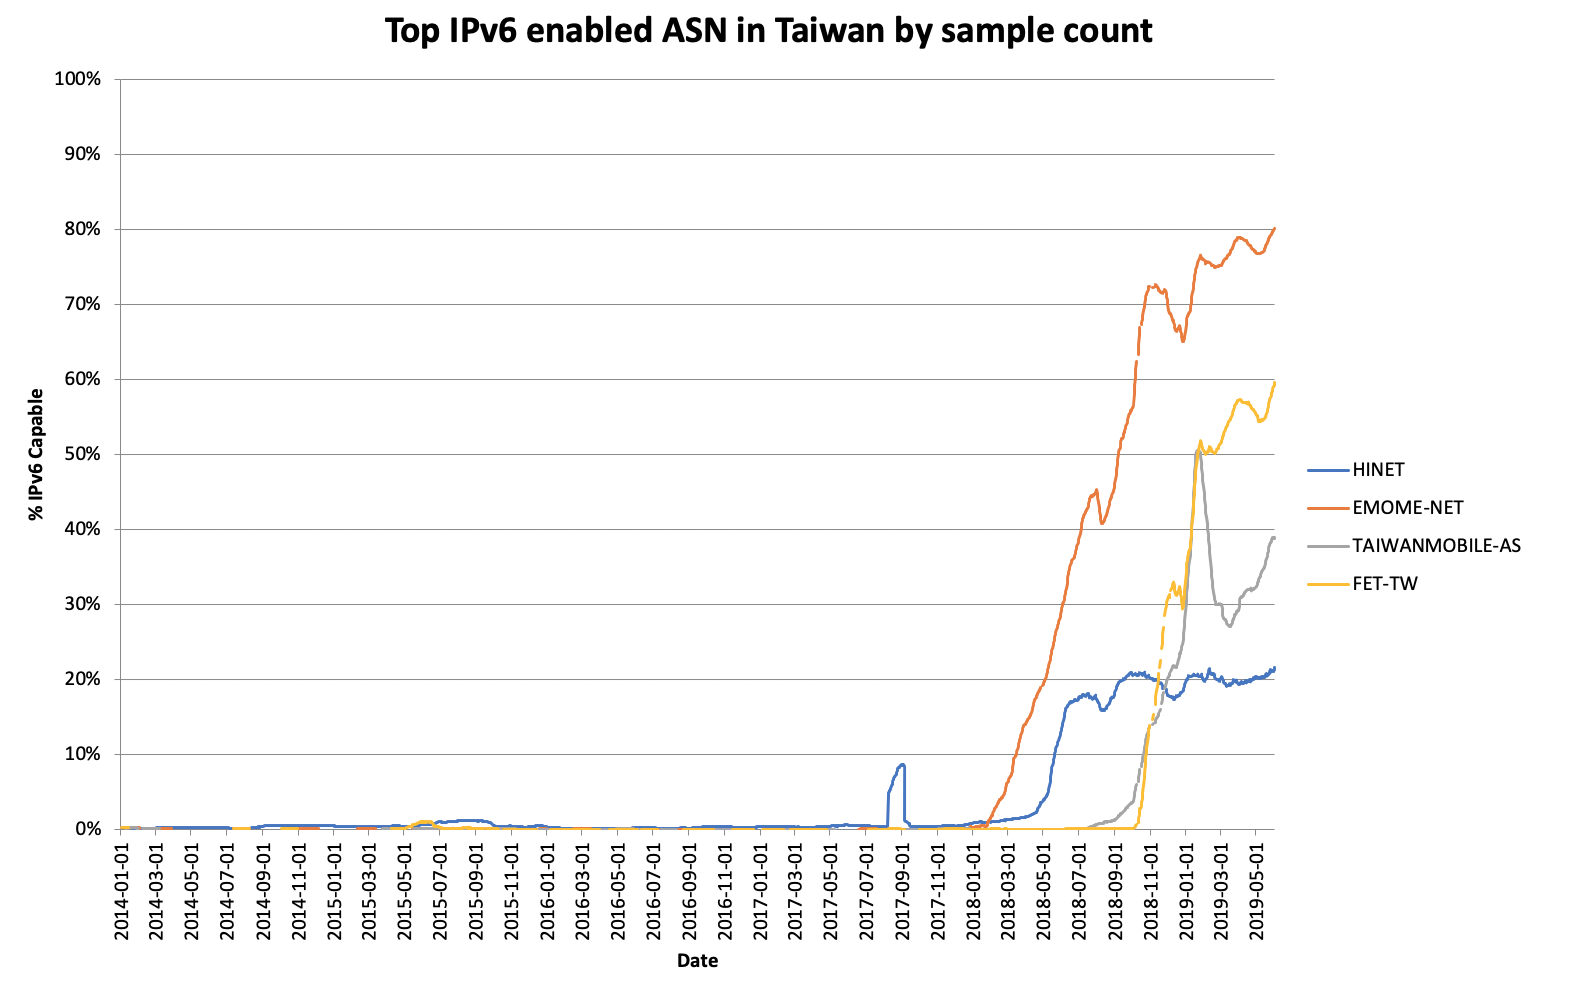
Figure 12 — Top IPv6-enabled ASNs in Taiwan by sample count.
Taiwan has seen four significant deployments and is now sitting around 35%, which has been achieved in only 18 months. This includes the market dominant telco in both cable and mobile.
Capital investment matters
Reliance Jio was able to deploy an IPv6-enabled network with a minimal cost because they entered the 4G/LTE market with technology that supported IPv6 from day one. A competitor that has a 3G or 4G existing deployment — which did not enable IPv6 or deployed before it was available — faces a difficult choice: do they expend capital and operational budget to move to IPv6, or do they continue with IPv4?
Looking at New Zealand and Australia, it is possible we can see signs of this in each economy.
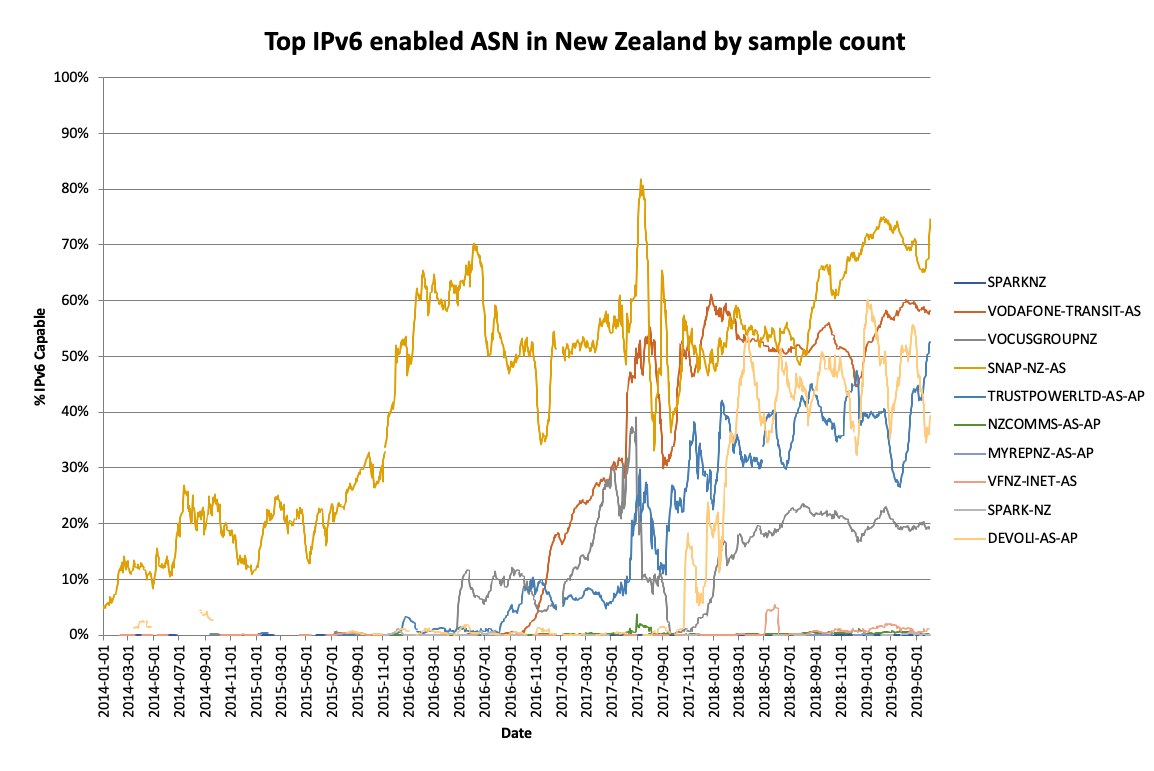 Figure 13 — Top IPv6-enabled ASNs in New Zealand by sample count.
New Zealand appears to show a mixture of deployment strategies, but Spark (formerly Telecom New Zealand) is not among those with high IPv6 rates. Vodafone and Snap have significantly more aggressive deployment strategies, and Vocus appears to be stalled at 20% penetration.

Figure 14 — Top IPv6-enabled ASNs in Australia by sample count.
The Australian picture in particular speaks to a market where the dominant telco (Telstra) has deployed at scale but still has significant IPv4 assets in its deployments across fibre, cable, ADSL and mobile. Its largest competitor is TPG, which consists of TPG itself, iiNet (a former West Australian ISP which went national) and Internode (a former South Australian ISP which also went national) — all operated as distinct routing entities. Internode had a significant IPv6 deployment but it has subsequently frozen. The highest deployment appears to be in Foxtel, a joint venture between Telstra and News Corporation (who own and operate the Sky network in the UK with 95% plus v6 capability) which suggests they have been prepared to spend money on newer technology.
A more recent competitor (Exetel) can be seen with its IPv6 deployment on NBN (a national fibre and hybrid layer two network, which like Crown holdings/UFB in New Zealand is shared by competing ISPs at layer three).
It is likely that in some cases, ISPs have decided to stick to their current plan. These are the ones we can see not deploying at scale. But, older network plant ages out and we now have the rise of 5G to consider.
Will 5G make a difference? Time will tell!

The views expressed by the authors of this blog are their own and do not necessarily reflect the views of APNIC. Please note a Code of Conduct applies to this blog.
