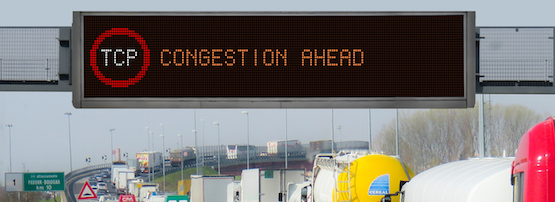
Congestion at ISP interconnections has been a recent focus in research, economic, and regulatory arenas.
The rapid growth of high bandwidth demanding Internet traffic — video, online gaming and emerging applications such as virtual reality — and the growing concentration of content across a small number of providers and distribution networks, is leading to capacity issues.
Not only is this congestion disrupting services for end users but it is also causing high-profile disputes among content providers, transit providers, and access ISPs over who should pay for additional capacity [1][2][3]. What’s more, the congested links are often left as a cost/benefit for all users of the link until the dispute is over.
Understanding the nature of congestion can assist in resolving such disputes. Although there have been previous efforts by MLab and Packet Clearing House (to name two) to understand the extent of such congestion — by using crowd-sourced throughput tests from distributed measurement infrastructures — there has been little done to validate these infrastructures. To address this, we conducted a study using public measurement data from these efforts, and our own measurement experiments, to investigate challenges in inferring interconnection congestion using data [PDF 4.1 MB] from the popular crowdsourcing throughput measurement platform, M-Lab.
The challenges with using throughput measurements
There are various challenges when it comes to inferring Internet congestion using throughput measurements:
- Accurately identifying which link on the path is congested requires fine-grained network tomography techniques, which are not supported by existing throughput measurement platforms.
- Existing measurement platforms do not provide sufficient visibility of paths to popular content sources, and only capture a small fraction of interconnections between ISPs.
- Using throughput measurements as input to a tomography algorithm is challenging due to issues with measurement synchronization and traceroute artefacts.
Apart from these challenges, crowdsourcing measurements inherently risks sample bias — using measurements from volunteers across the Internet leads to an uneven distribution of samples across the time of day, access link speeds, and home network conditions.
Network tomography is the study of a network’s internal characteristics using information derived from end point data. Network tomography advocates that it is possible to map the path data takes through the Internet by examining information from “edge nodes,” the computers in which the data are originated and from which they are requested.
Overcoming each challenge, with the data available to us, required making several assumptions.
Pinpointing the location of congestion required applying network tomographic techniques to detail router-level path information in both directions taken at the time of end-to-end measurements. Obtaining such information is in itself an open research and policy as discussed by KC Claffy:
“Interconnection links connecting access providers to their peers, transit providers and major content providers are a potential point of discriminatory treatment and impairment of user experience. In the U.S., the FCC has asserted regulatory authority over those links, although they have acknowledged they lack sufficient expertise to develop appropriate regulations thus far. Without a basis of knowledge that relates measurement to justified inferences about actual impairment, different actors can put forward opportunistic interpretations of data to support their points of view.”
An alternative is to use coarser-grained measurements, for example, AS-level tomography, and to further simplify the method using these three assumptions:
- There is no congestion internal to ASes, only at interconnects.
- The two endpoints of the measurement are indirectly connected ASes.
- There is only one physical link connecting them, which the measurement traffic traverses.
Majority of top ISPs a single AS hop away
Our analysis shows that among the top 10 US ISPs, 82% of traces were a single AS hop from M-Lab’s testing server. This is good, as having more than one AS hop between a server and client AS can cast doubt on congestion interference because any interdomain link in the path could be the point of congestion.
The limited path information available from the M-Lab study shows that the interconnections between the same pair of ISPs are often not crossing the same IP link. This is consistent with recent studies, which show that larger ASes tend to interconnect with each other in many locations, and congestion on these interconnections often varies in different regions.
These results also support the assumption that interdomain congestion must use path information to exclude measurements across multiple ASes. In addition, only a small fraction of interdomain interconnections of an access network is currently ‘testable’ using M-lab or Speedtest.
It is hoped that these results support efforts to deploy more M-Lab servers to cover more debatable/interesting/popular links and ensure more periodic and deterministic measurements be done over time, to overcome the limitations of crowdsourcing.
Contributors: Kimberly Claffy, Amogh Dhamdher
Xiaohong Deng is a PhD candidate at the University of New South Wales. She recently undertook a visiting scholarship at UCSD/CAIDA, with research interests in Machine Learning and its application to network measurement data.
The views expressed by the authors of this blog are their own and do not necessarily reflect the views of APNIC. Please note a Code of Conduct applies to this blog.
