

Time for another annual roundup from the world of IP addresses. What happened in 2015 and what is likely to happen in 2016? This is an update to the reports prepared at the same time in previous years, so let’s see what has changed in the past 12 months in addressing the Internet, and look at how IP address allocation information can inform us of the changing nature of the network itself.
Of course, the big news is yet another Regional Internet Registry (RIR) has run out of its remaining pool of IPv4 addresses. ARIN ran out during September 2015. ARIN is not using a “last /8 policy” and instead have held a single /10 to assist service providers with their IPv6 transition, which implies that any residual demand for IPv4 addresses in this region is going to have to be serviced via the address market. Before going into this in further detail, let’s pause to take a quick view at the larger environment of the Internet and the larger trends that are driving this industry.
The Internet is inexorably changing, and at the moment, the focus appears to be on the Internet of Things. 2015 saw the launch of the Apple Watch, and there is the useful Tile device and a myriad of other rather clever gadgets. Increasingly we are seeing computers disappear as recognizable computers and reappear cloaked in some other functional wrapper. We’re seeing the consumer offerings with Internet-based home lighting systems and other forms of household automation that involve sensors and appliance management, such as energy management, irrigation management and similar. Even the lens of my digital camera now has its own processor and firmware. What does this mean for the supply side of the computer industry?
In January 2016, Gartner released its estimate of the worldwide device sales for PCs, including desktops, notebooks, laptops and the ultra-mobiles, for 2015. Shipments are estimated to total some 288 million units for 2015, representing an 8% decline from 2014. So “peak” personal computers have now come and gone, and these personal devices are following their mainframe predecessors off to silicon heaven!
Smartphone sales are more than four times greater in terms of volumes, selling an estimated 1.2 billion units for the year, a rise of some 13% from 2014. This market is dominated by Samsung and Huawei with their Android-based platforms, and Apple’s premium devices that dominate the high end of the market. But growth is slowing even in this market space. There are indications that the Chinese smartphone market has reached saturation, and the market activity is now being driven by replacement. At some point making devices for humans tends to saturate as you reach deployment levels that are comparable to the world’s human population, and we appear to be getting very close to that ceiling for human-driven devices.
However, the silicon industry is far too rapacious to be stalled by such a mundane consideration as market saturation. Today’s opportunity encompasses all these embedded devices that collectively have been labelled “The Internet of Things”. Gartner has projected that this world of chattering silicon would get to 25 billion devices by 2020. Cisco upped the ante with their prediction of 50 billion such connected things by 2020, and Morgan Stanley went further with a prediction of 75 billion devices connected to the Internet in that time. Other reports have placed this number as high as 100 billion. The extent of the current levels of unbounded technical euphoria in this space project economic values of this activity in units of trillions of dollars by 2020. But it’s challenging to place these projected numbers into an analytical framework that can place these numbers into a firm foundation based on recent data.
What does all this mean for the Internet?
The human population of Internet users continues to rise. When you put together the mobile and wired numbers together and look at the population Internet users, the numbers driving growth are still dramatic. The estimated total number of Internet users worldwide grew from 3 billion at the start of the year to 3.35 billion by the end of the year, a growth of some 350 million users through 2015.
Obviously, the device population of the Internet is far higher, but these days it appears that the bulk of the growth of the network is occurring behind various forms of Network Address Translators (NATs). This implies that these devices are largely invisible, so efforts to track their population need to use some form of sampling or an examination of the production numbers of such devices. The second implication is that the deployment of these devices places very little in the way of pressures on address consumption. So while the world may have absorbed in 2015 a production quantity of some 300 million personal computers, 1.2 billion smart phones and some 1.3 billion connected devices, that does not mean that there has been a demand for 2.8 billion new IP addresses. Far from it.
Let’s see what the address allocation records can tell us as to how the public side of this increasingly two-faced Internet fared in 2015.
IPv4 in 2015
As measured by the allocations of public address space in the IPv4 network, the pace of growth of the Internet declined in 2015. The allocation of 38 million addresses in 2015 on top of a base of 3,558 million addresses that were already allocated at the start of the year represents a growth rate of 1.1% for the year. This is approximately one-sixth of the growth in 2010 (the last full year before the onset of address exhaustion).
| 2006 | 2007 | 2008 | 2009 | 2010 | 2011 | 2012 | 2013 | 2014 | 2015 | |
| Allocated IPv4 Addresses (Millions) | 168.1 | 203.9 | 203.3 | 189.4 | 248.8 | 201.0 | 114.9 | 65.1 | 63.9 | 38.4 |
| Start of Year Volume (Billions) | 2.15 | 2.32 | 2.52 | 2.72 | 2.90 | 3.14 | 3.34 | 3.43 | 3.50 | 3.59 |
| Relative Annual Growth | 7.9% | 8.4% | 7.9% | 6.6% | 8.3% | 6.4% | 2.9% | 1.9% | 1.8% | 1.0% |
Table 1 – IPv4 Allocated addresses by year
This low total in 2015 is due to the exhaustion of available IPv4 address space in the regions served by APNIC (Asia Pacific), the RIPE NCC (Europe and the Middle East) and LACNIC (Latin America and the Caribbean) in previous years, and that of ARIN in September 2015. That just leaves AFRINIC, with a pool of some 30.6 million remaining IPv4 addresses held in its pool.The record of address allocations per RIR over the past 10 years is shown in Table 2.
| RIR \ YEAR | 2006 | 2007 | 2008 | 2009 | 2010 | 2011 | 2012 | 2013 | 2014 | 2015 |
| APNIC | 51.4 | 69.6 | 87.8 | 86.9 | 120.2 | 105.2 | 1.0 | 1.3 | 3.7 | 4.1 |
| RIPE NCC | 55.0 | 60.7 | 44.0 | 43.4 | 56.0 | 43.1 | 40.0 | 2.0 | 2.5 | 3.3 |
| ARIN | 46.5 | 53.0 | 57.1 | 41.1 | 45.2 | 23.5 | 45.0 | 26.5 | 26.0 | 8.6 |
| LACNIC | 10.7 | 14.2 | 12.0 | 10.5 | 13.0 | 24.4 | 21.0 | 28.5 | 19.1 | 1.8 |
| AFRINIC | 2.6 | 5.5 | 1.6 | 5.9 | 8.5 | 9.2 | 7.9 | 6.8 | 12.5 | 16.9 |
Table 2 – IPv4 Allocated addresses (millions) – Distribution by RIR
In 2015 APNIC allocated 4.3 million IPv4 addresses, close to triple the 1.3 million addresses allocated in 2013. APNIC effectively exhausted its general use pool of addresses in April 2011, and since then the registry has been operating under the terms of a “last /8” policy which limits each entity to at most 1,024 addresses drawn from this “last chance” pool.
APNIC recorded some 4,444 individual address allocations in 2014. 2,510 entries refer to allocations from APNIC’s last /8 address block (103.0.0.0/8) and the average size of allocations from this block is 864 addresses or midway between a /23 and a /22. There were 9.6 million addresses remaining in this last /8 pool, and assuming a consumption rate of some 2.1 million addresses per year, the pool will last until mid-2020.
The remaining 1,934 allocations are drawn from those addresses assigned to APNIC from the recovered IPv4 address pool. The average allocation size from this pool was 1,102 addresses. By the end of 2015, this second address pool was effectively exhausted so all that remains for APNIC is the 9.6 million addresses in the last /8 pool.
However, a further 3.6 million addresses are marked as ‘reserved’ by APNIC. There are a variety of reasons for this marking, including non-contactability of the original holder, or addresses undergoing a period of ‘quarantine’ following a forced recovery. Efforts are being made to reduce the size of this pool, as in August 2015 the size of the reserved pool was 4.6 million addresses.
The RIPE NCC exhausted its general use pool of addresses in mid-September 2012. The RIPE NCC allocated some 3.3 million addresses in 2015 and recorded 3,273 allocations. The average allocation size was 1,016 addresses per allocation, which is comparable to the 2014 figures for this registry. At this allocation rate, the remaining pool of IP addresses, some 16.07 million addresses at the end of 2015, will last for a further 5 years, or until late 2020. RIPE has some 850,000 addresses marked as ‘reserved’.
LACNIC exhausted its general use pool of IPv4 addresses in June 2014, leaving some 4 million addresses in its residual address pool. This registry allocated some 1.8 million addresses in 2015. At this rate, LACNIC’s remaining 1.9 million addresses will last slightly over 12 months, or some until the start of 2017. LACNIC are holding some 4.7 million as ‘reserved’ at this point in time.
ARIN exhausted its general use IPv4 pool in September 2015. In the nine months up to the end of 2015 ARIN recorded some 1,870 allocations for a total of 8.60 million addresses. In the ensuing 3 months, ARIN has recorded the allocation of a further 17,000 addresses in 46 transactions. The registry is holding some 6.3 million addresses as ‘reserved’ at this point in time.
AFRINIC address consumption rate increased in 2015 from its 2014 level, and the 16.9 million addresses allocated in 2015 is the highest address consumption level for AFRINIC to date. At this stage, it appears that AFRINIC’s remaining 32.7 million addresses as for the start of 2016 will last a further two years, until the end of 2018. AFRINIC are holding 770,304 addresses in a ‘reserved’ pool at this point in time.
Finally, the IANA is holding 817,408 addresses in its recovered address pool. The current pool redistribution algorithm will operate for a further 4 years, but the size of the redistributed addresses will rapidly shrink, with a /15 being distributed to each RIR in March 2016, a /18 in September 2016, a /19 in March 2017 and so on.
Which countries received the largest pool of IPv4 address allocations in 2015?
| Rank | 2011 | 2012 | 2013 | 2014 | 2015 | |||||
| 1 | China | 53.07 | USA | 28.2 | USA | 25.0 | USA | 24.5 | USA | 7.6 |
| 2 | USA | 21.21 | Canada | 16.7 | Brazil | 17.4 | Brazil | 10.9 | Egypt | 7.4 |
| 3 | Japan | 16.91 | Brazil | 8.4 | Colombia | 3.8 | Morocco | 2.6 | Seychelles | 2.1 |
| 4 | Rep.Korea | 7.68 | Russia | 5.3 | Argentina | 1.6 | Colombia | 2.1 | South Africa | 2.0 |
| 5 | Indonesia | 7.09 | Iran | 4.5 | Egypt | 1.6 | South Africa | 1.7 | Tunisia | 1.8 |
| 6 | Brazil | 6.29 | Germany | 3.4 | Canada | 1.4 | Egypt | 1.6 | Brazil | 1.4 |
| 7 | India | 6.01 | South Africa | 3.4 | Nigeria | 1.2 | China | 1.5 | China | 1.3 |
| 8 | France | 5.39 | Italy | 3.3 | Chile | 1.1 | Canada | 1.5 | India | 1.3 |
| 9 | Russia | 5.02 | Colombia | 2.6 | Mexico | 1.1 | Kenya | 21.4 | Canada | 1.1 |
| 10 | Germany | 4.92 | Romania | 2.6 | Seychelles | 1.0 | Mexico | 1.1 | Ghana | 0.6 |
Table 3 – IPv4 Allocated addresses – Top 10 Economies
IPv4 Address Distribution
Another way to look at the address distribution is in terms of “skew”. If the Internet is populated by a largely homogenous population of service providers then the distribution of address allocations would be relatively uniform, such that the group of largest allocations would not be vastly larger than the group of smallest allocations. On the other hand, if the service provider population is skewed such that there is a small number of very large providers that service the bulk of the user population, then we would expect to see the bulk of addresses being allocated to a small number of providers. One way to look at the level of skew is to use a cumulative distribution plot, comparing the number of allocations to the amount of address space, shown below.
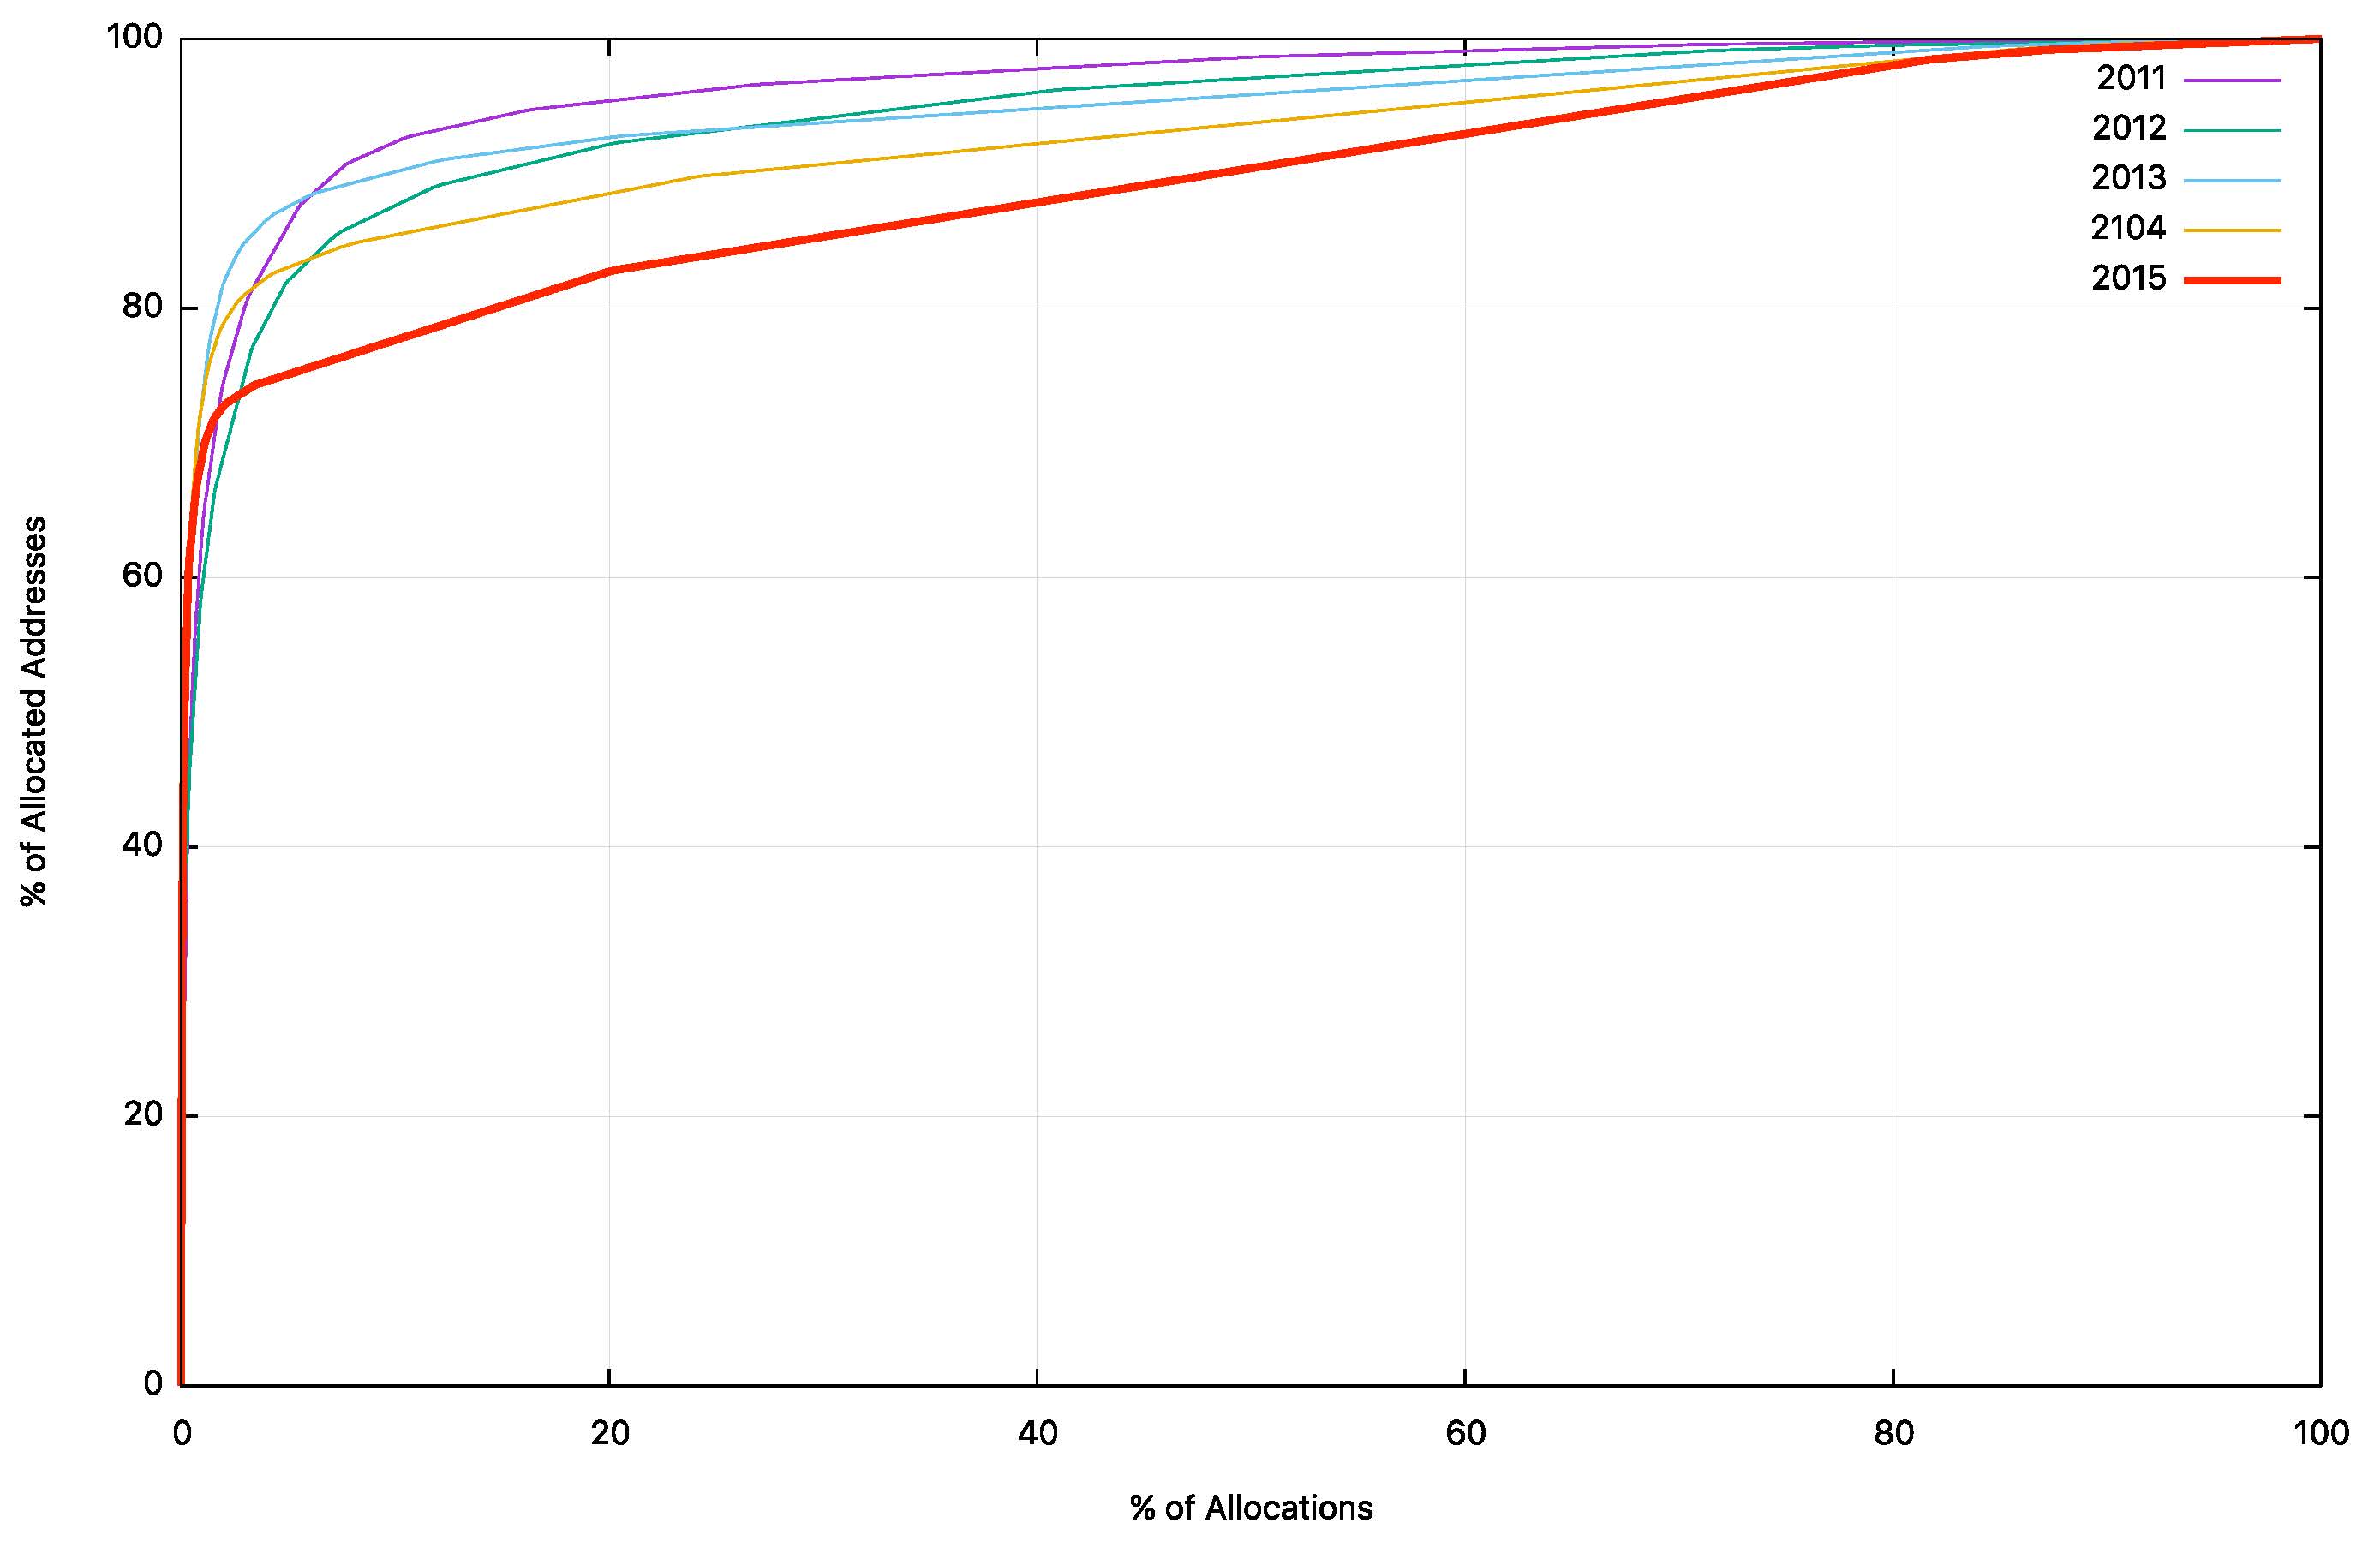
Figure 1 – IPv4 Allocation Distribution CDF 2011 to 2015
Figure 1 shows the address distribution for the years 2011 through to 2015. The shift over this period shows a relatively steady level in the proportion of address space being allocated to the larger providers. In 2011, one-half of all addresses were allocated to 70 entities while, in 2012, 80 entities consumed one-half of all addresses, and in 2013 68 entities. In 2014, one-half of the assigned address space was assigned to 39 entities while, in 2015, one-half of all assigned address space was assigned to 21 entities (Figure 2).
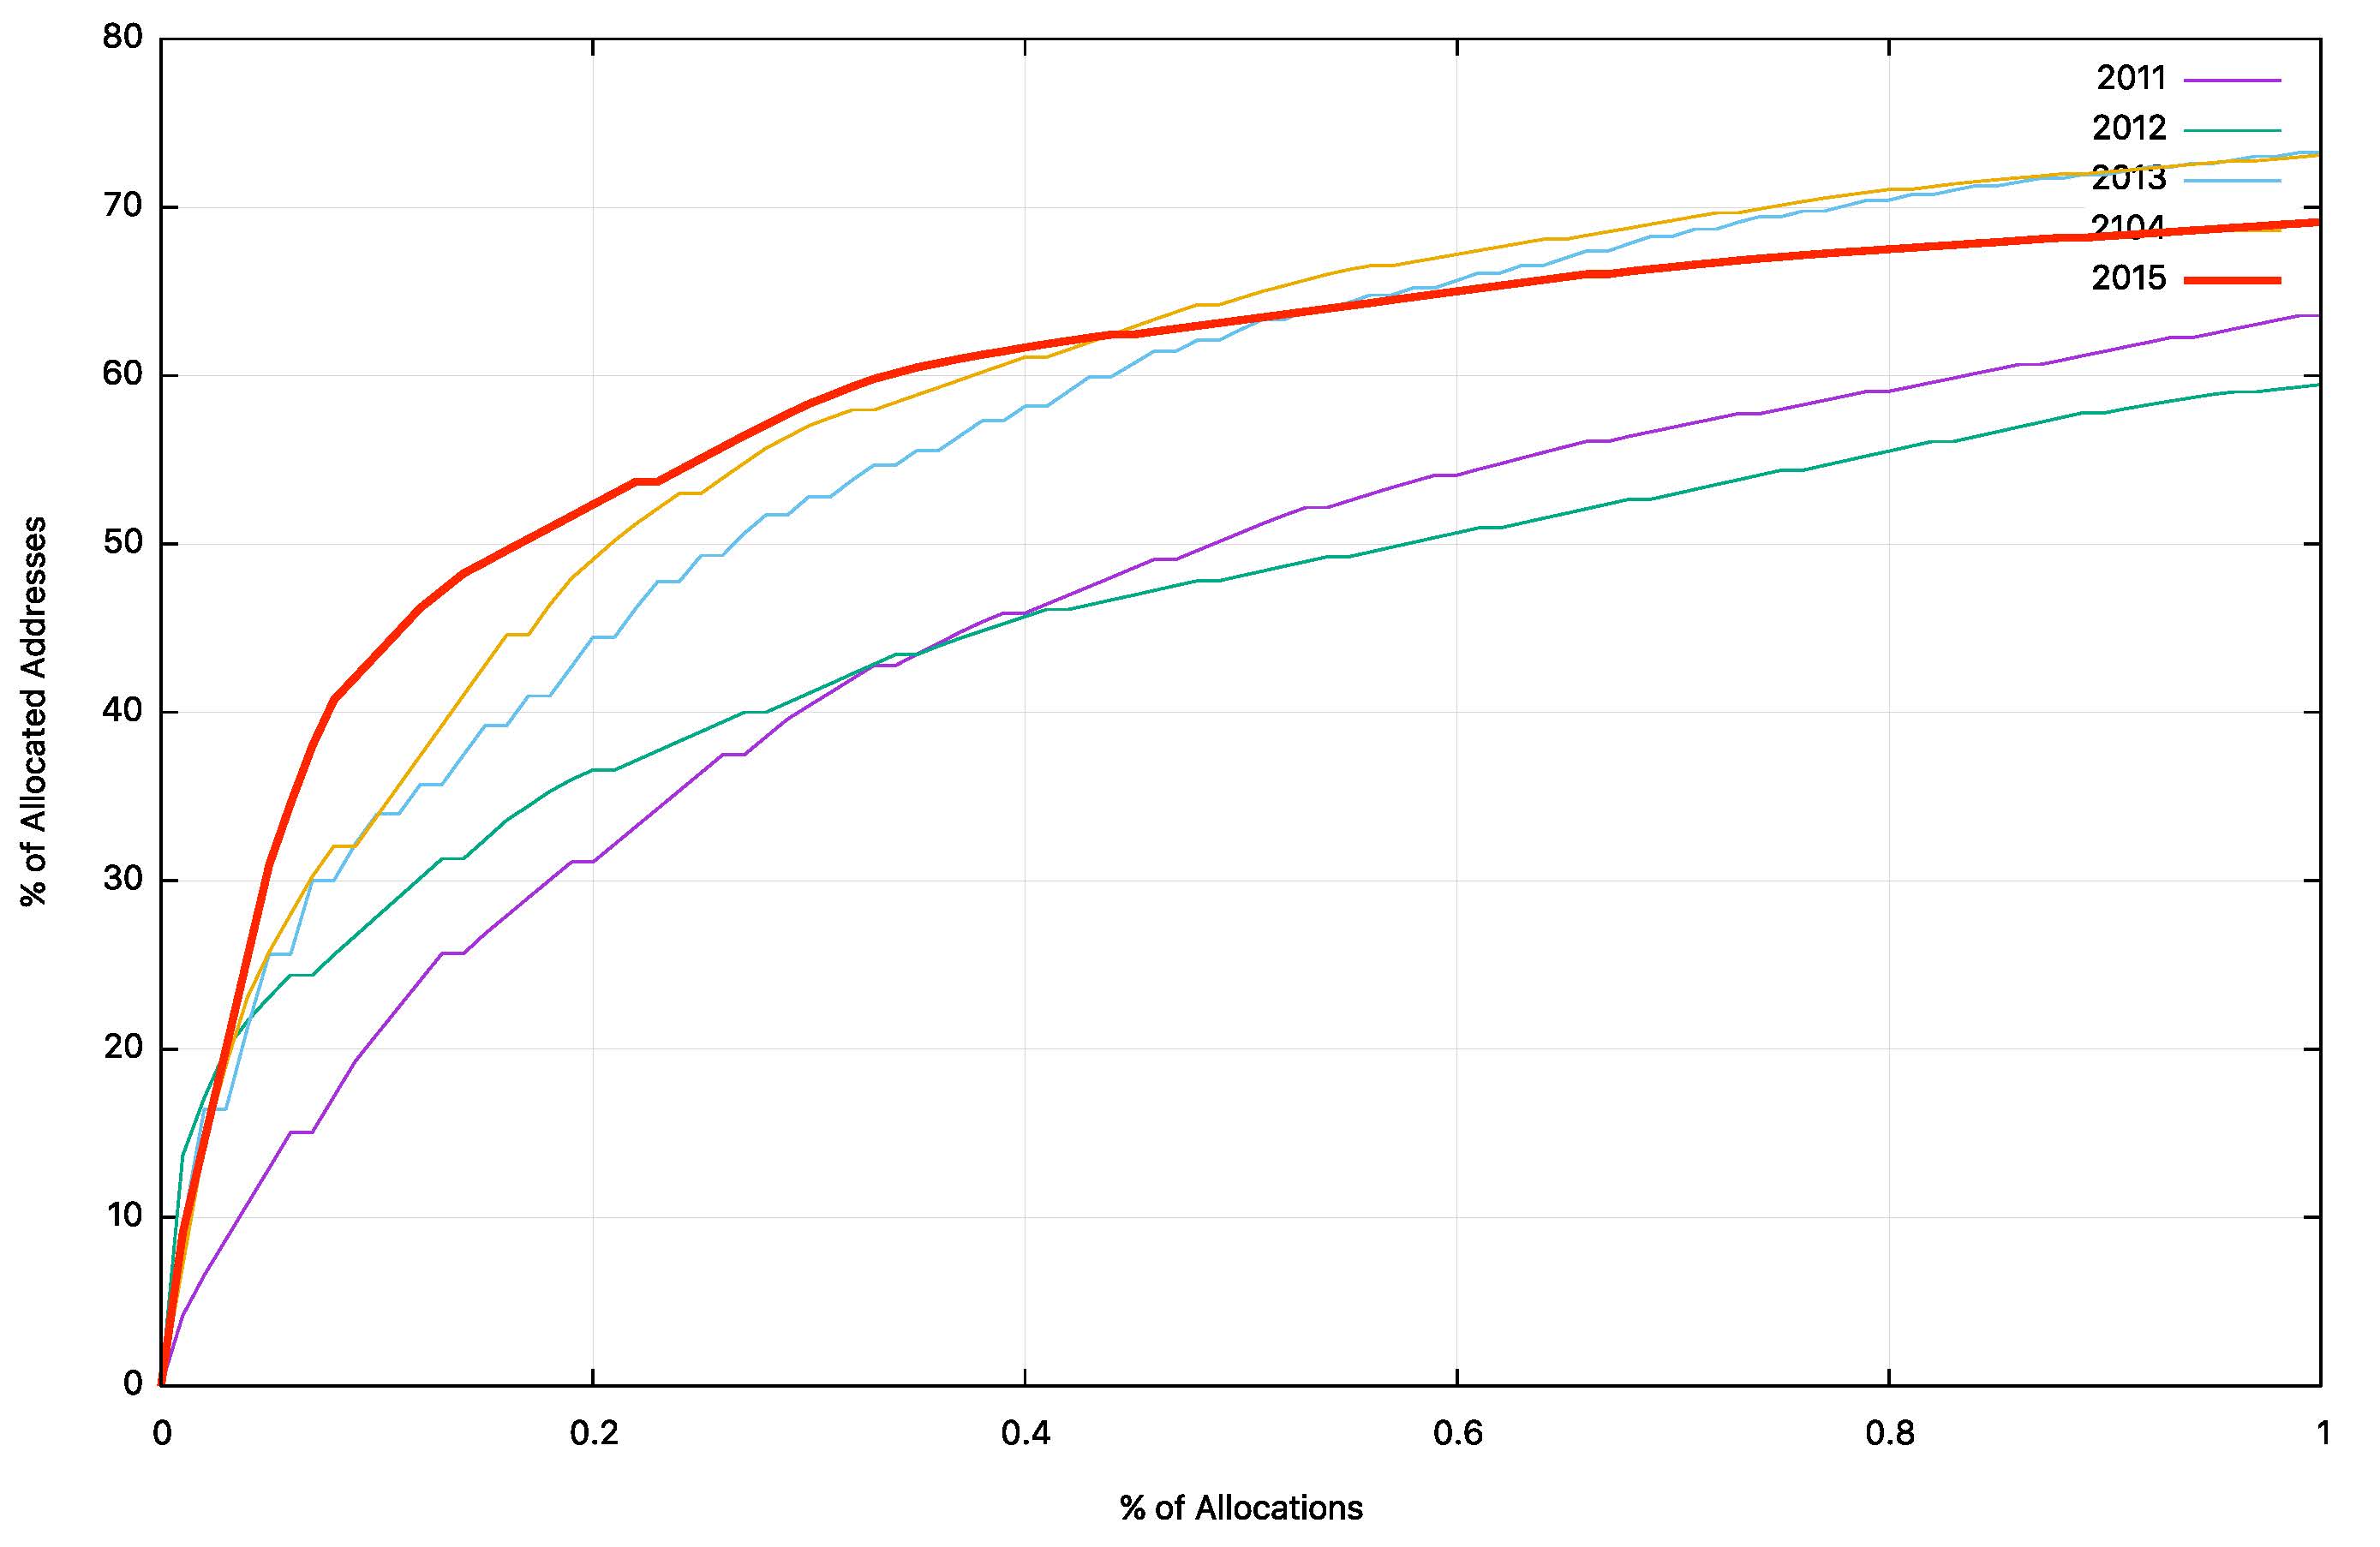
Figure 2 – IPv4 Allocation Distribution CDF 2011 – 2014 – Largest 1%
Who received the largest of these allocations in 2015?
The following table lists those organizations who were allocated more than 1 million IPv4 addresses in 2015.
| Rank | Economy | Organization | Addresses (M) |
| 1 | Seychelles | Cloud Innovation | 2.1 |
| 2 | Egypt | Telecom Egypt | 2.1 |
| 3 | Egypt | Etisalat Misr | 2.1 |
| 4 | Egypt | Vodaphone | 2.1 |
| 5 | South Africa | M-Web | 1.4 |
| 6 | Tunisia | Smartphone | 1.3 |
| 7 | United States | Time Warner Cable | 1.0 |
| Total | 12.1 |
Table 4 – IPv4 Allocated Addresses – Top 7 allocations for 2015
This “heavy tail” distribution of the largest allocations has not always been the case. In looking at the distribution of IPv4 allocations over the past decade, the following table shows the percentage of address space that was allocated to the 1% largest individual allocations and the lower half of the individual allocations.
| IPv4 Allocations | 2004 | 2005 | 2006 | 2007 | 2008 | 2009 | 2010 | 2011 | 2012 | 2013 | 2014 | 2015 |
| Top 1% | 38% | 51% | 45% | 51% | 47% | 50% | 49% | 60% | 63% | 51% | 67% | 65% |
| Lower 50% | 3% | 1% | 2% | 1% | 1% | 1% | 1% | 1% | 2% | 4% | 7% | 11% |
Table 5 – IPv4 Allocated addresses
What appears to have happened across the period 2000 to 2005 was a marked phase of aggregation in this industry, where the economies of scale in a mass market for Internet services started to exercise significant influence over the deployment of services on the Internet. This picture has remained relatively consistent since 2005, and the largest 100 Internet enterprises across the world appear to undertake at least one-half of the volume of deployment of new Internet services. To the extent that the Internet on the 1990’s was a poster child of a strongly competitive environment and highly diverse supply industry in the communications sector, the 2000’s has seen the Internet progress into an environment which is dominated by economies of scale and large scale supplier enterprises. A marketplace that is strongly influenced by a small number of larger enterprises is often not as agile in areas of technical and service innovation, and competitive pressures are not as strong a factor when one or two providers assume a dominant market position.
The distribution of addresses in the IPv4 Internet paints a picture of an industry that has now completed a process of aggregation, and the pressures that will lead to further evolution of the Internet in the coming years will probably be different to those that drove the Internet of some years ago. This concentration of resources into a small number of carriage and service providers was initially evident in the so-called developed economies, but, as the 2015 numbers suggest, we are now seeing a similar concentration of providers appear in other parts of the world. The widespread use of mobile devices has managed to side-step the capital and logistical barriers of installing a wired infrastructure as a precursor to a providing Internet access, so we are seeing various mobile providers in many parts of the world experiencing a rapid expansion in their customer base, with a corresponding demand on IP addresses.
IPv4 Address Transfers
In recent years, a number of RIRs (the RIPE NCC, ARIN, and APNIC) have included the registration of IPv4 transfers between address holders, as a means of allowing secondary re-distribution of addresses as an alternative to returning to the registry. This has been in response to the issues raised by address exhaustion, and the underlying thinking as to encourage the reuse of otherwise idle or inefficiently used address blocks through the incentives provided by a market for addresses.
The numbers of registered transfers in the past four years are shown in Table 6.
| Receiving RIR | 2012 | 2013 | 2014 | 2015 |
| ARIN | 79 | 31 | 58 | 277 |
| APNIC | 255 | 206 | 437 | 514 |
| RIPE NCC | 10 | 171 | 1,050 | 2,852 |
| Total | 344 | 408 | 1,545 | 3,643 |
Table 6 – IPv4 Address Transfers per year
Obviously, the level of activity in registering the movement of addresses has increased significantly in 2015. A slightly different view is that of the volume of addresses transferred per year (Table 7).
The total volume of addresses transferred in this way has tripled in 2015 over the volume of the previous year. In the case of ARIN, much of the volume of transfers in 2015 was related to the movement of old legacy space blocks. In APNIC, the number of transactions increased by one-third while, the volume of addresses that have been transferred has doubled. The situation in the RIPE NCC shows an opposite trend, with the number of transactions increasing three-fold, but the total volume of transferred addresses remaining steady. For the RIPE region, it appears that the market for transfers if predominately in the smaller sized blocks of addresses in recent years. The average transfer unit registered by ARIN in 2015 was a /15, APNIC had slightly less than a /17 and the RIPE NCC recorded an average size slightly smaller than a /20.
However, the total volume of addresses reassigned in this manner, some 58 million, is far less than the underlying pre-exhaustion address demand levels. It appears that the address supply hiatus has motivated most providers to use address sharing technologies and, in particular, Carrier Grade NAT on the access side and server pooling on the content side as a means of increasing the level of sharing of addresses.
| Receiving RIR | 2012 | 2013 | 2014 | 2015 |
| ARIN | 6,728,448 | 5,136,640 | 4,737,280 | 36,637,888 |
| APNIC | 3,434,496 | 2,504,960 | 4,953,088 | 9,836,288 |
| RIPE NCC | 65,536 | 1,977,344 | 9,635,328 | 10,835,712 |
| Total | 10,228,480 | 9,618,944 | 15,975,936 | 53,309,888 |
Table 7 – Volume of Transferred IPv4 Addresses per year
How “old” are these transferred addresses? Is the address transfer market reaching back into the early so-called “legacy” allocations and assignments and reviving otherwise unused addresses and put them back into current use? A look at the relative age distribution of registered address transfers (Figure 3) shows that the market has had some success in this area, and increasingly we are seeing transfer recycled addresses were initially registered twenty years before the transfer. Figure 3 indicates that the address transfer market is reaching back further into the older records for available addresses over time.
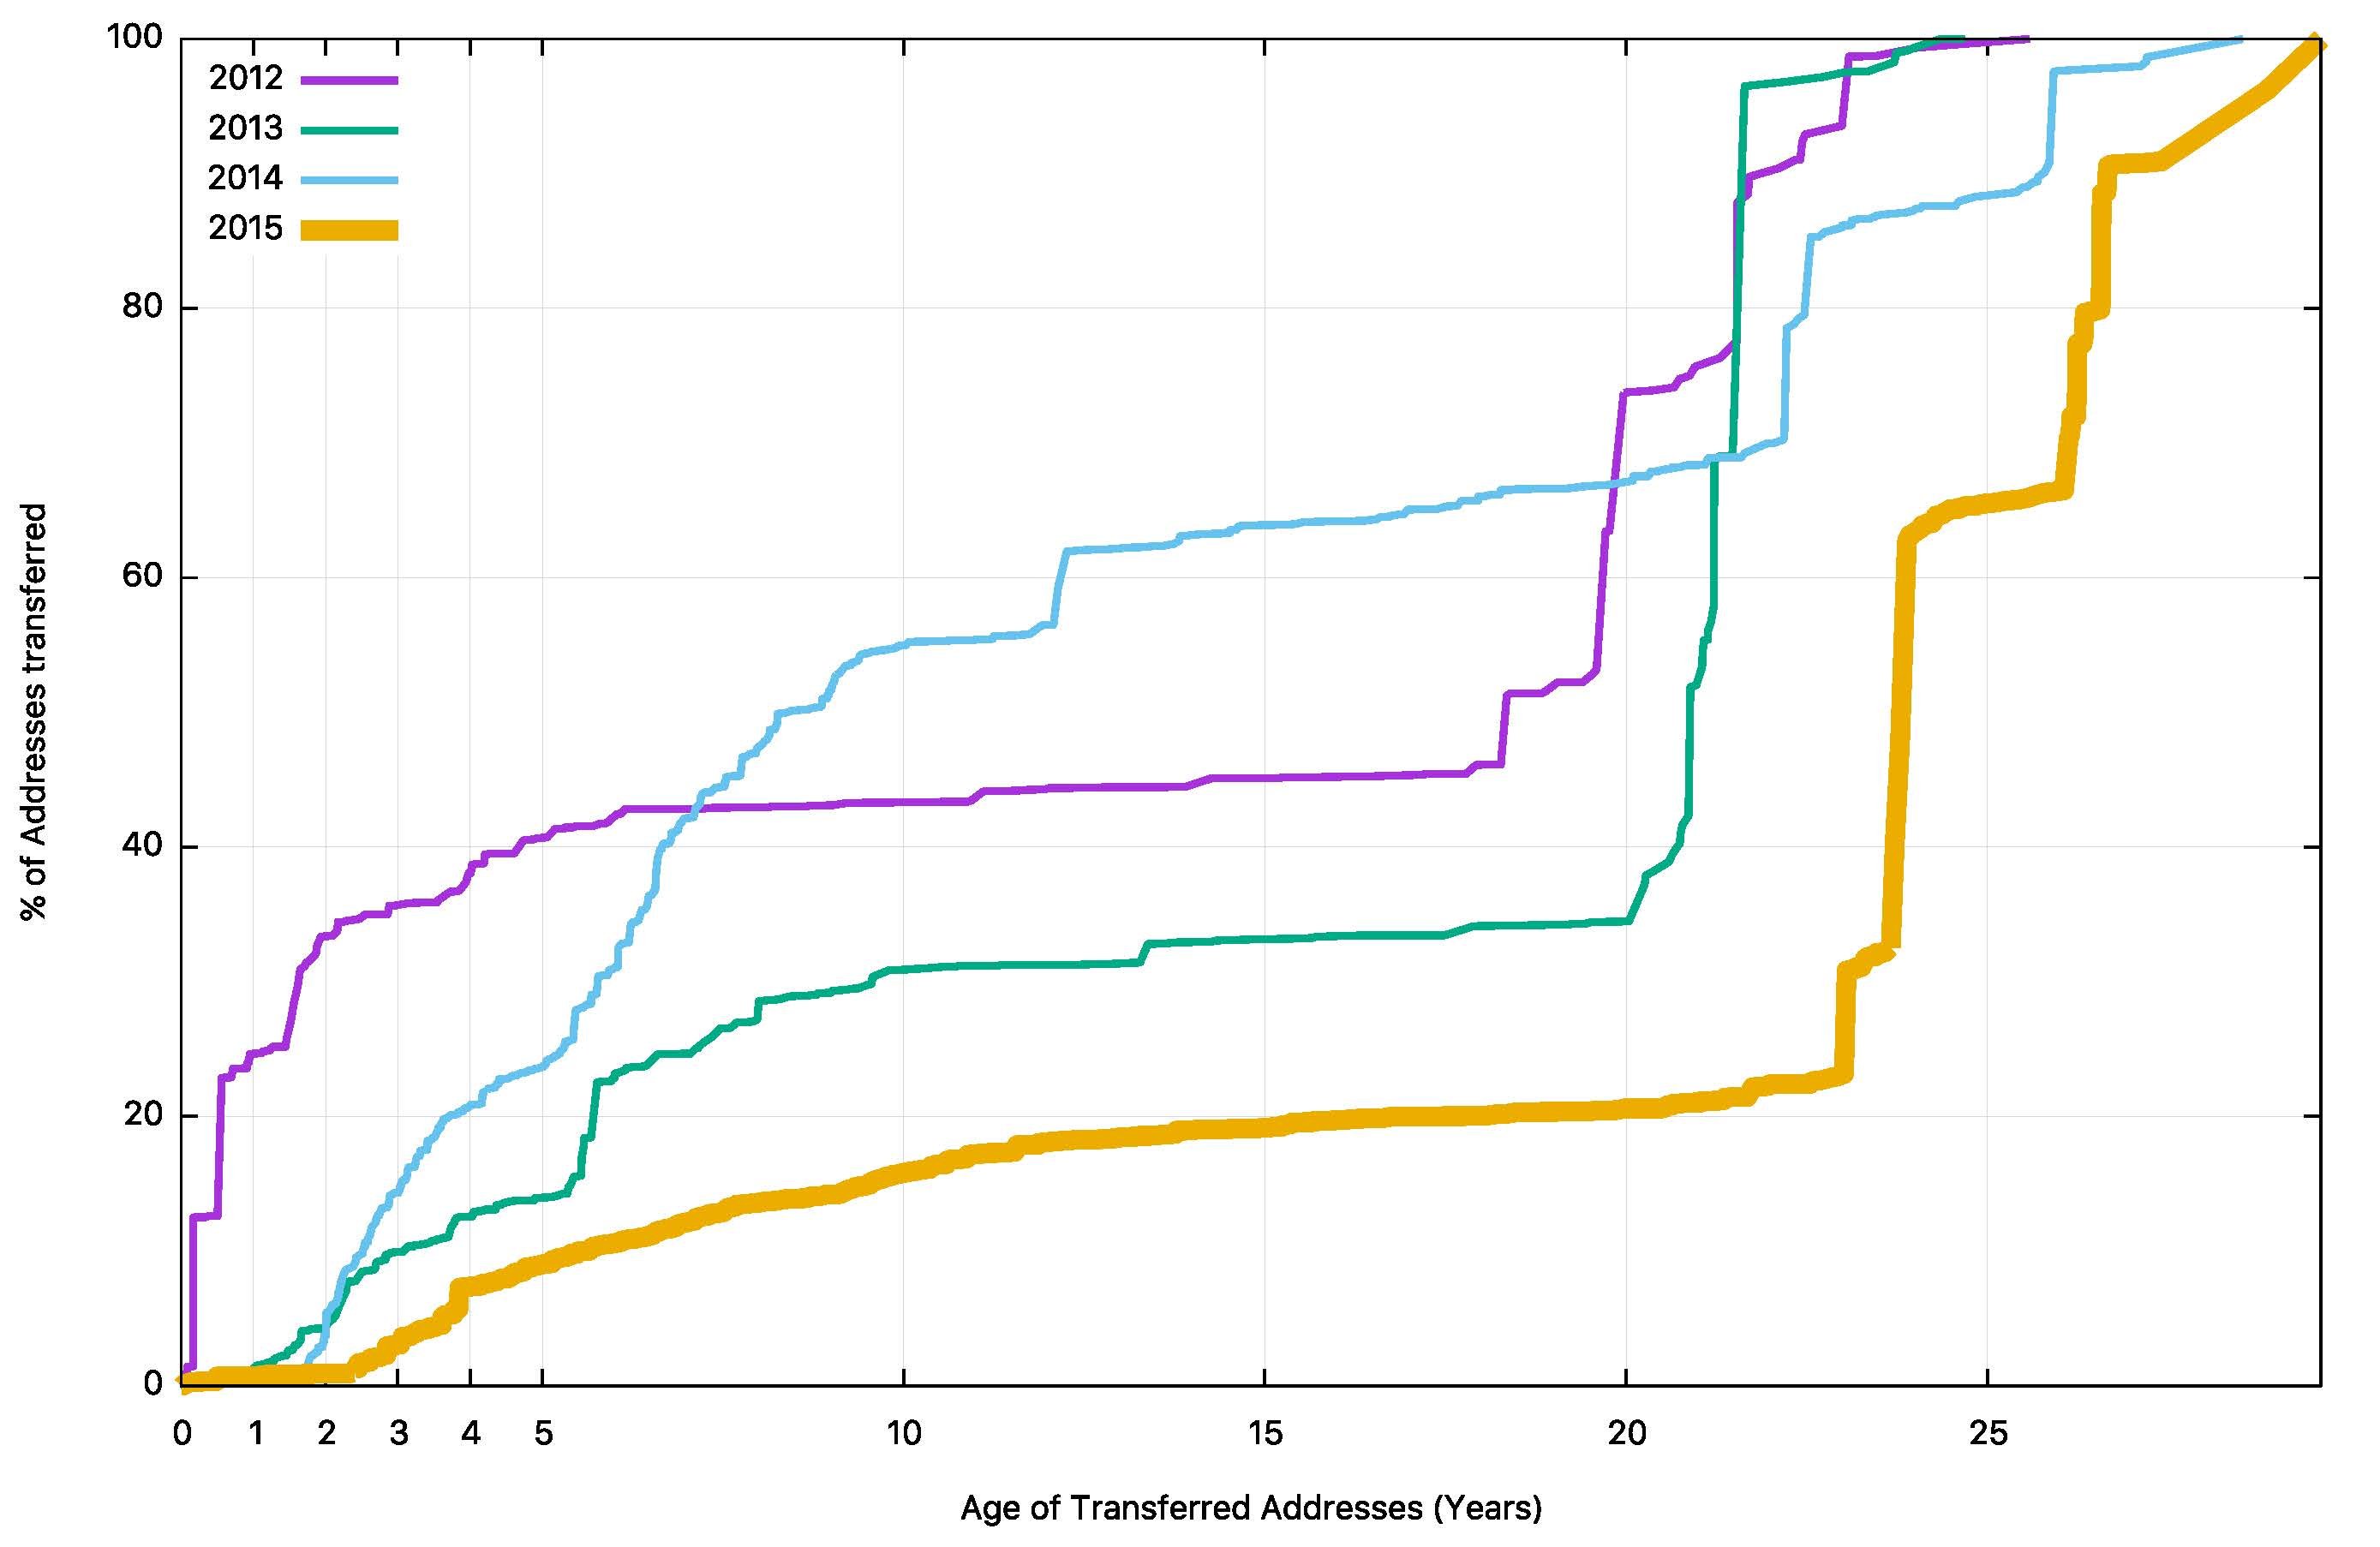
Figure 3 – Cumulative Age Distribution of Registered Address Transfers per year
The outstanding question about this transfer data is whether all of the address transfers that occur are duly recorded in the registry system as an address transfer. This question is raised because registered transfers require conformance to registry policies, and it may be the case that only a subset of transfers is being recorded in the registry as a result. One way to shed some further light on this is through a simple examination of the routing system, looking at the relative age of addresses that are announced through each year. Figure 4 shows the results of a simple analysis of the addresses present in the routing table at the end of 2015 that were not present in the same table at the start of the year. While this is admittedly a very simple technique, it does show that in 2015 some 20% of the address advertisements of addresses that were present at the end of 2014, but not at the start of the year have a registration date of 1995 or earlier (i.e. 20 years old or older).

Figure 4 – Cumulative Age Distribution of Announced Addresses per year
Of these “new entrant” addresses that appeared in the routing system during 2015, that were first registered earlier than 2014 (i.e. are ‘older’ than 2 years), only one-third of these particular “new entrant” addresses are listed in the RIR’s transfer registries. That leaves two-thirds of these addresses that are not listed as being transferred by the registry, yet were ‘revived’ and announced in the Internet’s routing system in 2015. The average age of these unlisted addresses is 15 years, while the average age of the addresses listed in the transfer registries is 10 years, indicating that these unlisted addresses are more likely to be drawn from the so-called legacy address pools. The original allocation of these legacy addresses predates the regional registry system and there were no formal agreements between the recipient of the addresses and the entity that performed the allocation at the time. While it has been reported that many address holders have subsequently entered into agreements with a RIR to maintain their registry, evidently many have not, and in this latter case it is quite possible that any sale, or other form of transfer of addresses, would not be reported to a registry.
This raises the question of the extent to which all address movements have been accurately captured in the address transfer logs, and the extent of opaque forms of address transfer that are not recorded through the public RIR-administered registries. This may take the form of “address leasing” or simply be an off-registry transfer by some form of private agreement. A more thorough analysis of address transfers from both the perspective of the registry system and the routing system is called for, to see if more light can be shed on this aspect of address management.
IPv6 in 2015
These days the story of IPv4 address allocations is only half of the story, and to complete the picture it’s necessary to look at how IPv6 has fared over 2015. IPv6 uses a somewhat different address allocation methodology than IPv4, and it is a matter of choice for a service provider as to how large an IPv6 address prefix is assigned to each customer. The original recommendations published by the IAB and IESG in 2001, documented in RFC3177 envisaged the general use of a /48 as an end site prefix. Subsequent consideration of long-term address conservation saw a more flexible approach being taken with the choice of the end site prefix size being left to the service provider. Today’s IPv6 environment has some providers using a /60 end site allocation unit, many use a /56, and other providers use a /48. This variation makes a comparison of the count of allocated IPv6 addresses somewhat misleading, as an ISP using /48’s for end sites will require 256 times more address space to accommodate the same customer base as a provider who uses a /56 end site prefix, and 65,000 times more address space than an ISP using a /60 end site allocation.
So for IPv6, let’s use both the number of discrete IPv6 allocations and the total amount of space that was allocated to see how IPv6 fared in 2011.
Comparing 2014 to 2015, the number of individual allocations of IPv6 address space has risen by some 2%. This is a growth rate that is smaller than IPv4 both in relative and absolute terms.
| Allocations | 2006 | 2007 | 2008 | 2009 | 2010 | 2011 | 2012 | 2013 | 2014 | 2015 |
| IPv6 | 234 | 475 | 860 | 1,236 | 2,436 | 3,587 | 3,304 | 4,018 | 4,528 | 4,735 |
| IPv4 | 5,646 | 6,312 | 6,969 | 6,701 | 7,758 | 10,061 | 8,619 | 7,110 | 10,853 | 11,732 |
Table 8 – Number of individual Address Allocations, 2005 to 2015
The amount of IPv6 address space distributed in 2013 had risen by 40% over 2012 levels, but in 2014, the total volume of allocated addresses fell by the same amount, back to the same total volume of addresses as in 2012. The number of allocations increased, however, indicating that 2014 there were no anomalous extremely large allocations of IPv6 address space through this last year. 2015 showed a visible level of growth over 2014 levels in IPv6.
| Addresses | 2006 | 2007 | 2008 | 2009 | 2010 | 2011 | 2012 | 2013 | 2014 | 2015 |
| IPv6 (/32s) | 9,792 | 6,678 | 80,996 | 1,064 | 5,835 | 15,018 | 17,756 | 24,107 | 17,784 | 20,226 |
| IPv4 (/32s)(M) | 168.1 | 203.9 | 203.3 | 189.4 | 248.8 | 201.0 | 114.9 | 65.1 | 63.9 | 64.7 |
Table 9 – Volume of Address Allocations, 2005 to 2012
Regionally, each of the RIRs saw IPv6 allocation activity in 2015 that was on a par with those seen in the previous year.
| Allocations | 2006 | 2007 | 2008 | 2009 | 2010 | 2011 | 2012 | 2013 | 2014 | 2015 |
| RIPE NCC | 89 | 158 | 427 | 622 | 1,042 | 1,647 | 1,756 | 2,149 | 2,218 | 2,206 |
| ARIN | 69 | 210 | 227 | 378 | 623 | 1,038 | 611 | 560 | 512 | 602 |
| APNIC | 43 | 63 | 161 | 190 | 666 | 641 | 599 | 540 | 528 | 778 |
| LACNIC | 16 | 25 | 29 | 33 | 50 | 132 | 253 | 696 | 1,208 | 1,063 |
| AFRINIC | 17 | 19 | 16 | 13 | 55 | 129 | 83 | 73 | 62 | 86 |
| 234 | 475 | 860 | 1,236 | 2,436 | 3,587 | 3.302 | 4,018 | 4,528 | 4,735 |
Table 10 – IPv6 allocations by RIR
The assignment data tells a slightly different story. Table 11 shows the number of allocated IPv6 /32’s per year. Interestingly the volume of IPv6 addresses assigned by ARIN in 2015, the year that ARIN exhausted its remaining pools of available IPv4 space, was approximately one-tenth of the address volume of the previous year. The opposite was seen in AFRINIC, where the 2015 address volumes were ten-times the 2014 volumes. This is largely due to two large IPv6 allocations in 2015 to Telecom SA (/20) and Vodacom SA (/24).
| IPv6 Addresses (/32s) | 2006 | 2007 | 2008 | 2009 | 2010 | 2011 | 2012 | 2013 | 2014 | 2015 |
| RIPE NCC | 6,481 | 1,251 | 606 | 602 | 1,867 | 2,425 | 3,729 | 6,390 | 8,565 | 12,031 |
| ARIN | 52 | 137 | 14,488 | 249 | 579 | 2,280 | 1,675 | 12,580 | 5,232 | 641 |
| APNIC | 3,226 | 5,237 | 141 | 174 | 3,239 | 9,506 | 3,807 | 4,662 | 2,663 | 2,109 |
| LACNIC | 16 | 39 | 65,749 | 30 | 46 | 652 | 4,325 | 608 | 1,363 | 974 |
| AFRINIC | 17 | 14 | 12 | 9 | 104 | 155 | 4,203 | 67 | 51 | 4,471 |
| 9,792 | 6,678 | 80,996 | 1,064 | 5,835 | 15,018 | 17,739 | 24,107 | 17,784 | 2-.226 |
Table 11 – IPv6 address allocation volumes by RIR
Dividing addresses by allocations gives the average IPv6 allocation size in each region (Table 12). The volume of addresses assigned by RIPE NCC increased in 2015 from a little smaller than a /30 to slightly larger than a /30. The average allocation made by ARIN and LACNIC was a /32 for the year, and APNIC’s average was /31. Overall the average allocation size is still a /30.
| Average IPv6 Allocation | 2006 | 2007 | 2008 | 2009 | 2010 | 2011 | 2012 | 2013 | 2014 | 2015 |
| RIPE NCC | 72.82 | 7.92 | 1.42 | 0.97 | 1.79 | 1.47 | 2.12 | 2.97 | 3.86 | 5.45 |
| ARIN | 0.75 | 0.65 | 63.82 | 0.66 | 0.93 | 2.20 | 2.74 | 22.46 | 10.22 | 1.06 |
| APNIC | 75.02 | 83.13 | 0.88 | 0.92 | 4.86 | 14.83 | 6.36 | 8.63 | 5.04 | 2.71 |
| LACNIC | 1.00 | 1.56 | 2,267.21 | 0.91 | 0.92 | 4.94 | 17.09 | 0.87 | 1.13 | 0.92 |
| AFRINIC | 1.00 | 0.74 | 0.75 | 0.69 | 1.89 | 1.20 | 50.64 | 0.92 | 0.82 | 51.99 |
| 41.85 | 14.06 | 94.18 | 0.86 | 2.40 | 4.19 | 5.37 | 6.05 | 3.93 | 4.27 |
Table 12 – Average IPv6 address allocation size by RIR
| Rank | 2011 | 2012 | 2013 | 2014 | 2015 | |||||
| 1 | United States | 924 | United States | 549 | United States | 485 | Brazil | 946 | Brazil | 815 |
| 2 | Australia | 176 | UK | 199 | Brazil | 473 | United States | 457 | United States | 540 |
| 3 | Germany | 160 | Germany | 187 | UK | 248 | UK | 239 | China | 267 |
| 4 | UK | 150 | Russia | 186 | Russia | 246 | Germany | 215 | Germany | 249 |
| 5 | Russia | 147 | Netherlands | 124 | Germany | 195 | Russia | 201 | UK | 216 |
| 6 | France | 110 | Australia | 113 | Netherlands | 134 | Netherlands | 181 | Russia | 183 |
| 7 | Canada | 107 | France | 111 | France | 132 | France | 122 | Netherlands | 170 |
| 8 | Netherlands | 107 | Sweden | 90 | Sweden | 112 | Switzerland | 103 | Australia | 123 |
| 9 | Sweden | 96 | Argentina | 78 | Australia | 102 | Italy | 103 | Spain | 119 |
| 10 | Czech Rep. | 88 | Poland | 77 | Italy | 98 | Australia | 101 | France | 116 |
Table 13 – IPv6 allocations by Economy
Table 13 shows the countries that received the largest number of IPv6 allocations, while Table 14 shows the amount of IPv6 address space assigned on a per economy basis for the past 5 years (using units of /32s). The two large allocations to South African providers are visible in this table.
| Rank | 2011 | 2012 | 2013 | 2014 | 2015 | |||||
| 1 | China | 8,997 | Argentina | 4,177 | United States | 12,537 | United States | 4,930 | South Africa | 4,441 |
| 2 | United States | 6,253 | Egypt | 4,098 | China | 4,135 | China | 2,127 | China | 1,797 |
| 3 | Spain | 667 | China | 3,136 | UK | 782 | UK | 1,090 | UK | 1,297 |
| 4 | UK | 476 | United Sates | 1,337 | Germany | 651 | Brazil | 863 | Germany | 1,269 |
| 5 | Brazil | 311 | Italy | 635 | Russia | 523 | Germany | 749 | Netherlands | 1,010 |
| 6 | Germany | 300 | Russia | 403 | Netherlands | 463 | Netherlands | 719 | Russia | 864 |
| 7 | Mexico | 261 | Germany | 399 | Brazil | 450 | Russia | 716 | Brazil | 755 |
| 8 | Venezuela | 261 | UK | 356 | France | 435 | France | 436 | Spain | 708 |
| 9 | Netherlands | 241 | Canada | 323 | Italy | 339 | Italy | 410 | Italy | 707 |
| 10 | Russia | 160 | Brazil | 294 | Switzerland | 265 | Switzerland | 369 | United States | 662 |
Table 14 – IPv6 Address Allocation Volumes by Economy
The major IPv6 allocations in 2013 by end entity are shown in Table 15.
| Rank | Country | Organization | Address Count (/32s) |
| 1 | South Africa | Telecom SA | 4,096 |
| 2 | China | Alibaba | 1,032 |
| 3 | South Africa | Vodacom SA | 257 |
| 4 | China | Research Institute of Highway, Ministry of Transport | 256 |
| 5 | United States | Comcast | 256 |
| 6 | China | Amazon Connection Services China | 256 |
| 7 | Ireland | Amazon Data Services Ireland | 128 |
| 8 | South Africa | MWEB Dimension Data | 64 |
Table 15 – Largest IPv6 Address Allocations in 2015 by organization
All of these are conventional address allocations to the service provider industry with one exception: The large allocation to the Chinese Ministry of Transport is presumably an address allocation in support of a very large scale sensor network within their transport network infrastructure using IPv6.
The Outlook for the Internet
The past five years have shown that the Internet is now an integral part of the portfolio of conventional communications sector business activity across the world. And the deployment of Internet services and the opening up of markets through deployment of Internet services is subject to the same economic opportunities and constraints as any other business activity. Those economies that were adversely impacted by the global financial situation, saw a drop in the expansion of new Internet services and a drop in their demands for IP address allocations across 2009-2011. While other economies that managed to avoid the worst impacts of a financial recession continued to see growth in new Internet markets across those years.
This period has been dominated by the mass marketing of mobile Internet services, and the growth rates for 2014 and 2015 perhaps might have been the highest so far recorded, were it not for the exhaustion of the IPv4 address pool. In address terms, this growth in the IPv4 Internet is being almost completely masked by the use of Carrier Grade NATs in the mobile service provider environment so that the resultant demands for public addresses in IPv4 are quite low and the real underlying growth rates in the network are occluded by these NATs.
In theory, there is no such requirement for IPv6 to use NATS, and if the mobile world were deploying dual stack ubiquitously then this would be evident in the IPv6 address allocation data. Unfortunately, no such very large-scale, broad-scale deployment of IPv6 was visible in the address statistics for 2015. This points to a mobile Internet whose continued growth in 2015 remains, for the most part, highly reliant on NATs, and this, in turn, points to some longer term elements of concern for the continued ability of the Internet to support further innovation and diversification in its portfolio of applications and services.
We should also be seeing address demands for deployments of large-scale sensor networks and other forms of deployments that are encompassed under the broad umbrella of the Internet of Things. The 2015 IPv6 address allocation data points to a single such deployment in China. This does not necessarily imply that the deployment of such device networks are merely a product of an over-hyped industry, although that is always a possibility. It is more likely to assume that such deployments take place using private addresses and once more rely on NATs. Time and time again we are lectured that NATs are not a good security device, but in practice NATs do offer a reasonable front line defence against network scanning malware, so there may be a larger story behind the use of NATs and device based networks than just a simple conservative preference to continue to use an IPv4 protocol stack.
We are witnessing an industry that is no longer using technical innovation, openness, and diversification as its primary means of propulsion. The widespread use of NATs in IPv4 limit the technical substrate of the Internet to a very restricted model of simple client/server interactions using TCP and UDP. The use of NATs force the interactions into client-initiated transactions, and the model of an open network with considerable flexibility in the way in which communications take place is no longer being sustained in today’s network. Incumbents are entrenching their position and innovation and entrepreneurialism are taking a back seat while we sit out this protracted IPv4/IPv6 transition.
What is happening is that today’s Internet carriage service is provided by a smaller number of very large players, each of whom appears to be assuming a very strong position within their respective markets. The drivers for such larger players tend towards risk aversion, conservatism and increased levels of control across their scope of operation. The same trends of market aggregation are now appearing in content provision, where a small number of content providers are exerting a dominant position across the entire Internet.
The evolving makeup of the Internet industry has quite profound implications in terms of network neutrality, the separation of functions of carriage and service provision, investment profiles and expectations of risk and returns on infrastructure investments, and on the openness of the Internet itself. The focus now is turning to the regulatory agenda. Given the economies of volume in this industry, it was always going to be challenging to sustain an efficient, fully open and competitive industry. But, the degree of challenge in this agenda is multiplied many-fold when the underlying platform has run out of the basic currency of IP addresses. The pressures on the larger players within these markets to leverage their incumbency into overarching control gains traction when the stream of new entrants with competitive offerings dries up, and the solutions in such scenarios typically involve some form of public sector intervention directed to restore effective competition and revive the impetus for more efficient and effective offerings in the market.
As the Internet continues to evolve, it is no longer the technically innovative challenger pitted against venerable incumbents in the forms of the traditional industries of telephony, print newspapers, television entertainment, and social interaction. The Internet is now the established norm. The days when the Internet was touted as a poster child of disruption in a deregulated space are long since over, and these days we appear to be increasingly looking further afield for a regulatory and governance framework that can continue to challenge the increasing complacency of the newly-established incumbents. It is unclear how successful we will be in this search.
But at this point in time we can but wait and see.
The views expressed by the authors of this blog are their own and do not necessarily reflect the views of APNIC. Please note a Code of Conduct applies to this blog.
Geoff –
As I noted elsewhere, this is quite an interesting post (as usual), but I was surprised by the fallacy of equating the change in the routing of an address block with a change in the rights holder to a given IP address block entry in the Internet Number Registry System, as you suggest here –
“That leaves two thirds of these addresses that are not listed as being transfered by the registry, yet were ‘revived’ and announced in the Internet’s routing system in 2015. … A more thorough analysis of address transfers from both the perspective of the registry system and the routing system is called for, to see if more light can be shed on this aspect of address management.”
As you are aware, ISP decisions on whether to route an address block can be based on many business factors, and ISPs can configure their equipment to route any IP address block they wish, i.e. there is not a one-to-one linkage between entries in the routing table and the party associated with IP address blocks in the IPv4 registry. This is quite distinct from the ability to transfer rights to an entry in the IP registry – the latter always lies with the registrant in the IP registry and is independent of the present specific routing of the address block.
Given that the runout of the IPv4 free pools in various regions is naturally causing ISPs and large organizations to become more efficient with their address space management (including conducting internal inventories, audits, and the migration of previously internal IPv4 address blocks to public-facing applications), the appearance of previously unseen address blocks in the routing tables is actually quite normal. For those needing more time in IPv6 migration, the ones with large number of IP address blocks (e.g. from the days of early telecom mergers and consolidation) will better utilize their existing inventory, and those who do not have access to such reserves will seek solutions in the market – just as you highlighted via the rapidly increasing IPv4 transfer statistics.
An otherwise fine article – thanks for your efforts!
/John
John Curran
President and CEO
ARIN
“there may be a larger story behind the use of NATs and device based networks than just a simple conservative preference to continue to use an IPv4 protocol stack”
Without IPv4 you don’t have most of the Internet. So the question is really why they continue to use an IPv4 protocol stack without deploying IPv6 alongside it.
Here I see dual-stack as the problem, not the solution. The IPv4 leg makes the IPv6 redundant; the IPv6 leg doesn’t give you anything significant that the IPv4 leg didn’t already give you. Since you *must* deploy the IPv4 leg anyway, why bother with the IPv6 one? What commercial advantage does it give you? For most people the answer today is “none”, so it goes to the bottom of the pile.
What about reaching IPv6-only content? I predict that there is not going to be any significant amount of that until at least 95% of end users have IPv6 access (today that figure is closer to 10%). Remember what happened with IE5: even though it was painful and expensive, most websites continued to support IE5 until the proportion of users fell to around 1%, rather than risk losing customers. This reinforces the client-side view that only IPv4 matters.
On the other hand, unloved as it is, IPv6 probably isn’t going away – Google and Facebook by themselves could probably sustain it.
Hence I foresee the Internet moving to an uncomfortable stalemate with a permanent IPv4 A+P architecture plus some IPv6, unless we can make IPv6-only Internet access sufficiently usable – that is, at least as good as being behind a NAT44 – so that deploying IPv6-only access networks becomes realistic.
This is very hard, given that IPv6 was designed as a wholesale replacement of IPv4, rather than an extension of it. The only way I can see is to build a global anycast NAT64 infrastructure, but that has its own set of problems.
Brian –
You just paraphrase RFC1669; i.e. giving feature parity, and the need for smoothly running NAT for transition, why would folks deploy IPv6 rather than simply NAT44.
The good news is that there is a reason, but it takes serious long-term planning to appreciate the benefits provided by IPv6-based access infrastructure. One need only to look to T-Mobile as an example, where they are using IPv6 as their access infrastructure and 464XLAT for backwards compatibility. The net result is that their NAT infratrastructure requirements drop over time as more content becomes IPv6-enabled, in contrast to NAT44 solutions which become more challenging and expensive over time.
IPv6 can serve as a wholesale replacement for IPv4, but the transition has indeed been made more challenging by lack of a standard transition strategy. The IETF set out to do this originally, but in the end decided to leave the selection of approach to each organization. The net result is that some organizations will take a more long-term view while others may watch the Internet pass them by…
/John
John Curran
President and CEO
ARIN
Certainly IPv6 can work well for mobile access, and there has been successful deployment there, for various reasons.
The question posed by Geoff is why, in general, so many people remain on their IPv4 stacks and aren’t deploying IPv6.
I would suggest that the individual cost/benefit equation doesn’t stack up for them. Everyone still must deploy IPv4, so they must question whether the *additional* cost of deploying and supporting IPv6 is worth it, as opposed to other things they could be doing. Today, it would appear that many of them are making the call that is not.
I don’t think you can question that judgement, because they are the ones best placed to decide what is in their own interest. Are they “watching the Internet pass them by” as you put it – or are they shrewdly conserving and deploying their capital? If they were genuinely putting themselves at a disadvantage, then their competitors would happily take up the slack, and it is patronising to suggest that they can’t see whether this is (or is not) the case.
There is also a large group who don’t have any option. I live in the UK – most consumer and small business ISPs simply don’t offer IPv6. It’s a highly competitive marketplace. There are boutique ISPs who fill the IPv6 niche, but it’s a small niche; few people are willing to pay the boutique prices. Conversely, the large ISPs need to minimise overall cost, which includes end-user support cost, and they are best placed to decide whether adding IPv6 achieves that.
Content providers have fewer reasons not to deploy IPv6, but they too see little reason to do so when they know all their end users have IPv4 access. I can think of well-funded, technological-leading organisations who have not deployed IPv6 on their world-facing websites. Again, if there were an overall benefit to them, they would have done so.
Geoff makes the point that the large established players having a strangehold over the IPv4 pool is unhealthy for competition and disadvantages new entrants. I don’t think anyone can disagree with that, but people act in their own interest.
Compelling people to do things for the benefit of society is generally the job of government – for example, look at how legislation has compelled businesses to serve disabled people better. Few would say that has not been a good thing. However, this is also the antithesis of how the Internet has developed historically.
Brian –
You presume that organizations are actually aware that IPv4 is slowing running out and that IPv6 deployment is even an option; i.e. one can be a “well-funded, technological-leading organizations” and be completely unaware of IPv6. I know this first-hand by speaking to global 1000 corporations with premier IT departments who express complete surprise that IPv6 is being deployed. Often they looked at the “IPv6 issue” more than a decade ago, saw little activity, and haven’t looked back since; sometimes, it’s more based on an unshakable belief that anything the “bright engineers of Internet” did to solve the IPv4 problem would of course be completely backwards compatible (chuckle – aren’t they in for a surprise?!)
The fact is that it will take decades before many of the already connected organizations realize that there is a IPv4 runout issue; this is because once an organization is connected to the public Internet, there’s no apparent reason to change that connection.
The truth of the matter is quite different, as many companies are finding out over time. Noting the IPv6 deployment by rapidly growing mobile operators, Facebook deployed IPv6 for its application and has reported that it runs 15% faster than the IPv4 path to the same customers (http://www.lightreading.com/ethernet-ip/ip-protocols-software/facebook-ipv6-is-a-real-world-big-deal/a/d-id/718395) Because of some great measurements by APNIC’s Geoff Huston, we all know that the IPv4 and IPv6 protocols run at nearly the same speed, so whether the performance difference Facebook sees is in the application or because of the prevalence of NAT on IPv4 path remains an open question.
Similarly, companies in the US that rely on accurate metrics for their web traffic marketing have also begun to realize the need to their content on IPv6 as well as IPv4, since their visibility ends at the IPv4 CGN rather than going all the way to the mobile device – this has can have serious licensing and reporting implications.
There is no reason that organizations _must_ adopt IPv6, just as their is no reason that organizations _must_ connect to the Internet. However, those who ignore IPv6 run a comparable risk that they’ll regret their choice in the future and find themselves at a significant disadvantage compared to those incorporated IPv6 into their planning efforts.
Thanks!
/John
John Curran
President and CEO
ARIN
That many people are not aware of IPv6 is certainly an important factor – although I suspect few engineers or technical managers fall into this category these days.
That Facebook has successfully deployed IPv6 and derives benefit from it may be true, but is irrelevant to the question of why so many other organisations are not. Besides which, Facebook is not a typical case. It also builds its own data centres from scratch – that doesn’t mean it would make business sense for anyone else to do so.
You don’t need to convince me that I should be building IPv6 – I have. It’s everyone else you need to convince.
The problem I see today is that people are continuing to build IPv4-only networks even on green field sites. I think we firstly need to acknowledge this is happening, and identify the reasons.
Assuming these people are aware of IPv6, they are not choosing IPv4 over IPv6; they are choosing IPv4-only over dual-stack. And as I see it, the benefits of dual-stack are marginal whilst the costs are measurable and significant – in engineer time, in contractor fees, in ISP fees, in security configuration, and in ongoing maintenance.
Unfortunately, as long as end sites are deploying IPv4-only networks, the content providers will continue to provide the content on IPv4 (and maybe on IPv6 as well). For them, the cost of continuing to support IPv4 is minimal while the cost of losing eyeballs is huge – like the situation with IE5 I mentioned before.
Now, if people are rejecting dual-stack at the customer access side, the only way I can see to break out of this vicious cycle is to make IPv6-only access networks as feasible ways of being part of the Internet. Then the network builders have the option to choose IPv6-only over IPv4-only, which is a lot more attractive than dual-stack (or is it? Perhaps we should ask them?)
One way is to *force* all content onto IPv6; that clearly isn’t going to happen. There is much legacy and unmaintained content. So the only other way I can see is to provide NAT64 access from the new Internet to the v4-only content. As you say, some mobile operators do this successfully, but they don’t have to support the fixed-line access use cases.
A proportion of people will complain if they can’t have inbound access from the IPv4 Internet. For home users this includes things like gaming, that they do today on NAT44 with UPnP and port forwarding from their own CPE’s IPv4. Doing that on a central NAT46 is tricky. And businesses are almost certainly going to need an IPv4 address of their own, for things like inbound VPN and SIP connections, which won’t survive a NAT46 conversion. Perhaps delivering them IPv4 over a 4-in-6 tunnel to just where it is needed is the answer. I believe we must avoid the requirement to dual-stack their whole network, because given that choice, they will prefer IPv4-only.
The other reason I think it’s critical to make IPv6-only connections work is because everyone is expecting v4-depletion to force v6 rollout. If this requires deploying dual stack, then v4-depletion may instead force A+P – and I don’t think anyone wants that as a long term situation. Deploying dual stack does *nothing* to reduce your IPv4 requirements, until some unspecified date in the future when the v4 leg can be turned off.
Thanks for the interesting discussion. I think your observations in RFC1669 showed a great deal of foresight. I am just worried that the end-game is not going the way we want, and that this is too important a problem to pretend does not exist.
Regards, Brian.