The Internet has evolved from an ‘information superhighway’ to an essential service, much like electricity, gas, or water. For most people, the Internet is their primary means of communication. Even communication methods that have traditionally been analogue, such as telephony, are now almost entirely digital and the communications themselves are typically delivered using Internet protocols. As a result, the absence of the Internet for any large group of people is a newsworthy event, as it would be if any other essential service was cut off.
But, as the audience for this blog post will know all too well, the resilience of the Internet is not something that we can take for granted. Significant Internet outages occur on a surprisingly frequent basis, with some outages being dramatic enough to generate headlines around the world (such as the Optus outage in Australia in 2023).
However, many other outages occur that do not attract such widespread attention. This is in part because the people who are affected by the outage are often unable to communicate their situation (their Internet is down, after all!). Another reason is that it can be difficult for the outside world to identify that an outage has occurred, who is affected by the outage, and the root cause of the outage.
With that in mind, the Internet Intelligence Lab at the Georgia Institute of Technology is operating (and continually improving) a scalable and reliable system for detecting Internet outages in as near to real-time as possible, which is called Internet Outage Detection and Analysis (IODA). IODA focuses on identifying macroscopic Internet outages, such as outages that affect a significant portion of the population within either a geographic region or an Autonomous System (AS). By detecting and cataloguing Internet outages, we can raise awareness of major outages as they are happening so that appropriate measures can be taken to react to them and work towards building a better understanding of the nature of Internet outages.
Causes of outages
This is not an exhaustive list, but it covers the majority of the outages that we typically see.
Fibre cuts: Damage to fibre optic cables is a regular occurrence and is often caused by accidental damage from digging machinery. Fortunately, most networks account for fibre damage by incorporating redundancy into their network design, so any damage from a single rogue excavator is unlikely to have any noticeable effect on Internet connectivity for end users.
However, there are some cables, often under the ocean, which are critical to the connectivity of certain regions. If those cables are damaged, then those regions are going to be cut off from the Internet. A good example is the outage that occurred in Tonga in 2022 following a volcanic eruption. The eruption damaged the only submarine cable to the economy, causing the entire population of Tonga to be cut off from the Internet.
Natural disasters: Aside from being a leading cause of cable damage, weather events and natural disasters can also impact Internet connectivity in other ways. In particular, hurricanes, typhoons, and cyclones will often leave Internet outages in their wake.
Damage to electricity infrastructure is a major factor in these kinds of events. Even if the core network is protected by being inside a sturdy data centre with access to a generator, large numbers of people will still lose Internet access if their homes are without power.
Shutdowns / blackouts: Internet shutdowns are a type of outage that is used by authoritarian governments to suppress protests and regain information control when faced with civil unrest. In a shutdown, the government will order Internet providers to cut off Internet access in areas where unrest is occurring, creating an outage.
Many motivations underpin these outages. One is to disrupt the ability of protesters to communicate and organize using social media or messaging apps. Another is to prevent footage of oppressive or violent counter-protest actions from reaching the rest of the world. Once the government has regained control, then the shutdown can be ended.
The extent of an Internet shutdown can vary, ranging from complete blackouts where the entire Internet is inaccessible, to disruptions that only affect particular providers (such as mobile services), through to the selective blocking of particular platforms. Throttling network performance is also becoming increasingly common.
Conflict: Other forms of human conflict can also affect Internet connectivity. The situation in Ukraine has led to many outages throughout the war, as Internet infrastructure is damaged by military activity and operators are forced to flee conflict zones. Similar impacts have been seen recently in Gaza, where a lack of stable electricity supply prevented networks from being able to stay up and provide service.
Cyberattack: Attacks in cyberspace can be just as effective at damaging Internet connectivity for their targets. A poorly mitigated Distributed Denial-of-Service (DDoS) or ransomware attack can easily take down a network, creating an outage for that network’s users.
Operational failure: Despite an operator’s best efforts, there is always the possibility that their network may fail due to unforeseen circumstances. Human error, software bugs, and hardware failures can all potentially result in a major problem that causes an outage for the users of the operator’s network.
One thing to note is that IODA alone cannot determine the cause of an outage. Rather, it often requires a collaborative and cross-disciplinary effort to analyse and understand an outage reported by IODA. The IODA team works with digital rights activists, researchers, journalists, other Internet measurement groups, and censorship evasion tool developers to confirm each other’s observations and to share relevant context that will assist in inferring the most probable cause of an outage.
Data sources
The underlying methodology used by IODA is based on the ongoing collection of Internet measurements that we have identified as suitable indicators of Internet connectivity. Some of these measurements are performed first-hand by the IODA team at Georgia Tech, but others are derived from data collected by other third-party sources. IODA currently collects data for four different metrics, which are briefly described below:
Border Gateway Protocol (BGP): We use the bgpview software to collate the public BGP announcements from both the RouteViews and RIPE RIS route collection projects. This produces a ‘view’ of the global routing table at each five-minute interval. We then use that view to calculate an estimate of BGP visibility for each geographic region and ASN, where visibility is defined as the number of /24 blocks that are seen by at least 50% of the peers at the route collectors. Networks that are no longer participating in BGP will manifest as a decrease in the number of visible /24s, which we can then use to infer a possible outage.
Active probing: Our active probing framework uses a technique based on the Trinocular method to probe a wide range of IPv4 addresses across the Internet using Internet Control Message Protocol (ICMP) echo requests. The Trinocular method is designed to probe efficiently and therefore be less disruptive than a typical scanning process. Probing rounds are run at 10-minute intervals, and we record the set of /24 IPv4 address blocks that respond to our probes. Because active probing is primarily targeting endpoints rather than the core, this approach offers better visibility into the effect of outages on the users at the network edge.
Telescope: A network telescope is a collection of unused IPv4 address space behind a passive tap that simply records all the unsolicited traffic that is routed to those addresses. This traffic, sometimes referred to as background radiation, is ever-present on the Internet and we have observed that if a particular region or network suddenly stops emitting this traffic then that can indicate that there is an outage event that is preventing those hosts from reaching the rest of the Internet. IODA has partnered with the ORION telescope at Merit to undertake these measurements. The ORION telescope is monitoring approximately 500,000 unused IPv4 addresses and sees close to 10GB of unsolicited traffic every hour.
Google Transparency Report: GTR is a public dataset released by Google that shows the relative usage of different Google services in each economy. The values that are published are heavily normalized, much like a stock exchange index, so each data point only has meaning relative to the previous ones. In the event of an outage, there can be a significant divergence in the metrics collected from GTR if the outage means that users are unable to access Google services.
GTR data is reported at 30-minute intervals and there is a lag of at least two hours before a measurement for a particular half-hour becomes available via the GTR API. This means that it is not as useful as the other signals for real-time outage detection but can assist greatly in retrospective analysis and confirmation of outages found using the other metrics.
Methodology
Using IP-to-geolocation mappings from a commercial provider, as well as CAIDA’s Prefix to AS mappings, we process and aggregate the measurement results to produce time series data points for each economy, ASN, and administrative level 1 region in the world. This allows us to analyse connectivity at a relatively fine-grained level, as many outages only affect a particular province within an economy or may be confined to a particular set of ASNs. We refer to each time series as a signal, for example. the ‘BGP signal for Ukraine’ refers to the time series derived from BGP visibility measurements across all prefixes that geo-locate to Ukraine.
We then apply anomaly detection algorithms to each of the signals to look for any changes or variations that would indicate that Internet connectivity for the corresponding region or ASN has been significantly degraded. For our current set of metrics, a large, unexpected drop in the metric value is typically what we are trying to detect. Metrics that are relatively stable over a long period, such as BGP visibility, do not require complicated algorithms to recognize drops but signals that feature more diurnal variation have required us to investigate more advanced forecasting techniques such as S-ARIMA.
Outages found by our algorithms are assigned an outage score based initially on the magnitude of the difference between the expected and observed values for the signal at the time of the outage. If an outage is observed for the same region or network in multiple signals (for example, both the BGP and Active Probing signals have a noticeable decline), then the outage scores are combined multiplicatively to reflect the much greater likelihood of the outage being genuine.
We publish both graphs of the time series data and overlays showing the inferred outage events to the IODA website. We also provide a dashboard that highlights the recent outages that have the highest outage scores. Particularly significant outages that are detected by IODA are manually verified and then announced to the public via Twitter and Mastodon. If we are able to discover the underlying cause, either through collaboration with other experts in the field or using information provided by contacts in the affected zones, then that information too is disseminated through our social media channels.
Because of IODA’s ability to document and demonstrate the impact of Internet shutdowns, it is an integral tool and source of data to the Internet Freedom community globally. IODA signals and outage events are a primary source for Access Now’s annual Keep It On (KIO) report and the KIO STOP database. This report is foundational to the advocacy work in the defence of the Internet as a human right.
Real outage examples
Now that I have explained how IODA works, let’s look at some recent examples of outages that occurred in the APNIC region and see how they appeared on the IODA website.

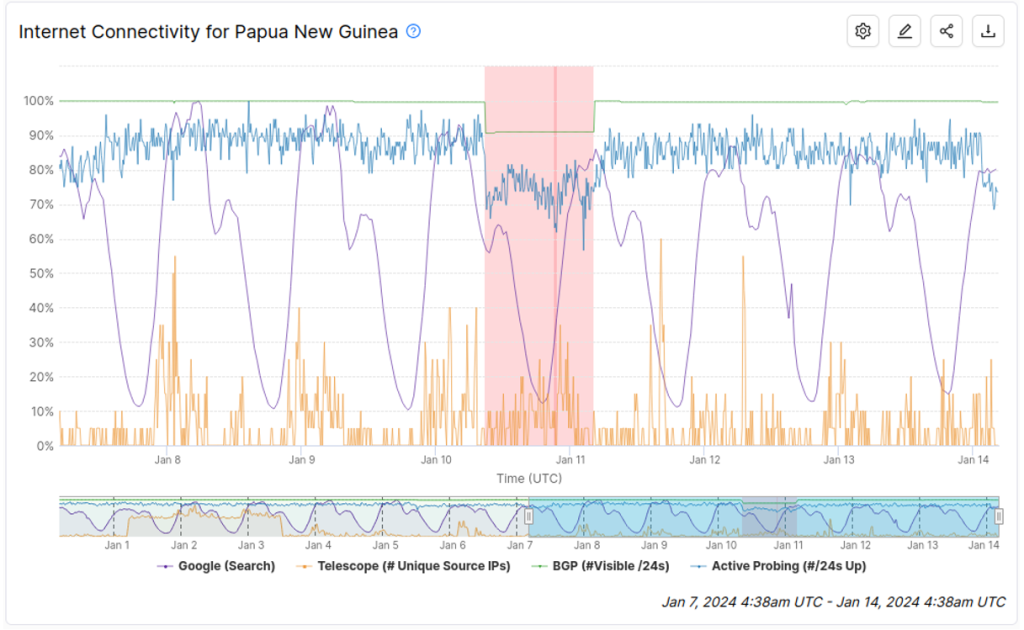
The first example is an outage that happened during the civil unrest in Papua New Guinea in January 2024. Figure 1 shows the graph of the IODA signals collected during the outage, as well as a few days on either side to provide context. Each signal is drawn using a different colour — blue for Active Probing, green for BGP, orange for Telescope and purple for GTR. The portion highlighted in red is when IODA’s algorithms automatically detected a possible outage.
The graph shows that there was an obvious decrease in the BGP and Active Probing signals for nearly an entire day, starting on 10 January 2024. This observation correlates with news reports describing riots in Port Moresby (the capital of PNG) while police were on strike. Based on those news reports, it appears likely that the outage was caused by damage to Internet infrastructure during the riots. Conversely, there was no evidence to suggest that this particular outage was a government-mandated shutdown.

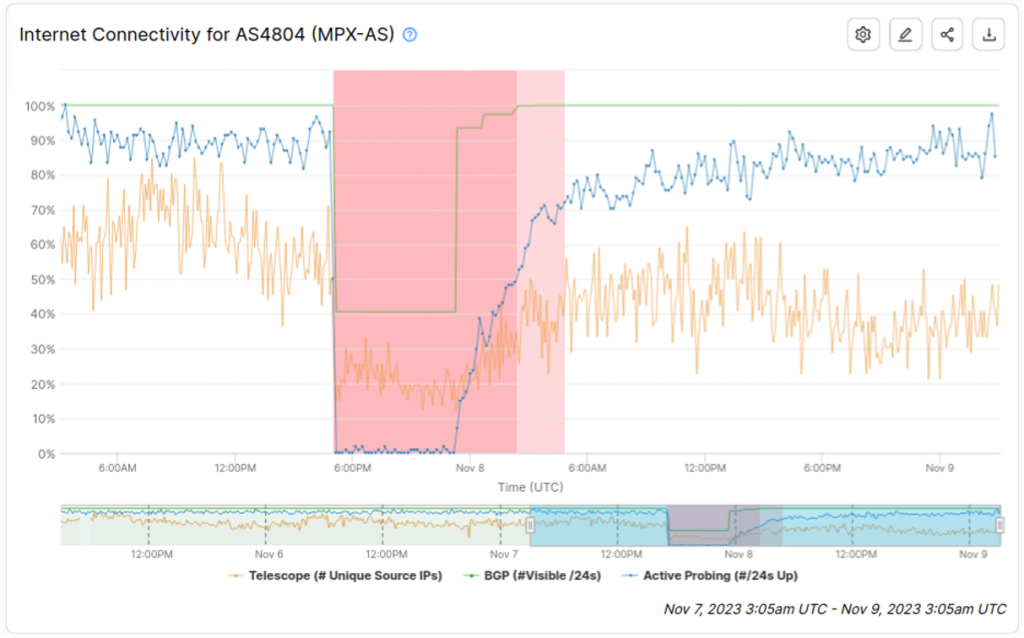
Last year’s Optus outage in Australia is very apparent in the IODA signals for AS4804, which are depicted in Figure 2. In this case, the Active Probing signal drops down to almost zero, and a significant proportion of the BGP prefixes announced by Optus are also no longer visible. Once Optus can bring their routers back online, the BGP signal jumps back up to reflect that those prefixes are visible again. At this point, the Active Probing signal begins a gradual return to normal as customers can rejoin the network, but the recovery does take several hours to complete.

In some economies, an election is typically accompanied by a government-ordered Internet shutdown. This is a tactic employed intended to undermine the ability of the opposition to campaign and to limit voter’s access to relevant information.
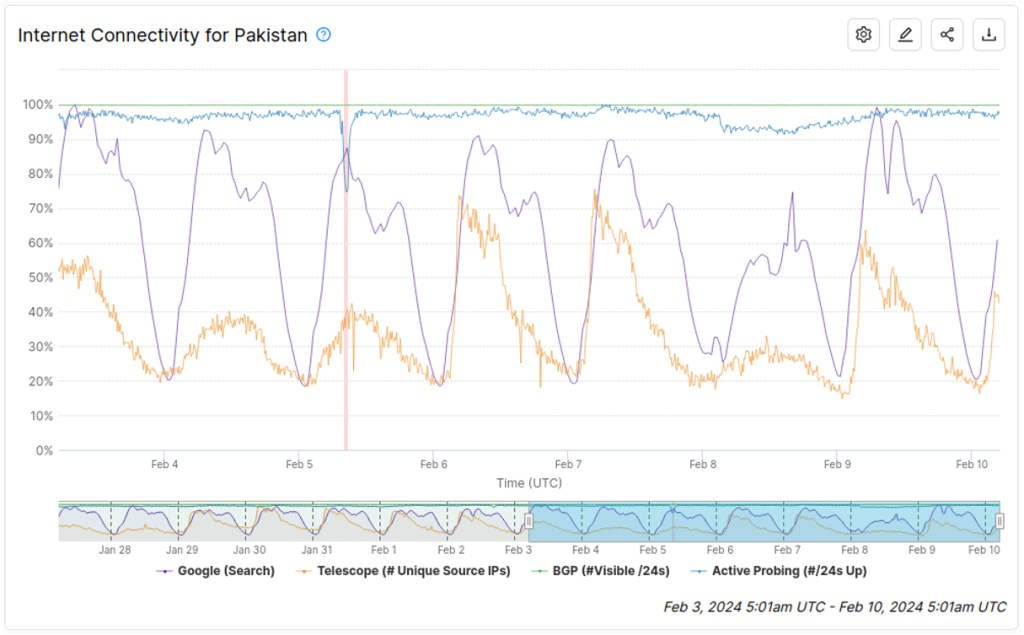
Figure 3 shows the IODA signals for Pakistan during the week of the national election in February 2024. There was one outage detected by IODA on 5 February, where the Active Probing signal dipped sharply for a brief period, but we did not find any direct evidence to suggest this was related to the election. On election day itself (8 February), the Interior Ministry ordered a shutdown of mobile networks; this is most apparent in the Google Transparency Report and Telescope signals but there are also some visible signs of the shutdown in the Active Probing signal.
Unfortunately, IODA was unable to automatically detect this outage as there was a relatively small impact on the Active Probing signal due to only mobile endpoints (which typically do not respond to active probes) being affected.
Another contributing factor was that we had not yet deployed the improved anomaly detection methods that account for seasonal variation, and thus the decrease in the GTR and Telescope signals was not recognized as anomalous. However, we often learn valuable lessons from situations where IODA ‘misses’ an outage and these lessons feed into the planning around future data sources and analysis techniques to improve IODA’s coverage of outage events in the future.

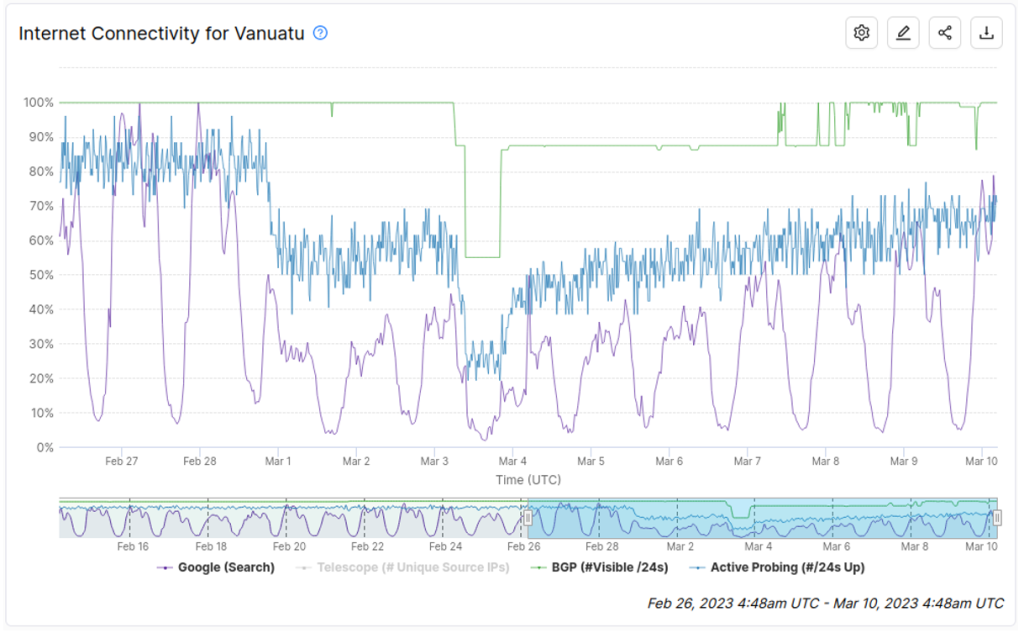
The final example in Figure 4 shows IODA signals for Vanuatu in early March 2023, when tropical cyclones Judy and Kevin struck the Pacific nation in quick succession. I have removed some elements from the IODA graph to improve the readability of the signals — the shaded background that IODA typically uses to indicate the outage period and the telescope signal. The telescope signal was removed because Internet Background Radiation from Vanuatu is very sparse and therefore does not add any useful information.
Cyclone Judy was the first weather event to hit on 1 March 2023 and the impact is clearly apparent in the Active Probing and GTR signals. The BGP signal, however, was unaffected which suggests that the network operators were able to keep their core networks functioning during this time. The outage persisted through the following two days until Cyclone Kevin made landfall on 3 March. This amplified the outage as additional damage to the already stretched power and Internet infrastructure caused the Active Probing and GTR signals to plummet further. With Kevin, IODA also saw a drop in the BGP signal as some networks that survived Judy were now disconnected.
Over the following days, we saw a gradual recovery of connectivity but even as of 10 March (one week after Kevin), the IODA signals suggest a significant number of people in Vanuatu had still not been reconnected.
Conclusion
IODA continues to be a work in progress; the Internet Intelligence Lab team has many ideas for improvements to IODA’s capabilities and we are working hard to secure the funding and resources to make those improvements happen. Organizations that wish to contribute towards the ongoing maintenance of IODA can do so by making a donation to Georgia Tech, using ‘Supporting the IODA project (55F433)’ as the Designation.
The IODA website is freely available and allows anyone to browse the signals and outage events for any economy, province, or ASN that we collect data for. We encourage readers to take a look around and welcome feedback on IODA.
We are especially interested in hearing from people who can offer us further insight into Internet outages that are occurring in their particular region. Having access to local knowledge is very helpful as this knowledge can add important technical, political, and geographic contexts to the outages that we see in IODA so that we can better explain and validate them. We appreciate the insights of network operators due to their unique perspective on how the Internet functions in their part of the world.
If you have feedback to share or want to reach out to us with more information about any outage events, please send us an email at ioda-info@cc.gatech.edu.
Shane Alcock is an Internet Measurement Specialist (Alcock Network Intelligence Ltd, Searchlight Ltd), the lead developer of OpenLI, and worked for the WAND network research group at the University of Waikato as a research programmer for over 15 years.
The views expressed by the authors of this blog are their own and do not necessarily reflect the views of APNIC. Please note a Code of Conduct applies to this blog.

What about Internet outages, that are caused by service provider like Amazon local outage?