
A significant and growing part of Autonomous System (AS)-level traffic exchanges takes place at Internet Exchange Points (IXPs). This type of interconnection is facilitated by PeeringDB, a database where network operators report information to find new peers. PeeringDB is considered an authoritative source of information, comprising 10,000 ASes reporting 30,000 ports at 800 IXPs located all over the world. This scale makes the peering ecosystem difficult to understand in its entirety.
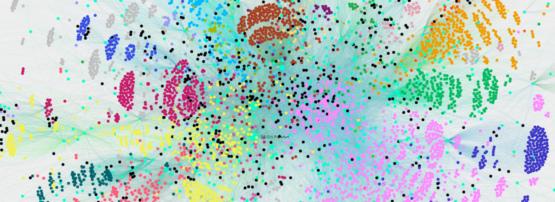
To understand this better, my colleagues at the University of Toulouse, the Internet Initiative Japan, and I propose to model the size of the ports that ASes have at IXPs as a weighted, directed bipartite graph. This new model of the Internet is shown to picture relevant features of a complex network that groups ASes and IXPs in geographical areas of influence (Figure 1).
From this model, we can extract the central players of public peering such as hypergiant AS content providers and major regional traffic receivers. Most importantly, this graph model opens the way to apply spectral analysis using a reduced Google matrix to retrieve the intensity of possible interactions between ASes based on pure connectivity information. To illustrate this use, we retrieved the timely evolution of the peering network to show how the central content and cloud providers increased their reach to eyeball networks during the COVID-19 pandemic.
Graph construction
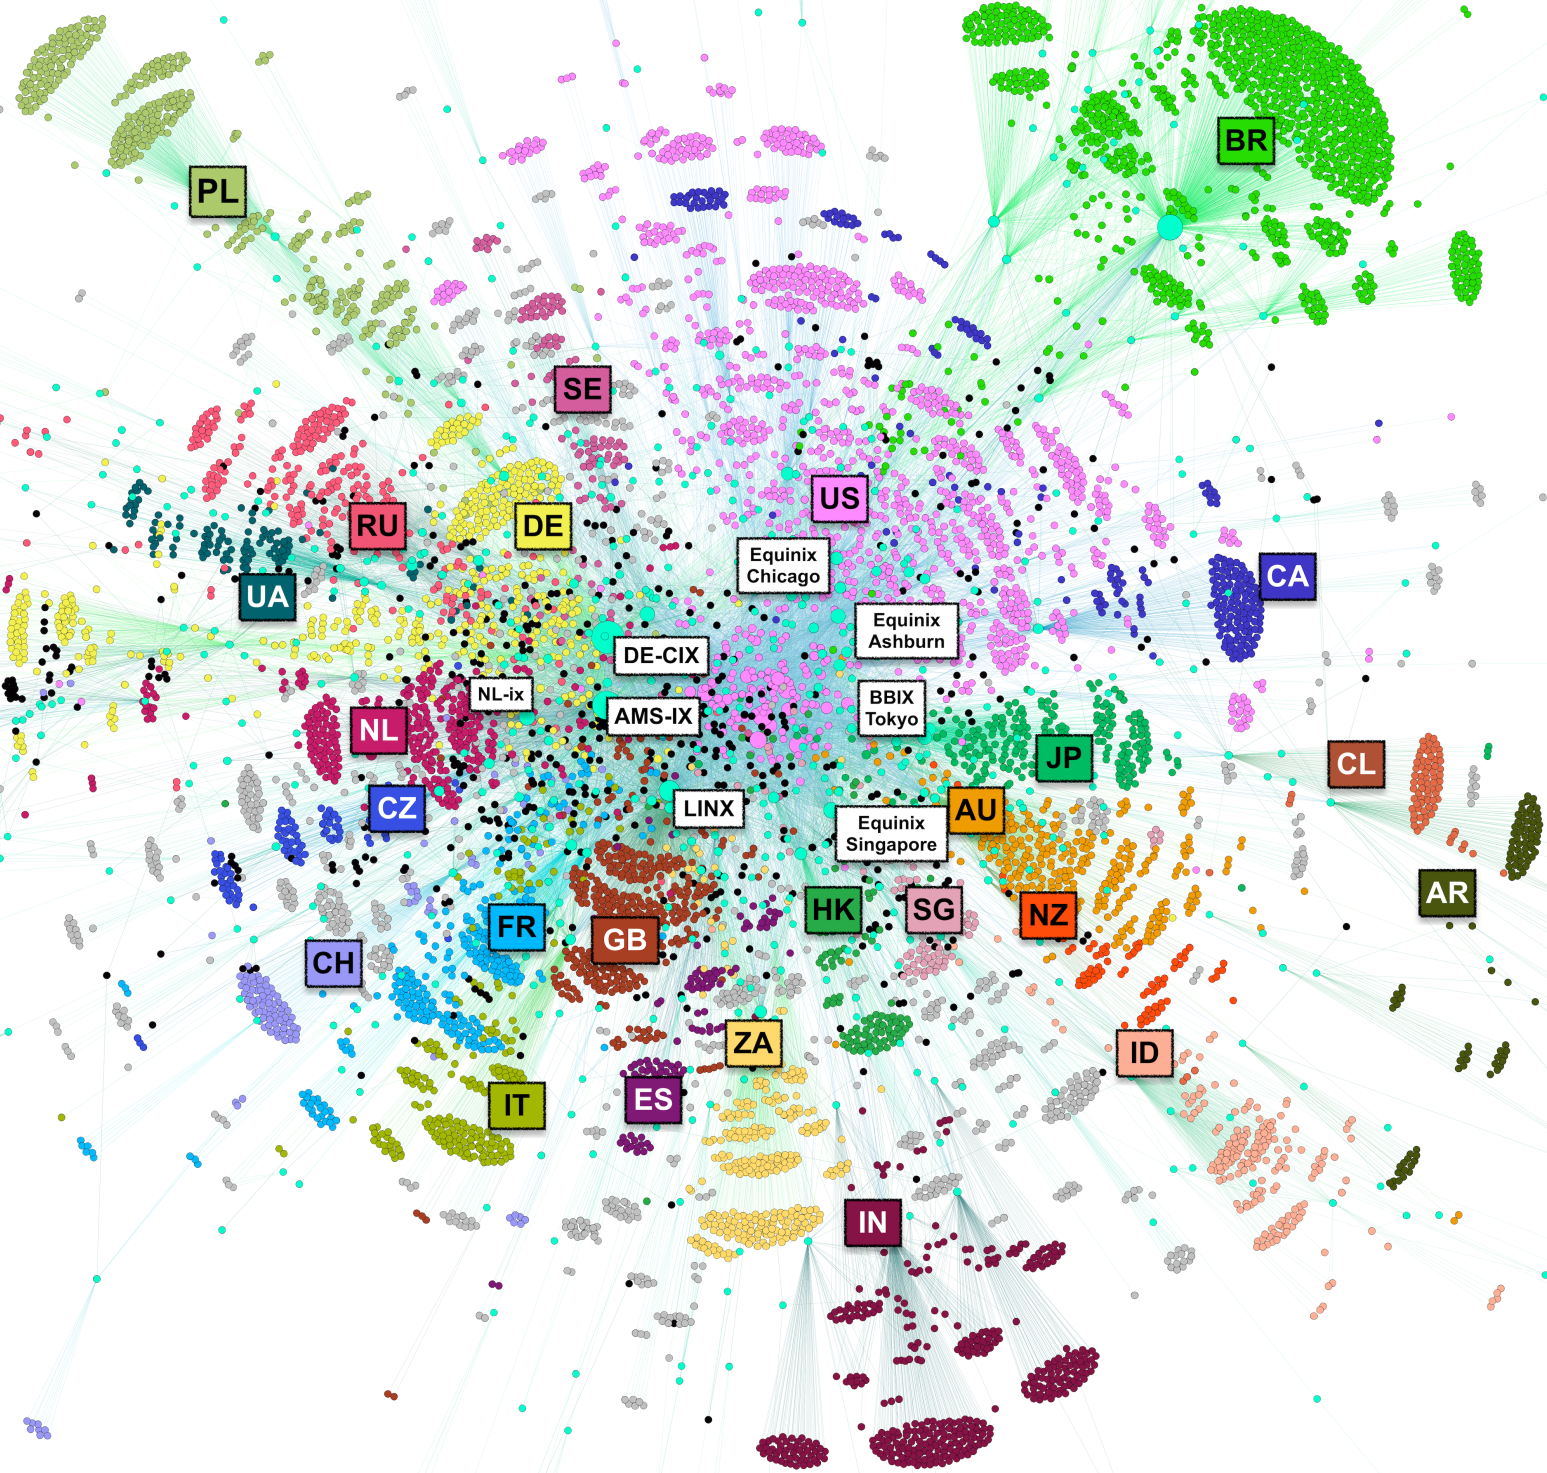
The size of ports that ASes own at IXPs is represented by a bipartite, weighted graph. Today, traffic is highly directional, flowing from the main content provider to eyeball networks. To capture this with a graph, we divided each link port size into two directions with different weights (Figure 2).
As shown in Figure 2, the ratio is based on the info_ratio attribute of the AS reported in PeeringDB. Heavy Inbound (Outbound) uses 100% of the inbound (outbound) link and only 5% in the other direction. For Mostly Inbound/Outbound we defined a 100%/25% utilization, and Balanced or Unknown ASes use both links at full capacity.
Key peering actors
We showed that the graph is expressive enough to identify key peering players such as important content providers (also known as hypergiants) or regional eyeball networks. Therefore, we used specific node centrality metrics such as PageRank and reverse PageRank.
Hypergiants
Using reverse PageRank, we extracted the top 20 sets of ASes that are the most capable of diffusing traffic globally. This set encompasses major content providers and CDNs, such as Facebook, Amazon, Akamai, Google, Apple, Microsoft, Netflix, Cloudflare, StackPath, Hurricane Electric, Fastly, OVHcloud, Limelights Networks Global and Yahoo!
Eyeball networks
Now that we know from where most of the traffic originates, we questioned if ASes closest to end users, known as eyeball networks, can be retrieved from PeeringDB. Intuitively, we expect these networks to be characterized by strong inbound behaviour in their geographical area of influence. As such, we then identify them using the PageRank metric and the geographical information contained in the graph. To determine each ASes country, we leveraged their presence at IXPs.
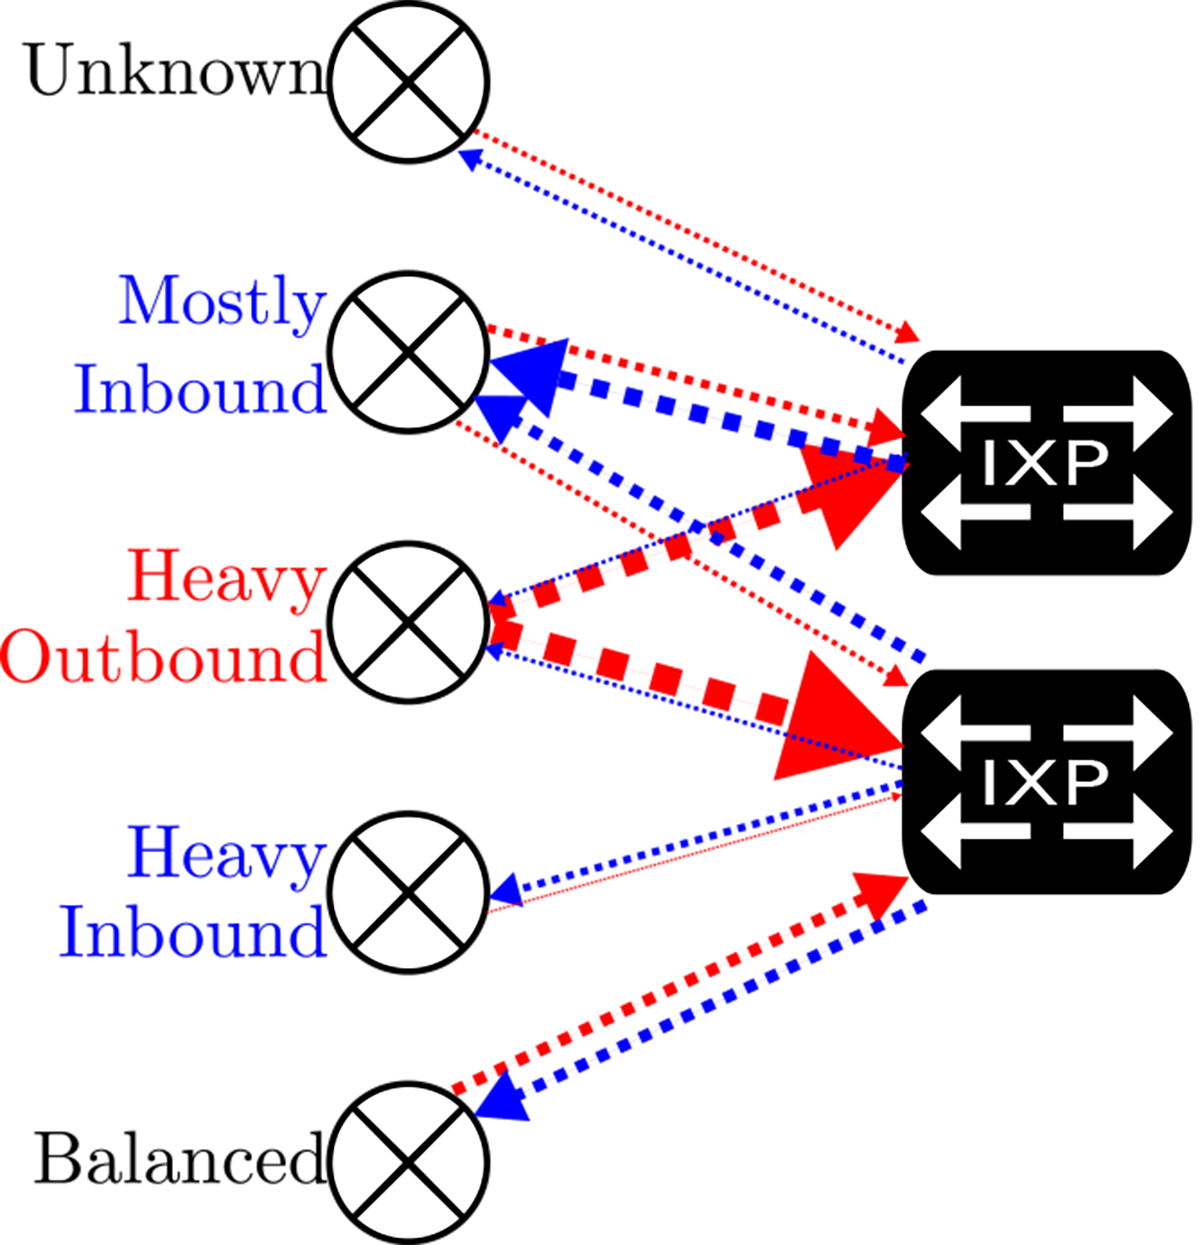
In PeeringDB, IXPs have an accurate economy attribute that we propagate to ASes — if an AS is present mainly at French IXPs, then we also consider it as French. Then, for some economies of interest, we identify the four largest traffic receivers with the PageRank metric. For validation, we use the APNIC dataset that contains the end user market share (EUMS) of Internet Service Providers (ISPs).
Figure 3 shows the collected EUMS for a different group of ASes — the black bar is the EUMS of ASes in PeeringDB, the red bar is the same thing but only the top four ASes by EUMS, and the blue bar is the four traffic receivers identified by our procedure. We can see that our method captures a significant part of EUMS. The list of ASes is given on the x-axis of Figure 5.
Retrieving AS-AS links
With hypergiant diffusion patterns to eyeball networks, the largest peering players are identified, but we cannot know how they interact as there are no direct AS-AS links in the bipartite graph. However, we can derive these direct links by stochastic complementation, from Markov chain theory. We rely on the co-occurrence of ASes at IXPs, weighted by port size and the AS-reported ratio of inbound to outbound traffic, to estimate the possible traffic exchange between ASes on the global scale. This possible traffic exchange is described by a matrix shown in Figure 4.
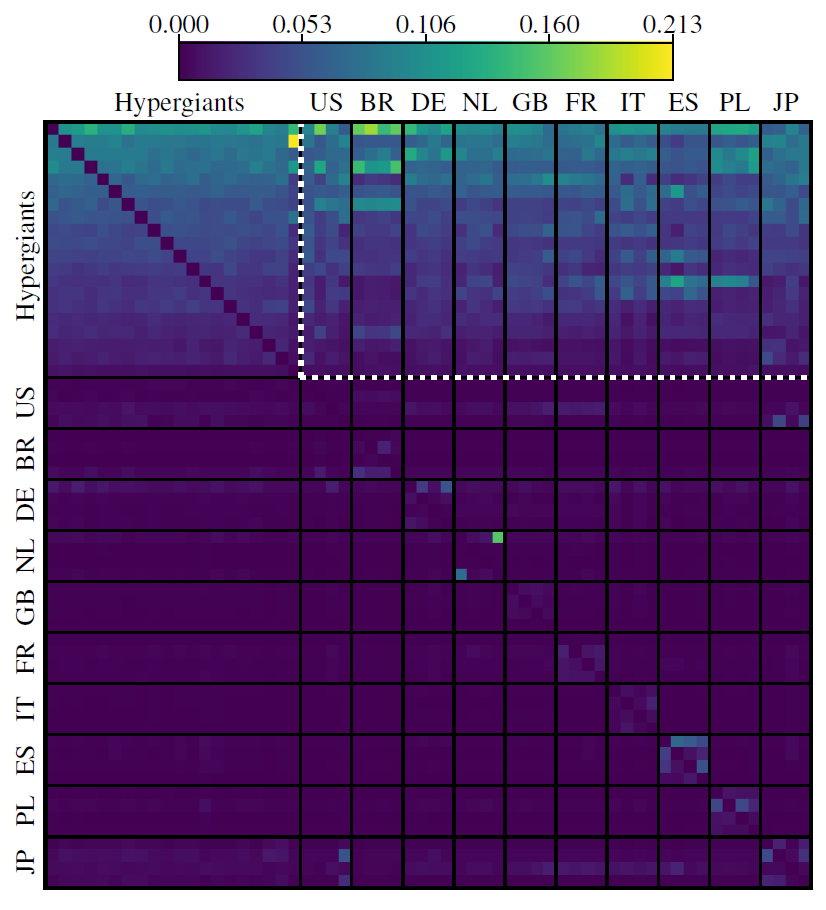
The $(i,j)$ element of this matrix represents the probability that traffic arriving at AS $j$ originates from $i$. We observed a block of strong links in the upper right corner, identified by white dotted lines, which underlines the diffusion of hypergiants to the main regional ISPs. The concentration of links in this area confirms the hold of the hypergiants on the regional ISPs. The second property is the block structures appearing on the diagonal of the matrix, which highlights the local traffic exchange enabled by the IXPs.
COVID-19 impact on the peering ecosystem
We can now study the impact of COVID-19 on the hypergiant diffusion pattern by zooming in on the hypergiant diffusion area (the white dashed portion in Figure 4) and calculating the relative time difference. The positive and negative changes are shown in Figure 5 for two snapshots before and after the pandemic’s outbreak, on the dates 1 January 2020 and 1 June 2020. This shows that Netflix invested the most, mainly in France, Italy, Japan, and the UK, followed by Microsoft which invested in the UK, Italy, and Japan, then Fastly in Poland, Italy, the UK, and finally Edgecast in Italy and Spain.

Conclusion
We propose a novel Internet network model from the PeeringDB database records that offers a coarse but realistic picture of the overall capacity provisioned by ASes in the peering ecosystem. Its originality lies in the weighted and oriented edges that capture the port sizes and ASes info_ratio labels, respectively.
From this model, we can identify key Internet players such as the state-of-the-art hypergiants and important regional eyeball networks present in the PeeringDB database. We have shown that it is possible, with a stochastic matrix representation of this graph and its stochastic complementation for a reduced set of ASes, to quickly extract their capacity of interconnection offered to the global physical public peering infrastructure. As a use case, we propose a study that quantifies and identifies the links affected by the 2020 COVID-19 outbreak.
This article is based on a research paper Global Internet public peering capacity of interconnection: a complex network analysis.
This research was also presented at the EuroIX 36th Forum.
Justin Loye is PhD student at Institut de Recherche en Informatique de Toulouse and Laboratoire de Physique Théorique, Université de Toulouse, with an interest in complex networks, non-linear dynamics, and artificial intelligence and machine learning.
The views expressed by the authors of this blog are their own and do not necessarily reflect the views of APNIC. Please note a Code of Conduct applies to this blog.
Great works! I am wondering whether the scale of the graph allows us to process that with NetworkX?