LibreQoS is an open source project and the subject of a popular recent APNIC Academy webinar. Responding to feedback given at the webinar, this post will look at the features of LibreQoS. It is primarily used by Internet Service Providers (ISPs) but is useful on any larger network, or network for which you wish to gain performance insights. It’s been used everywhere from high-speed fibre networks to wireless networks deep underneath the ground. While LibreQoS is open source and available on GitHub, it includes an optional paid cloud add-on called Long-Term Statistics (LTS).
LibreQoS offers two primary services to ISPs or other large networks:
- Quality of Service (QoS)
- Traffic analysis
LibreQoS operates as a transparent network bridge and is agnostic to routing protocols or network layouts.
Quality of Experience
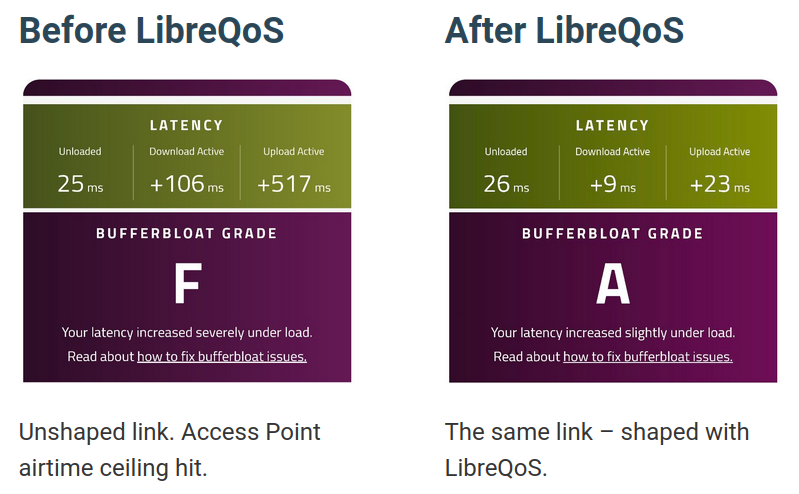
The Quality of Experience (QoE) portion of LibreQoS is designed to limit customers to their designated ‘speed plans’ — which can be flexible or fixed and to apply latency-minimization techniques through the CAKE queue discipline. Unlike most QoE services, LibreQoS can understand the topology of your network. By defining your network’s layout, you can model the bottlenecks — and LibreQoS will scale service appropriately to overloaded regions while minimizing perceived latency. This is especially useful on large networks that may have portions with limited or overloaded capacity.
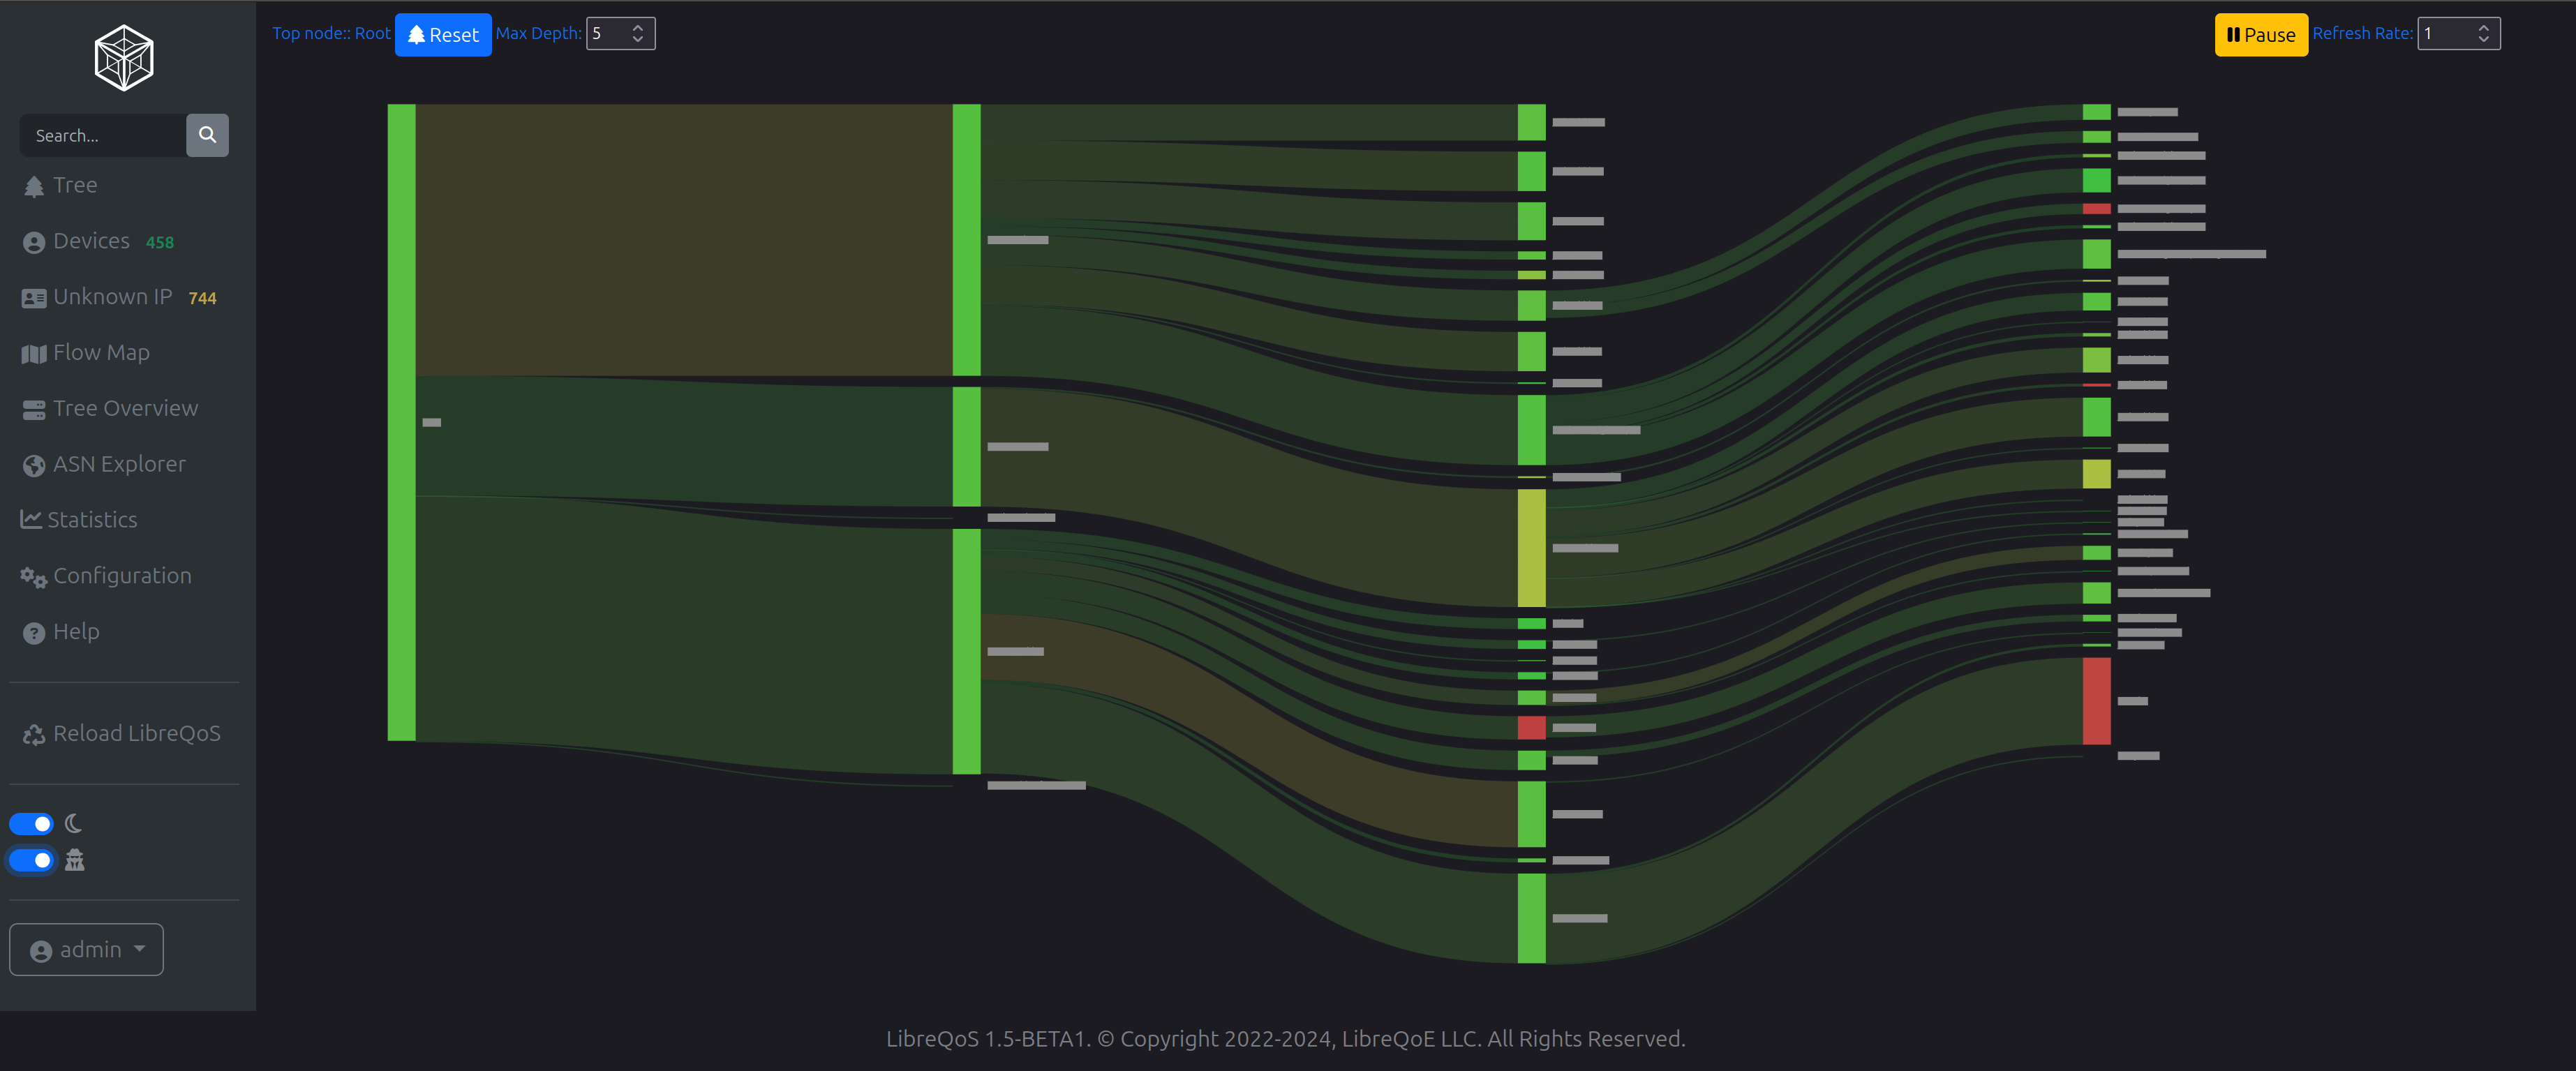
LibreQoS first build a Linux HTB tree, representing your network. This provides plan enforcement — customers receive the bandwidth you have allocated to them. You can specify ‘commit’ and ‘ceiling’ rates allowing LibreQoS to try and guarantee a commit rate and allow bursts to ceiling rates if excess capacity is available. For example, a network representation might look like this:
Primary Site (10 gbps / 10 gbps)
    Large PoP (10 gbps / 10 gbps)
        (customers)
        Wireless Link to Micro PoP (500 mbps)
            Micro PoP Access Point
                (customers)
    Smaller PoP (1 gbps / 1 gbps)
        (customers)
Accurately modelling the links between sites, and network capacity allows LibreQoS to fairly enforce speeds in the event of congestion — while still maximizing customer experience.
The second layer of shaping uses CAKE from the Bufferbloat project. CAKE paces your packets, slowing flows to match the ideal speed for the given round-trip time (RTT) of any given flow. Flows are managed dynamically, and ‘small’ flows gain priority over large flows.
A traditional First-In, First-Out (FIFO) queue drops data as it enters the queue if congestion occurs. This can be fine for brief congestion, but in the longer term, it adds up to a disastrously bad experience for customers.

Instead, CAKE smartly drops packets to retain a steady, sustainable rate per connection.

No more ‘my meeting was interrupted because someone started a download’ — CAKE prioritizes the interactive flows, leading to happy customers.

Traffic analysis
The traffic analysis portion gives you a real-time view of your network. LibreQoS is designed to let you analyse your real-time performance on several levels:
- Total traffic
- Statistics per network region from the network tree
- Traffic per circuit — which can include multiple devices
- Traffic per-flow — traffic between specific endpoints with shared port numbers
Within each of these, you have real-time access to the following:
- Total traffic
- Total traffic per circuit
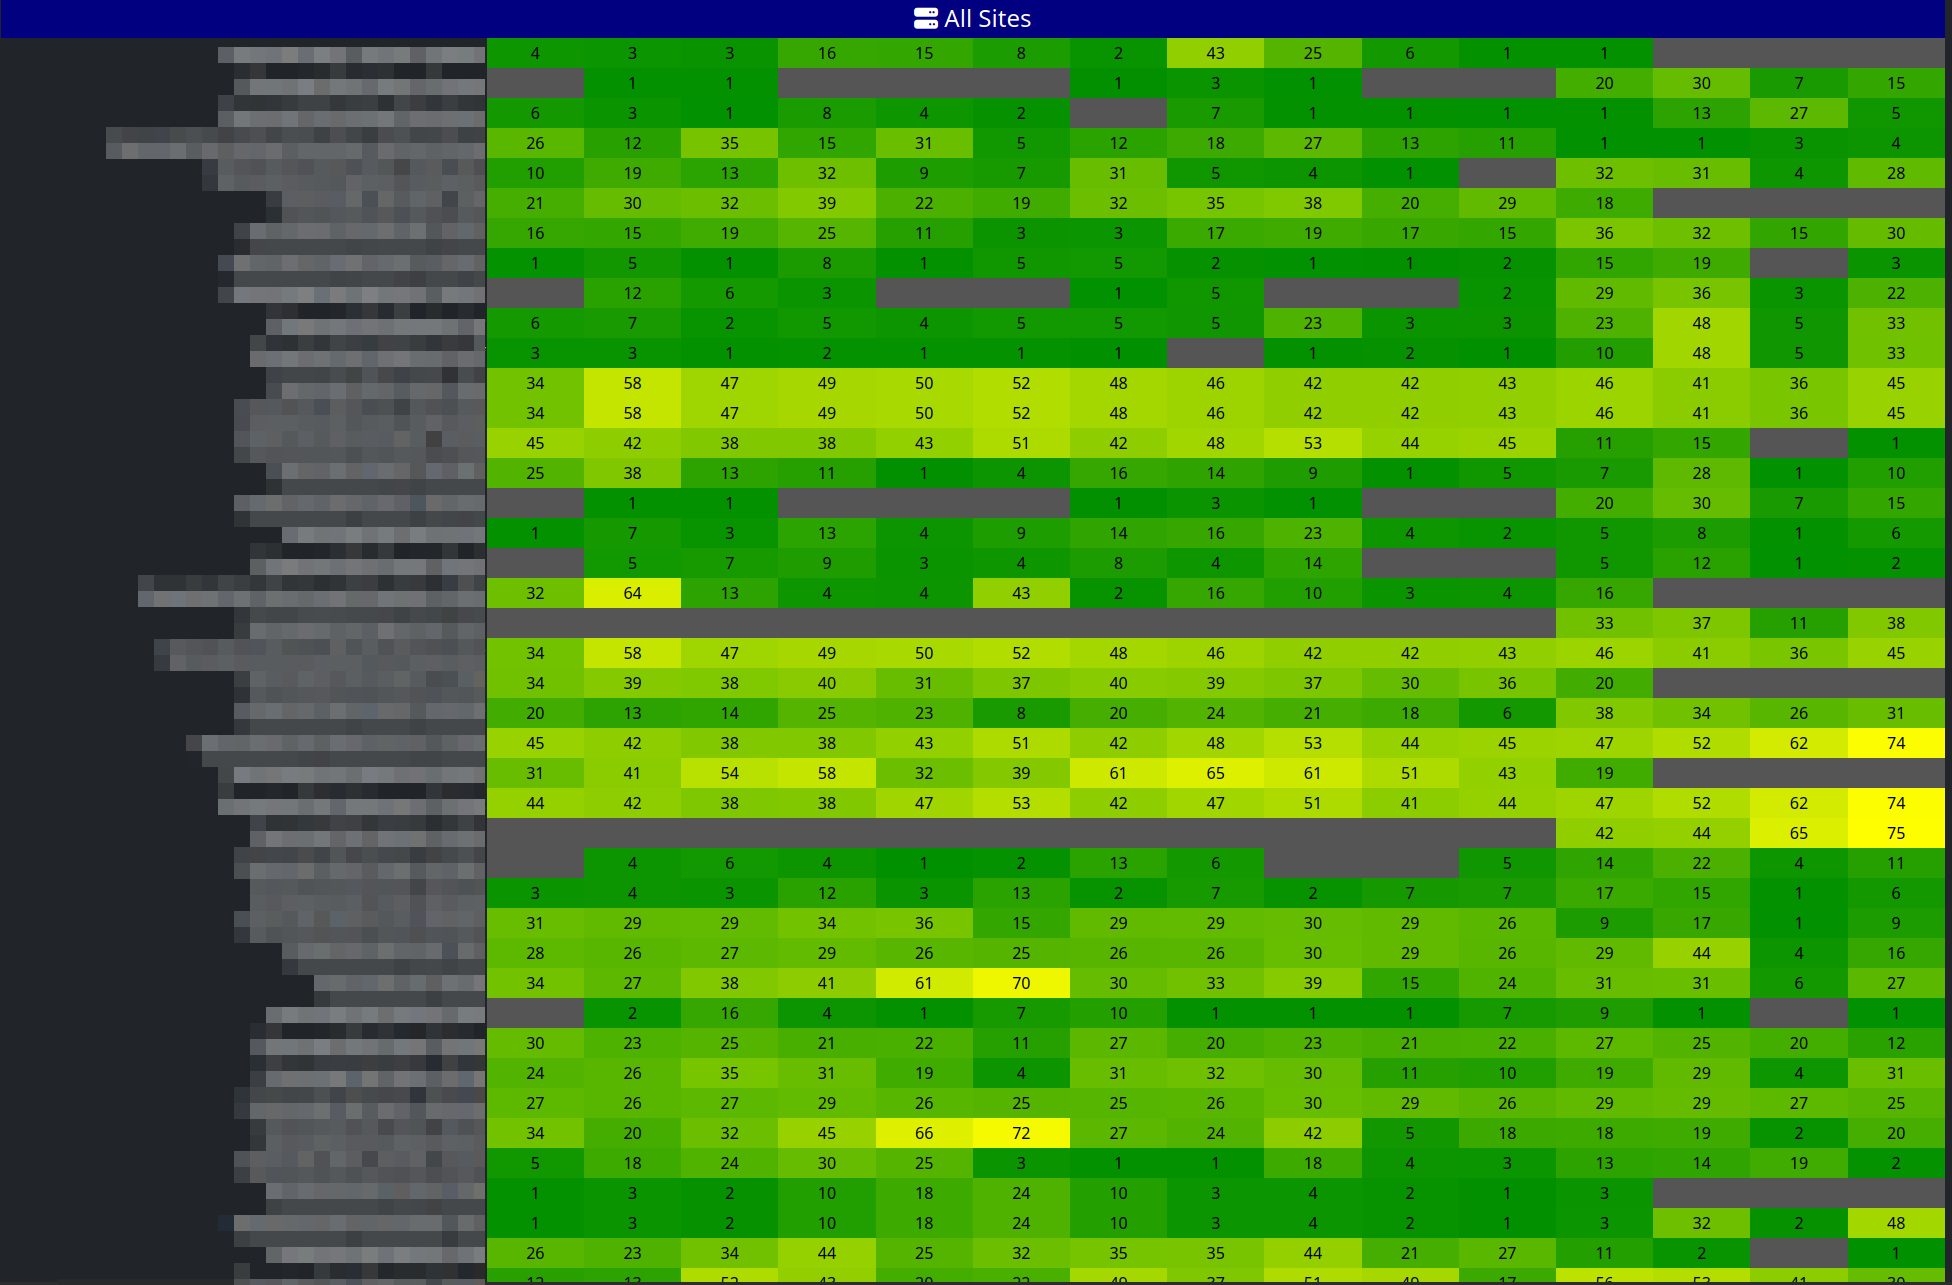
- TCP RTT analysis
- TCP retransmit data
Additionally, flow endpoints may be categorized by protocol, geographic location or Autonomous System Number (ASN) — giving you the ability to dive into the performance of your network, finding bottlenecks, faults, and opportunities to improve your overall routing behaviour.

Long term statistics
The paid portion of LibreQoS takes these statistics and aggregates them over time, providing a great long-term view of your network performance, and empowering you to both improve your network and manage trends proactively.

Conclusion
LibreQoS can be a useful tool for many network providers. You can analyse the state of your network, tracking these statistics over time, or using them for immediate ‘what’s broken?’ analysis. You can then start to apply rules to your network, improving perceived latency for your customers.
Learn more at LibreQoS.
Herbert Wolverson is the Chief Product Officer of LibreQoS, Rust trainer for Ardan Labs and helps run a small Wireless ISP in Missouri, USA. Herbert has been coding for more than 35 years and is the author of Hands-on Rust, Rust Brain Teasers and Advanced Hands-on Rust with the Pragmatic Programmers.
The views expressed by the authors of this blog are their own and do not necessarily reflect the views of APNIC. Please note a Code of Conduct applies to this blog.
