

Marco Davids, Caspar Schutijser, Cristian Hesselman, John Heidemann, and Georgios Smaragdakis contributed to this work.
Ancient Romans relied on sundials and water clocks to keep track of time. Keeping track of time is one thing; accurately transferring this information is another. In ancient Rome, you would have to walk up to a sundial or water clock to know what time it was — if you could find one.
Later, in the Middle Ages, churches started to deploy mechanical clocks in their towers (later upgraded to pendulum clocks, developed by Christiaan Huygens).
As a result, you no longer needed to walk to a sundial or water clock — time flew to your ears. By combining clocks with (very loud) bells, any person in town would receive a bell-encoded loud signal to tell them the time, as a public service. Many churches still provide this time service.
Modern humans rely on the stability of caesium atoms to deliver atomic precision time. Atomic clocks provide the time signal, and time information is propagated to computers and other devices using the Network Time Protocol (NTP) on the Internet (there is also the issue of how to synchronize atomic clocks, which is a bit of a chicken-and-egg problem, but let us not get sidetracked).
Internet timekeepers
In the US, the National Institute of Standards and Technology (NIST) has been providing free time services for decades. These are delivered using publicly accessible stratum-1 servers. The US Naval Observatory (USNO) is also a popular time service provider. Later, vendors such as Apple, Google, Cloudflare, Meta, Microsoft, and Ubuntu all started providing time services.
The NTP Pool provides a layer over NTP servers, providing a directory of publicly available NTP servers using the DNS. It does not directly operate NTP servers. The NTP servers themselves are run by volunteers, who range from Raspberry Pi users running home DSLs to large cloud operators. The Pool currently has more than 4,000 NTP servers listed in it.
Given there are so many time services to choose from, we wanted to know which ones are the most popular. To find out, we investigated Root DNS queries from 2017 and 2022 (DITL datasets). As we do not have access to real NTP traffic from these services, we resorted to using DNS query names to infer how popular the various services are (there are some caveats with using the DNS as a metric of popularity, which we discuss in a peer-reviewed paper).
Figure 1 shows how many IP addresses (DNS resolvers) have sent queries for each time service to the Root DNS. We see that the NTP Pool is the most popular time service by far, even more popular than NIST and large cloud/content providers, in the datasets for both 2017 and 2022.
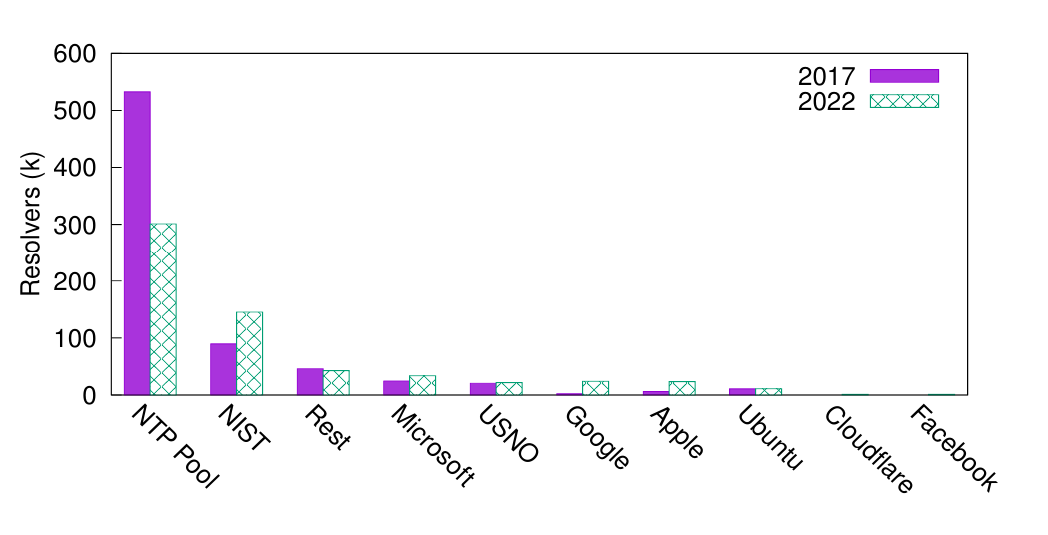
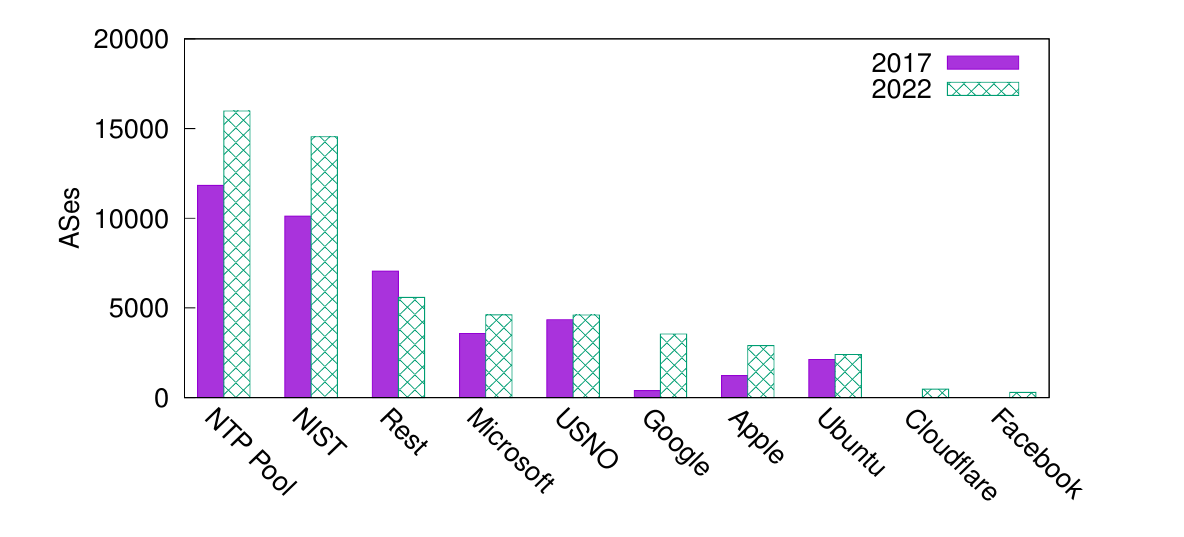
We obtained comparable results for the Autonomous System (AS) aggregation levels. It is quite remarkable that the community-driven NTP Pool is the most popular time service provider.
How does the NTP Pool map clients to NTP servers?
The NTP Pool currently lists 4.7 thousand NTP servers. How does it decide what NTP servers are assigned to each client?
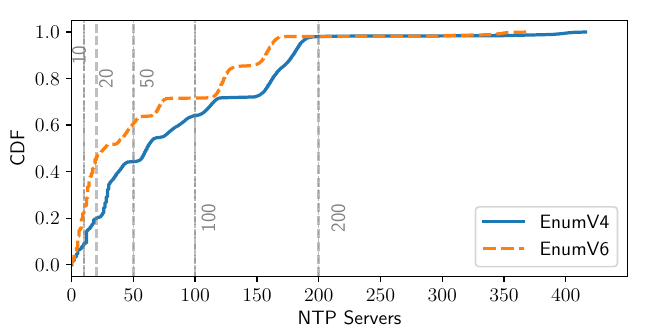
To answer that, we started using roughly 10k RIPE Atlas probes, to send DNS queries to the NTP Pool DNS servers, and analysed how many unique IP addresses (which are the NTP servers themselves) were returned. In short, clients send queries to pool.ntp.org, and we analysed how many unique responses there were over 24 hours.
We found that 10% of the Atlas probes are served by up to 12 NTP servers, and 30% are served by more than 100 NTP servers. Why such a discrepancy? Why do some clients have a more diverse set of servers than other clients? Why are some clients more equal than others?
GeoDNS, the time server assigner
GeoDNS is the authoritative DNS server made by the NTP Pool to map clients to NTP servers, and it has ultimate responsibility for this assignment. We downloaded GeoDNS and configured it, and carried out a series of experiments to figure out exactly how it works. Our experiments are covered in our paper, which you can check out for details.
In a nutshell, our analysis showed that it all depends on the client’s geolocation. If you are in Japan, you will be served only by the 21 NTP servers located in Japan. If you are in Cameroon, you will have only 1 NTP server, even if the NTP Pool lists more than 4.7k servers. And if there are no NTP servers in your own economy, then you will be served by NTP servers on your continent. For example, clients in Bolivia are served by all 46 servers located in South America.
Try it yourself
GeoDNS uses either the client IP address or the client subnet (ECS) specified in the DNS to map the user to NTP servers — ECS has higher priority. The implication of these mappings is that clients are bound by the number of servers available in their economy.
As we said, Cameroon has only one NTP server, as reported by the NTP Pool website. To know which NTP server this is, we can send DNS queries to pool.ntp.org, using a Cameroon-located IP address in the ECS option. Then we will see how the NTP Pool assigns NTP servers (if your device is configured to use, say, debian.pool.ntp.org or any vendor, the same mapping applies).
Want to try it yourself? Just run the Python code below.
import dns.message
import dns.query
import dns.rdatatype
import dns.edns

''' Define the ECS parameters
(replace ADDRESS with an IP address # geolocated in the economy
that you are interested in)
The client's IP address, I am using an address in Cameroon.
Replace with IP addresses located in economies you are interested in
'''
ADDRESS = '165.210.33.254'

PREFIX = 24  # Prefix length (typically 24 for IPv4)

#we query the default zone (pool.ntp.org)
# but we can use any vendor zone, like
# debian.pool.ntp.org or android.pool.ntp.org
ZONE='pool.ntp.org'

# Create an ECS option
ecs = dns.edns.ECSOption(ADDRESS, PREFIX)

# Make a DNS query for 'pool.ntp.org'
q = dns.message.make_query(ZONE, 'A', use_edns=0, options=[ecs])

# Send the query to one of the Pool authoritative servers
# in this case, I am using the IP address of c.ntpns.org.
auth_server_ip = '50.116.32.247'
response = dns.query.udp(q, auth_server_ip)

# Extract and process the response (e.g. print the IP addresses)
for rrset in response.answer:
    for rr in rrset:
        if rr.rdtype == dns.rdatatype.A:
            print(f'IPv4 Address: {rr.address}')
This code will return a single NTP server to all clients in Cameroon. In our view, this is a very restrictive form of mapping — why will only a single server be assigned to all users in Cameroon (there are 28.28M inhabitants in Cameroon, with 12.89M Internet users)?
This restrictive mapping of clients to servers raises two questions:
- Why does GeoDNS use such a constrained form of mapping?
- What are the consequences for clients?
Why is the mapping so constrained? Is such constraint necessary?
We asked the NTP Pool operators about the mapping, and we were told that it is about ‘minimizing the risk of asymmetric routing and dropped packets‘.
Well, it turns out that most Internet paths are already asymmetrical, so it is not an NTP Pool-only problem (there have been several studies dealing with NTP and asymmetrical paths).
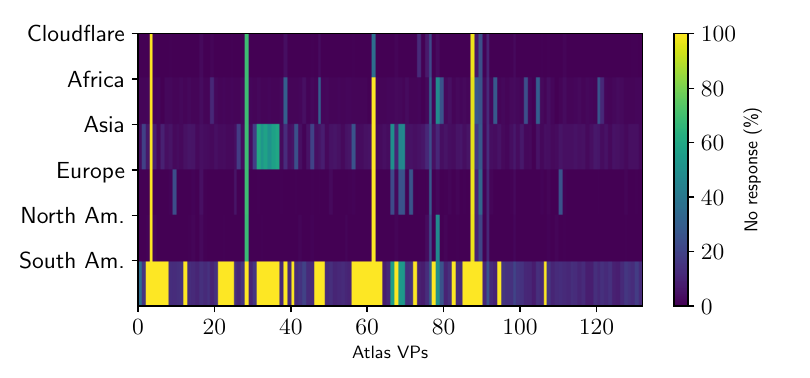
Regarding packet loss, we carried out experiments from 132 Atlas probes located in 21 economies that have Cloudflare as their only time provider if they use the NTP Pool. We compared the packet loss and precision from each probe to each NTP server if they were to use other time servers in other continents, instead of only using Cloudflare, in other words, if GeoDNS were to assign them to other servers elsewhere.
Figure 4 shows the results. We see on the x-axis individual Atlas probes, which are like real clients. On the y-axis, we see each NTP server (one per continent and Cloudflare, for reference). We see that most Atlas VPs have no problem connecting to NTP servers on other continents — the only exception is the South American servers, which many VPs had issues reaching. Most servers and Atlas VPs on other continents could deliver precise time information, and packet loss was not an issue. This small example demonstrates that such restrictive mapping is not needed — at least not on this small scale.
Consequences for users
The implications of the mapping for users are clear when we look into how many NTP servers they are assigned to.
Figure 5 shows the number of NTP servers all users from an economy have available if they use the Pool. Given that the NTP Pool comprises more than 4.7k NTP servers, we regard this distribution as highly skewed and unfair for the client population — African clients are served by far fewer servers than the US or West European clients. It looks like it perpetuates the division between the haves and the have-nots, unintentionally.
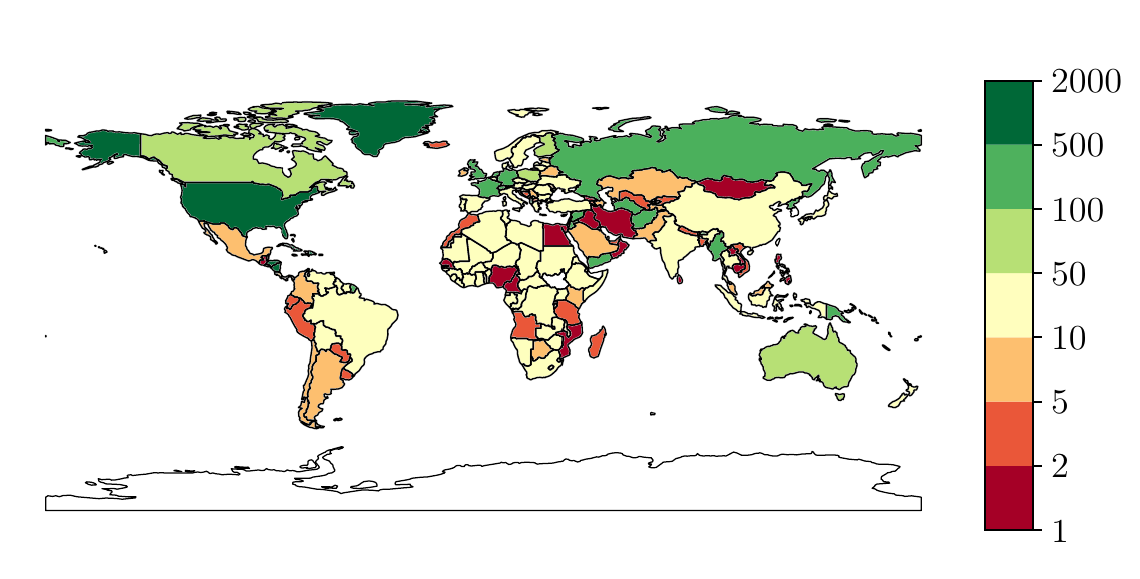
But the real issue is that users from 27 economies, totalling 767M inhabitants and 465M Internet users, are served by a single AS as a time provider when using the NTP Pool, even if the NTP Pool lists more than 4.7k servers. These are the economies in red in Figure 6 and expanded in the table.
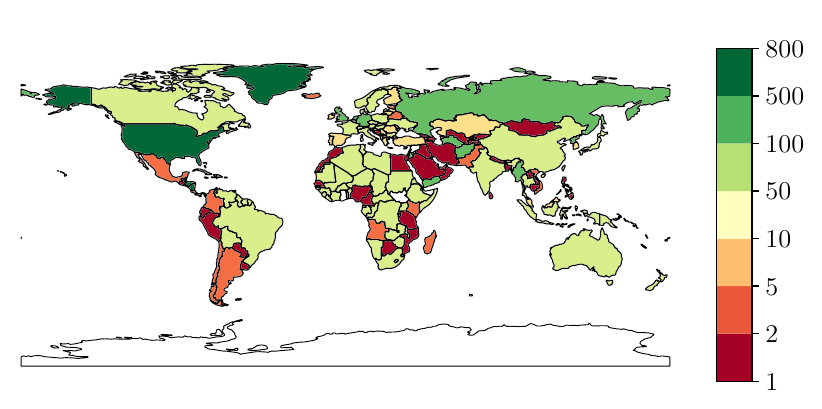
The table below lists all economies served by a single AS if they use the NTP Pool.
| Bahrain | Botswana | Cambodia | Curaçao | Djibouti | Egypt | Georgia |
| Gibraltar | Guatemala | Haiti | Iran | Iraq | Israel | Kuwait |
| Laos PDR | Lebanon | Macao | Mongolia | Mozambique | Nigeria | Oman |
| Panama | Philippines | Qatar | Rwanda | Senegal |
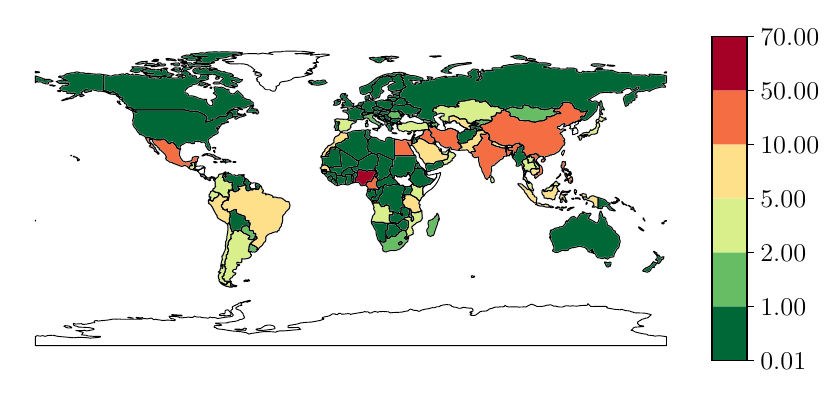
Next, we can compute the number of Internet users per NTP server if they choose to use the NTP Pool. We see that Nigeria, with two NTP servers only, has 60M Internet users per server. The US and Western Europe have fewer than 0.47M users per NTP server (many African economies have similar ratios, but this is because they do not have NTP servers in their economy, so they fall back to the African zone).
Security implications
There are multiple security implications of the constrained mapping. First, economies with no servers in their zone (which falls back to their continent zones) can have all their traffic monopolized by a single NTP server. All it takes is an NTP server to be added to their economy zone. If this NTP server happens to be malicious (sends false time information), it can be used to carry out time-shift attacks. We have shown in our paper (Section 4.3) how that happens incidentally with Guernsey.
The NTP Pool has its own monitors, which detect and evict badly behaved NTP servers, but they can also be fooled. The same attacks can be applied to affect some of the NTP traffic from one economy by creating a race condition. A determined attacker can shift the clocks of all NTP Pool devices in an economy if they carry out their attack carefully.
What’s next
We presented our findings to the NTP Pool operators in July 2023, and they are planning to fix the issue we identified, by having a new DNS name for the new zones, and then over time, migrating the old names to point to the new one (probably economy by economy) so we can start by migrating things that work poorly now. However, as far as we can tell, these changes have not yet been made.
Finally, even though the current NTP Pool setup has the issues described, let us not forget the big picture — that we should thank the NTP Pool’s volunteer operators, who have been running this service for 20+ years. They are the most popular time service on the Internet, one of the few services that have not (yet) been replaced by large cloud and content operators. Nevertheless, the system can be improved to prevent such restrictive mapping and potential security incidents.
This blog summarizes the main findings of our ACM SIGMETRICS 2024 paper.
Giovane Moura is a Data Scientist with SIDN Labs and an Assistant Profesor at TU Delft.
The views expressed by the authors of this blog are their own and do not necessarily reflect the views of APNIC. Please note a Code of Conduct applies to this blog.