

Providing reliable services is one of APNIC’s key performance indicators, and we have been measuring and reporting on their availability for many years in quarterly and annual reports. Site Reliability Engineering (SRE) helps set and maintain specific goals for system reliability, and APNIC is adopting some of these practices to improve the way our services are operated and measured.
APNIC currently monitors services in a variety of ways including sending probe requests to check response contents and how long a response takes to arrive, and monitoring logs for exceptions or other problem indicators. Additionally, APNIC monitors common dependencies like database operational metrics and the utilization of the underlying infrastructure of our services — things like CPU, disk, memory, and network usage.
To detect problems that might affect users coming from different locations, the probes run from both inside APNIC’s network and from external vantage points. This results in thousands of checks running every minute, with alerts for detected problems going to the APNIC operations team in real-time.
We also collect metrics across APNIC’s services and infrastructure, with dashboards to present a visual indication of trends over time, which is helpful to spot abnormal changes in services and/or infrastructure, as well as signalling potential upcoming bottlenecks to aid capacity planning.
Gaining insight into what Members and other users experience when using APNIC services is particularly important. To better measure this, we are going to include user experience metrics as part of APNIC’s availability measures. For many services, APNIC product teams already have access to this information through tools like Google Analytics. For our operations team to also have these metrics available will help make service availability problems more visible and actionable, with alerts generated for the on-call team when there are higher than normal unsuccessful requests and the availability target for a service is at risk.
Most APNIC services are request and response types where a user sends a request and the service sends back a response. The way we measure availability for most services is by defining what a successful request is and then find the ratio of successful requests to total requests.
For each request and its corresponding response, success can be determined based on the available information about the response. For an HTTP-based service, for example, the response code can be used to indicate a successful request. The definition of a successful request may include timing data such as how long it took the user to receive a response. If it took over two seconds for the user to receive a response, then this request/response pair may be considered unsuccessful. The availability measure then becomes:
availability = (successful requests / total requests). Including user availability measures will enable a more reactive approach to improving APNIC service reliability and help detect issues in parts of services not being regularly probed. APNIC will continue monitoring services to ensure consistent operation by sending probes and combining the results with the user availability measures. This enhances the availability metric to become:
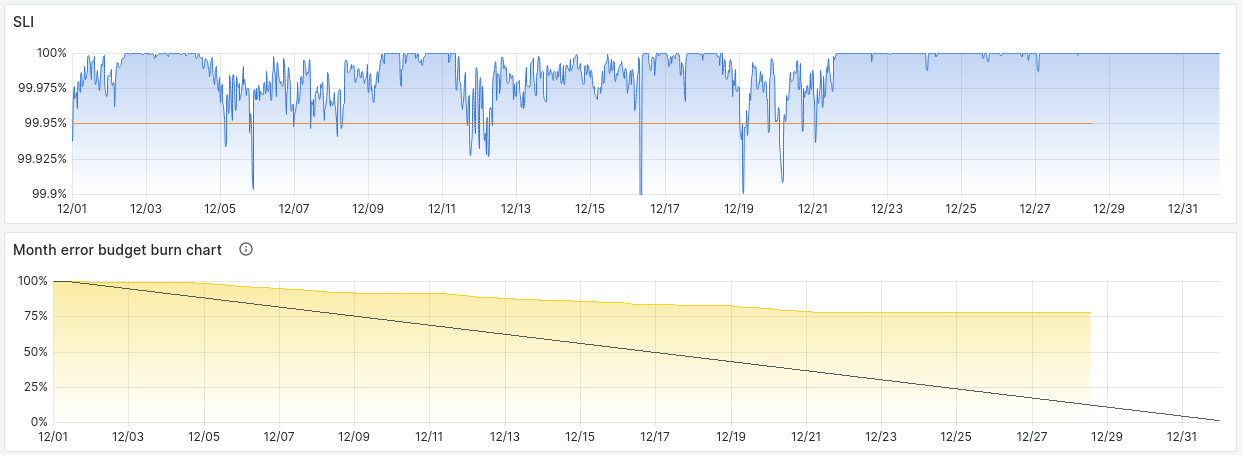
availability = (successful probes / total probes) * (successful requests / total requests). APNIC has availability targets for services, such as a 99.99% target for critical registry services (whois, RDAP, rDNS, and RPKI) and 99.95% for other services such as MyAPNIC. The tool currently used calculates availability to two decimal places; one of the goals of this work is to increase the granularity to three decimal places to have a more precise value.
To detect outages as quickly as possible, as well as to have more accurate measurements of outage lengths, APNIC will run probe measurements more frequently — every 10 seconds for critical services — up from the current default of every 60 seconds.
APNIC has started measuring RDAP in this way and will be making these measurement improvements to other core registry services, RPKI, Whois, and rDNS over the coming months. We will also work towards making applications recover faster from outages by adding more automated self-healing to reduce average downtime lengths. The availability metrics will be made available to the public. There is an initial prototype online, which will become part of the existing status page once ready.
The views expressed by the authors of this blog are their own and do not necessarily reflect the views of APNIC. Please note a Code of Conduct applies to this blog.