

Enterprise customers have embraced hybrid networks that employ multiple underlay technologies combined with an SD-WAN overlay. And for good reason.
Many Software as a Service (SaaS) applications and cloud services have been optimized to work over local Internet connections rather than through central Internet breakouts. The integration of an SD-WAN overlay addresses many of the concerns about network performance and security that come along with incorporating Internet into the WAN.
As detailed in a recent TeleGeography blog series, the Dedicated Internet Access (DIA) and broadband services included in these hybrid networks are often cheaper than MPLS — sometimes considerably so. This allows WAN managers to reduce network spend or increase their capacity while staying within the same budget.
But even after enterprise customers have undergone a network transformation, it is still imperative for them to keep tabs on the market and assess what their network should cost. Particularly if their network contract includes a benchmarking clause.
With the latest update of our enterprise port pricing, we looked back at some previous hypothetical network scenarios to see how the cost of network ownership can change over time.
If you remember from our previous posts, to do this analysis we created a hypothetical network based on our median WAN Cost Benchmark customer, along with some input from our WAN Manager Survey (part of our Cloud and WAN Research) that queried IT infrastructure managers from around the world about their network configurations.
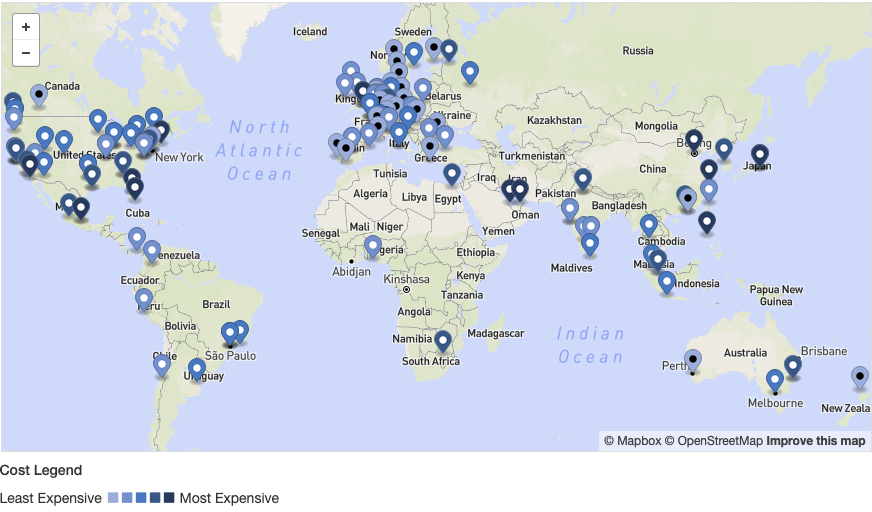
Our hypothetical network is 150 sites spread across Africa, Asia, Europe, Latin America, the Middle East, Oceania, and the US and Canada. We’ve also included seven data centre sites spanning Asia, Europe, and the US.
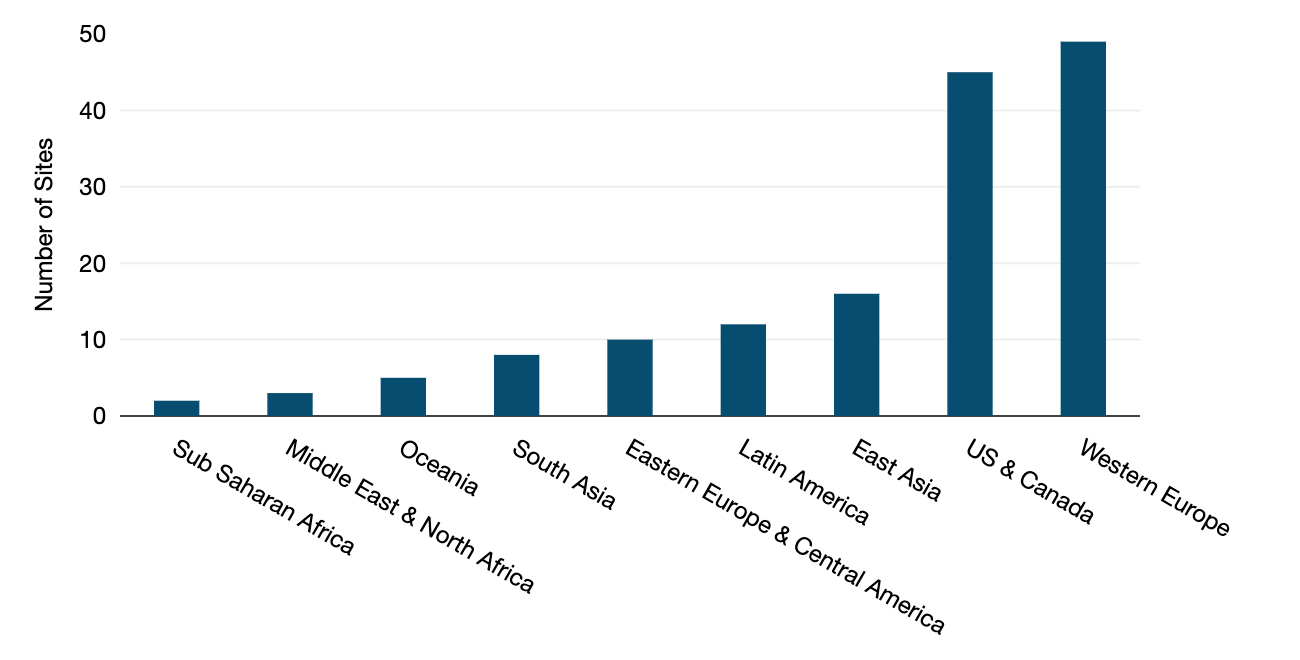
The map below provides a snapshot of our hypothetical network. The chart provides the number of sites in each subregion.
Our baseline dual MPLS network
Our starting hypothetical network represents an enterprise that is just starting its network transformation journey. This company is still running an all-MPLS network and has not yet adopted SD-WAN.
As such, our original 150-site network runs a dual MPLS WAN with a fully redundant access line and active MPLS backup at each site. The seven data centre sites are still on the MPLS network but with no backup. The starting network does not include an SD-WAN overlay.
We have set MPLS Class of Service (CoS) levels to 10% voice/video, 30% real-time data, and 60% best efforts, which is typical of our customers’ average sites.
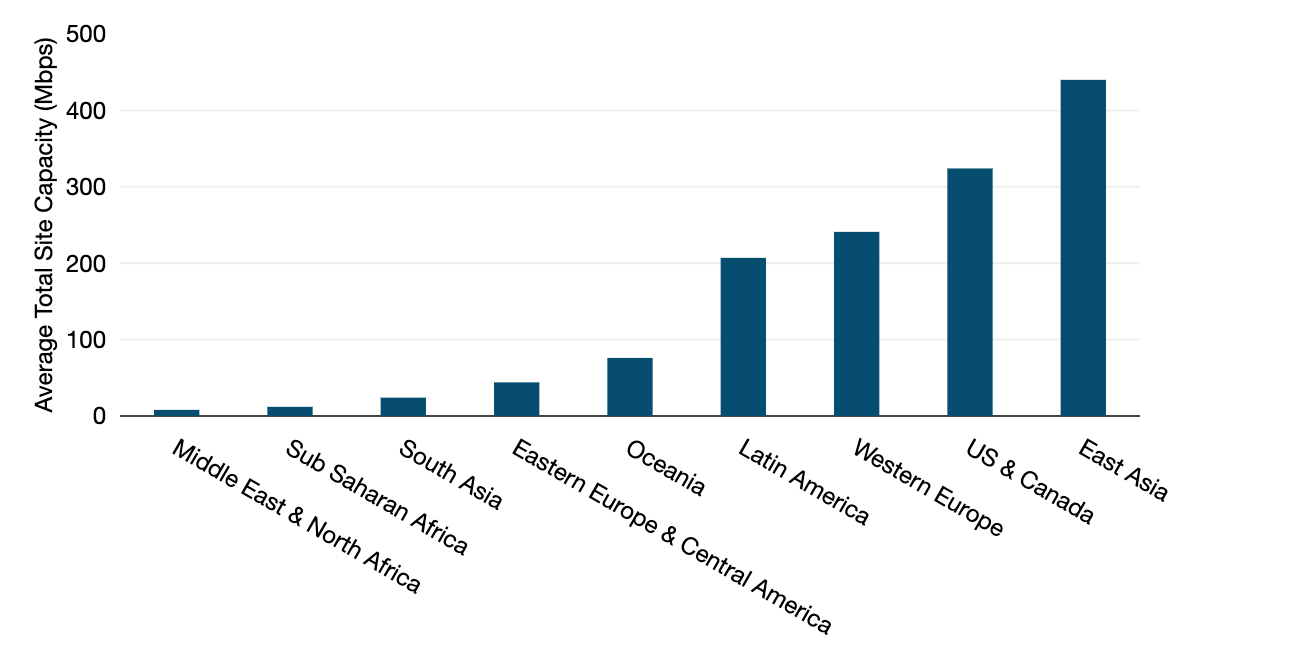
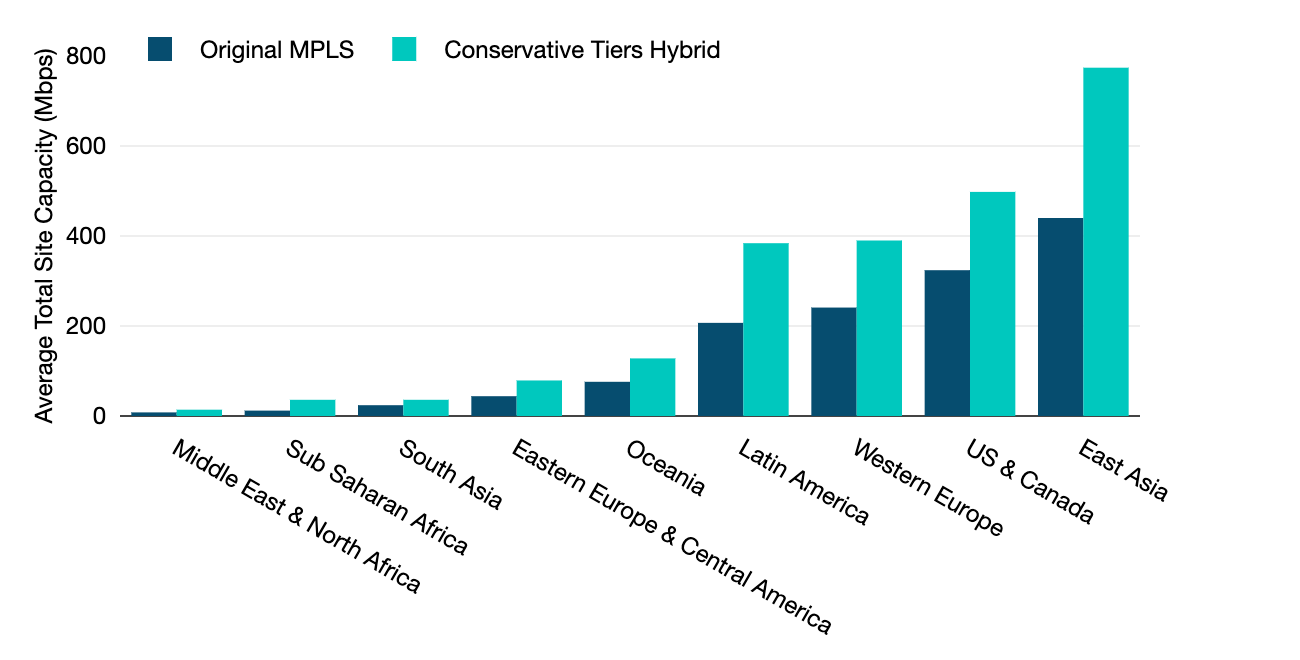
Figure 3 shows the average Mbps across all sites in each subregion. Globally, the average total site bandwidth in our original network is 246Mbps. The highest average capacities are found in East Asia, the US and Canada, and Western Europe, partly due to the presence of high-capacity data centre connections in those regions.
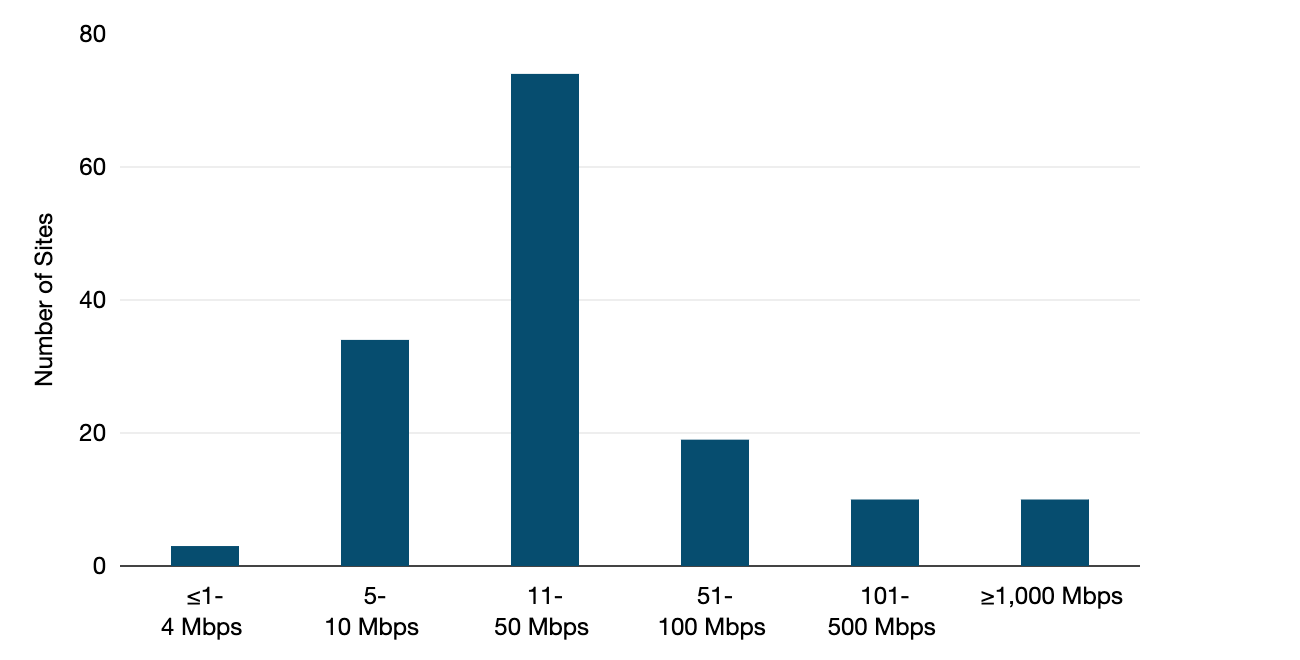
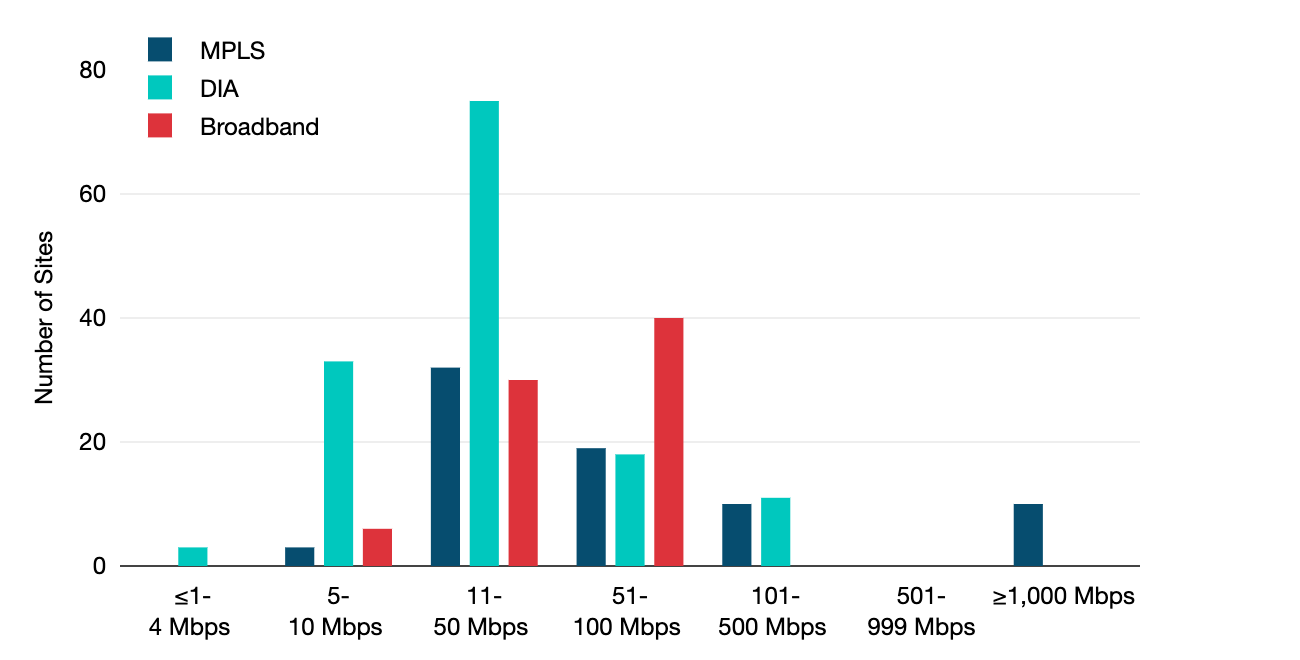
The most typical port/circuit speeds are in the 11 to 50Mbps bandwidth range, a common MPLS port size range according to our WAN Manager Survey and benchmarking customers.
The next largest is 5 to 10Mbps, followed by 51 to 100Mbps. There are a few small-capacity sites at 4Mbps or below in very expensive markets, and a few high-capacity sites at headquarters and data centre sites.
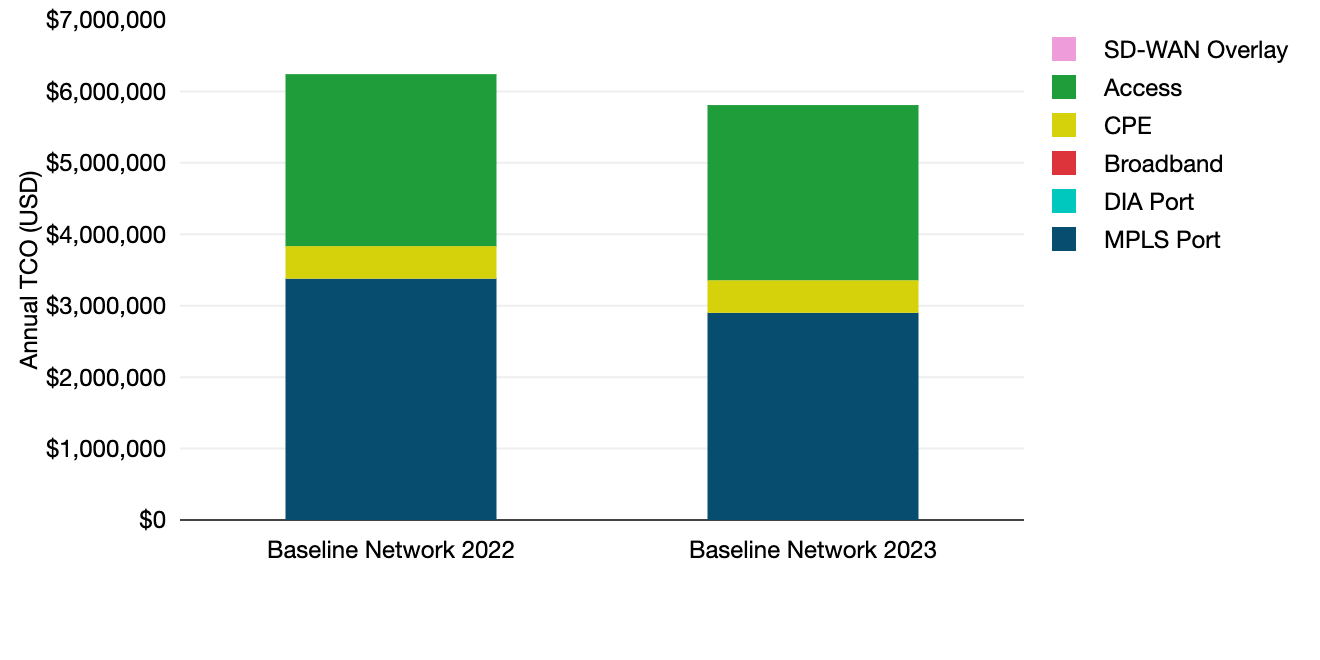
While the dominance of all-MPLS networks has waned, the service is still a critical component of the WAN. And providers are trying to make the service more competitively priced in an effort to retain customers.
We see this trend reflected in the changes to our original MPLS network over time.
Looking at the figure below, you can see that in 2023, the annual total cost of ownership (TCO) of our baseline MPLS network was USD 432,864 — 7% less than in 2022. The price of just the MPLS ports themselves decreased 14%.
Tiered sites approaches
Despite MPLS becoming more competitive, enterprise customers have moved on to hybrid networks that combine MPLS, DIA, and broadband with an SD-WAN overlay.
In 2022, our WAN Manager Survey found that for the first time, the prevalence of DIA (48%) and MPLS (51%) in the WAN had almost converged. And 86% of respondents had already or were in the process of adopting SD-WAN.
Our next two scenarios take an approach that we see many enterprises taking when moving to a hybrid network — designating network sites into categories or tiers and assigning different network services to each tier.
This allows companies to add in local Internet breakouts at most offices, but keep some MPLS at higher priority sites that need service level assurances.
Conservative tiers approach
Our first tiered scenario takes a conservative approach to integrating Internet services and SD-WAN into the WAN.
We made the following changes to our original network:
- Tier 1 sites. Our Tier 1 sites are those that are not ready to go all Internet; perhaps similar to your headquarter sites in key metro areas. These sites still have dual MPLS at the same bandwidth, but we’ve added a tertiary DIA link of moderate size to non-data centre sites.
- Tier 2 sites. Our biggest group, Tier 2 sites, are running a single MPLS port and DIA connection to replace the lost MPLS port. The DIA ports are at least the same size as the original MPLS circuit that was dropped for these medium sites.
- Tier 3 sites. Our Tier 3 sites are running DIA (generally the same size as our original MPLS ports) and a broadband connection of similar or larger size for smaller sites such as those you would see in retail or expensive geographies.
- China. We have often heard from both enterprises and vendors that Internet service in mainland China is extremely difficult and many customers opt to keep MPLS in China even when moving to the Internet in other markets. For this reason, we keep dual MPLS for Chinese sites in all scenarios.
- Added SD-WAN to all sites. For all of the following scenarios, we’ll use pricing for a managed SD-WAN service as opposed to an unmanaged SD-WAN overlay sourced directly from an SD-WAN vendor.
Figure 6 maps out the number of sites now running each of our three services.
The resulting network has a global average of 403Mbps available per site. That’s an increase of 64% over our original dual MPLS network.
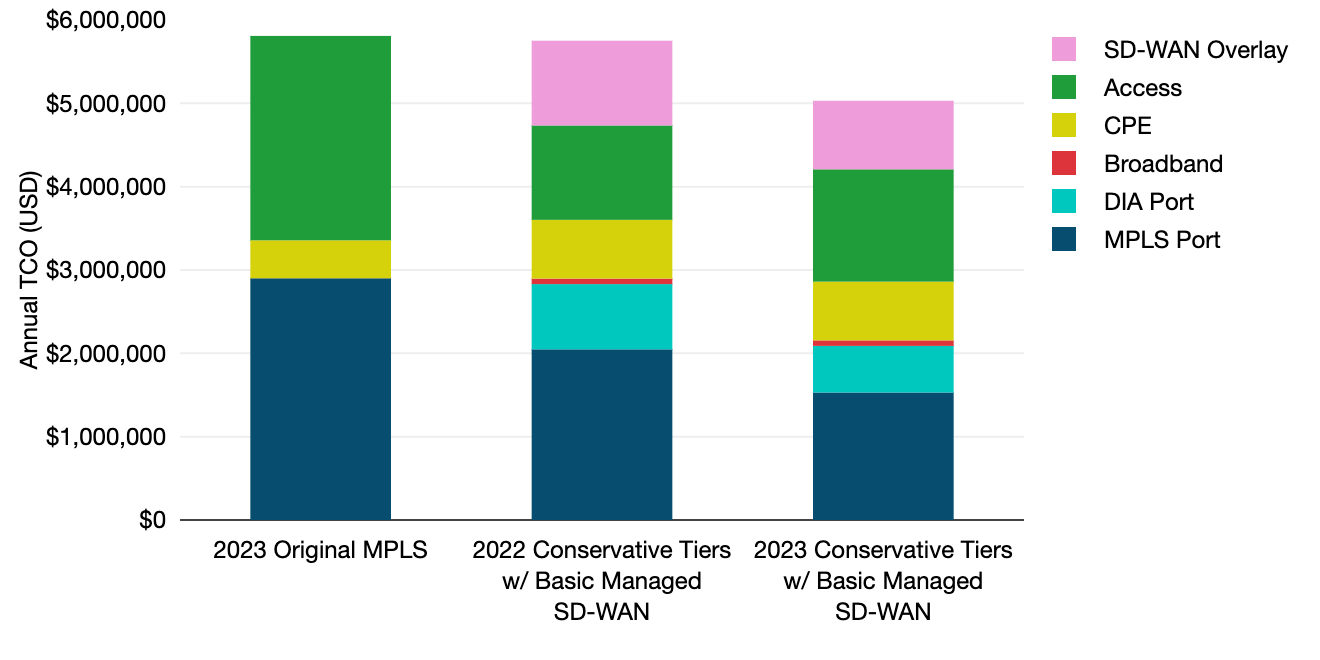
So what happened to the cost of our conservative tiered scenario over the past year?
Between 2022 and 2023, the annual TCO for this scenario decreased 13% to USD 5,030,990. The biggest changes were seen in the cost of the MPLS and DIA ports, which decreased 25% and 28%, respectively.
Part of the big MPLS decline was the removal of our MPLS backup ports at Tier 2 sites. That was followed closely by the cost of the SD-WAN overlay, which decreased 19% over the course of the year. The exception to this trend was the cost of local access, which actually increased 19%.
Compared to our baseline MPLS network, the conservative tiered network with basic managed SD-WAN represented a 13% reduction in annual TCO. That’s a slightly higher rate of savings than we saw in 2022 when it cost 8% less annually than the baseline MPLS network.
In Part 2 of this series, Rob Schult covers the regular tiered approach along with a second scenario, the remote hybrid network.
Brianna Boudreau is a Senior Research Manager with TeleGeography, specializing in pricing and market analysis for wholesale and enterprise network services with a regional focus on Asia and Oceania. Brianna has helped develop and launch several new lines of research, including TeleGeography’s Cloud and WAN Infrastructure service and the SD-WAN Research Service.
This post was originally published on TeleGeography’s blog.
The views expressed by the authors of this blog are their own and do not necessarily reflect the views of APNIC. Please note a Code of Conduct applies to this blog.