

In case you missed it, we at TeleGeography are looking back at some previous hypothetical network scenarios to see how the cost of network ownership can change over time.
In my colleague’s post, Senior Research Manager Brianna Boudreau explored the first tiered scenario, which takes a conservative approach to integrating Internet services and SD-WAN into the WAN. If you haven’t read it yet, I encourage you to start there. Brianna’s post also provides important context about our hypothetical network and baseline dual MPLS network.
For Part 2 of this analysis, I’ll map out a second, less conservative tiered approach, then switch gears to our remote hybrid network.
Let’s dive in.
Regular tiered approach
Some enterprises are ready to integrate a larger proportion of Internet services into the WAN.
In this scenario, we’ve made the following changes:
- Tier 1 sites. Tier 1 sites have a single MPLS port of the same size as our original network, plus a DIA port about 50% larger at large offices / headquarters (not data centre sites).
- Tier 2 sites. Tier 2 sites are running dual DIA ports about 50% larger than the original MPLS connections for the same markets.
- Tier 3 sites. Tier 3 sites have dual broadband connections of larger sizes than our original MPLS network.
- SD-WAN. Added managed SD-WAN to all sites.
Comparing the figure below to our conservative tiered approach, you can see the big jump in the amount of broadband connections, represented by the red columns, as well as Dedicated Internet Access (DIA), in the turquoise columns.
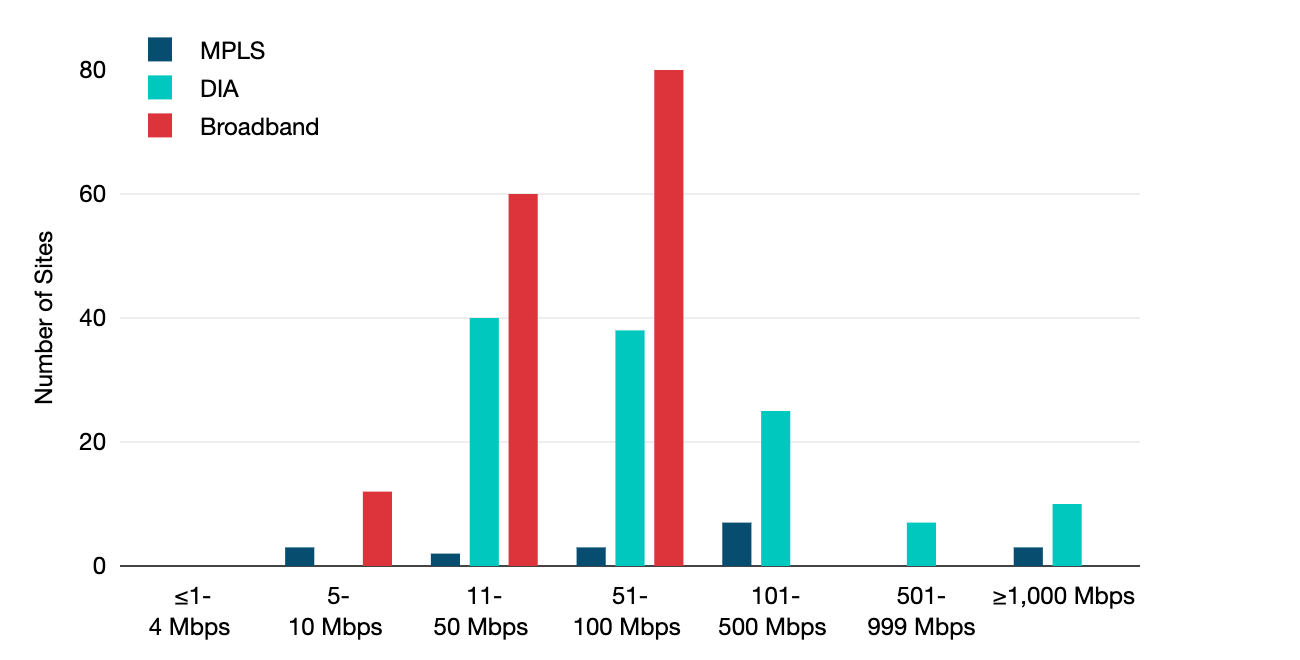
This tiered network has an average global site capacity of 435Mbps, compared to 246Mbps in our original dual MPLS network, or a 77% increase.
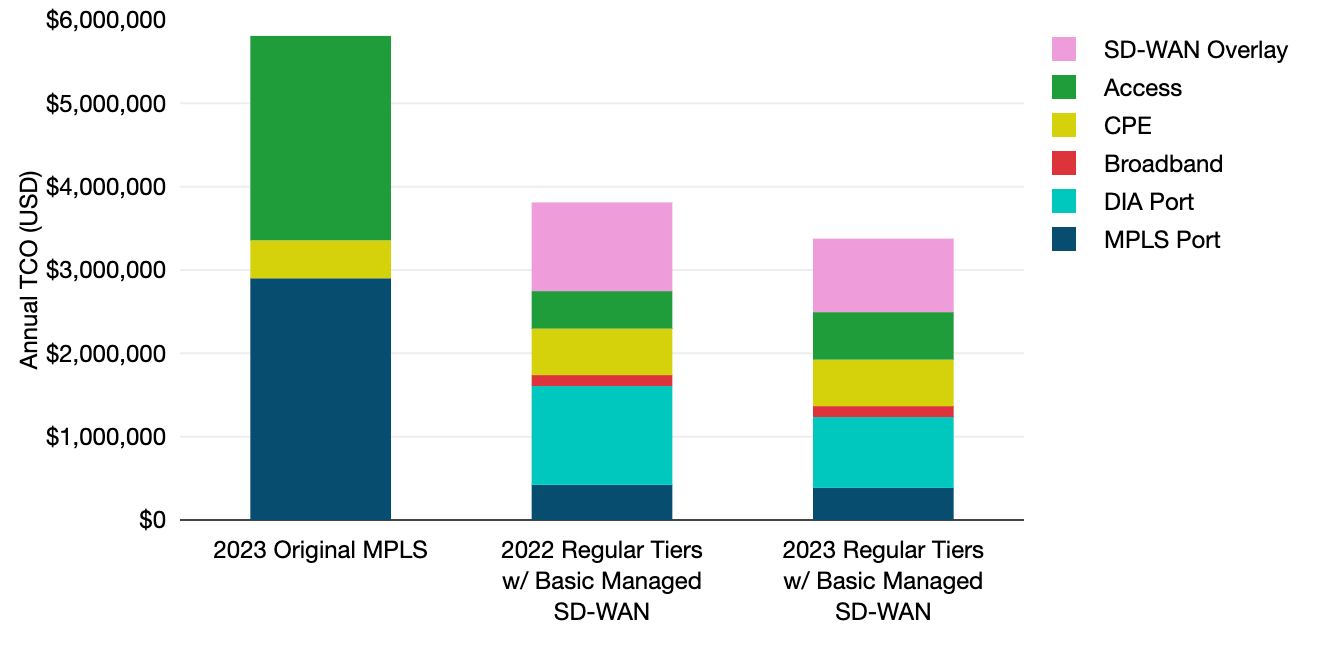
In 2023, the annual Total Cost of Ownership (TCO) of our regular tiered network was USD 3,376,665. That’s 11% less than our 2022 scenario.
Looking at Figure 3, you can see the biggest cost reduction was for DIA ports (the turquoise portions of our columns), which decreased by 28%. This was followed by SD-WAN costs, which fell 17%. MPLS decreased just 9% in this scenario. Access costs increased again, 27% in this scenario.
In 2022, the regular tiered approach cost 39% less than the TCO of the baseline MPLS network. In 2023, it was 42% less expensive.
Remote hybrid network
Many workers have now adopted a hybrid work schedule, returning to the office at least one day a week, but working from home other days.
When employees are in the office, they continue to use bandwidth-hungry applications like Zoom, Microsoft Teams, and Google Meet to stay connected.
As such, many enterprises are thinking of consolidating the number of sites they have, while increasing bandwidth in those that remain open, in an effort to save money.
To model this situation, our remote work scenario implements the following changes:
- Close some sites entirely (especially any redundant metro sites). This hypothetical network includes 126 sites, down 24 from the original 150.
- Decrease all MPLS significantly (that is, 50 to 75% reduction in bandwidth) and remove backup ports/lines. Only voice and video traffic will remain over MPLS at Tier 1 and Tier 2 sites.
- Add in DIA to all sites to match the original size at the remaining Tier 2 and Tier 3 sites.
- Increase data centre port sizes to accommodate people accessing the network remotely.
- Add in managed SD-WAN to all sites.
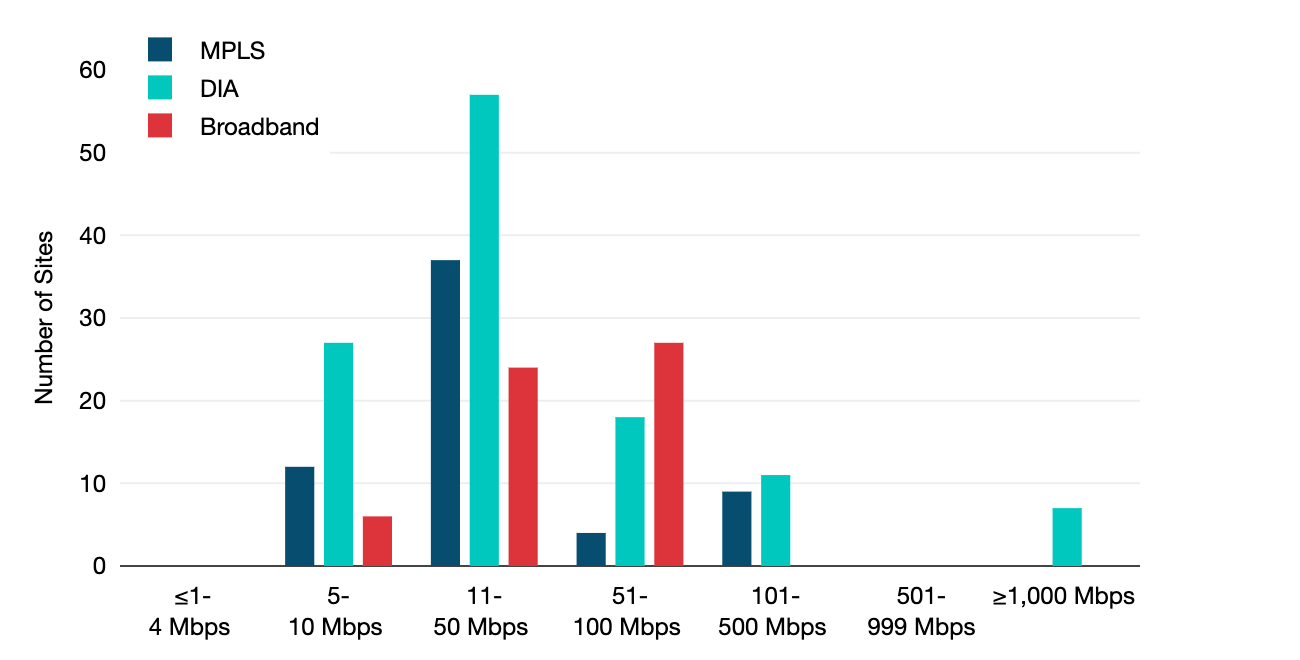
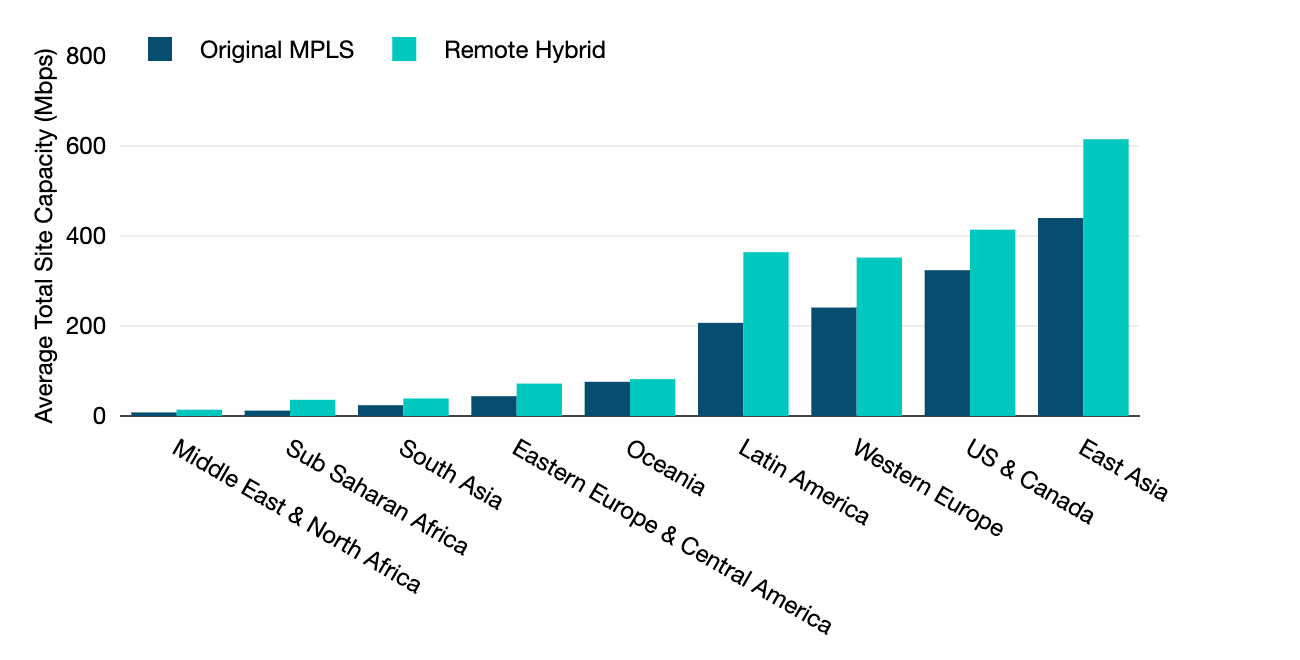
The resulting network has a global average capacity of 345Mbps at each site, a 40% increase over our original MPLS WAN.
Once again, most of our DIA sites fell in the 11 to 50Mbps range, while the largest number of broadband sites were in the 51 to 100Mbps range.
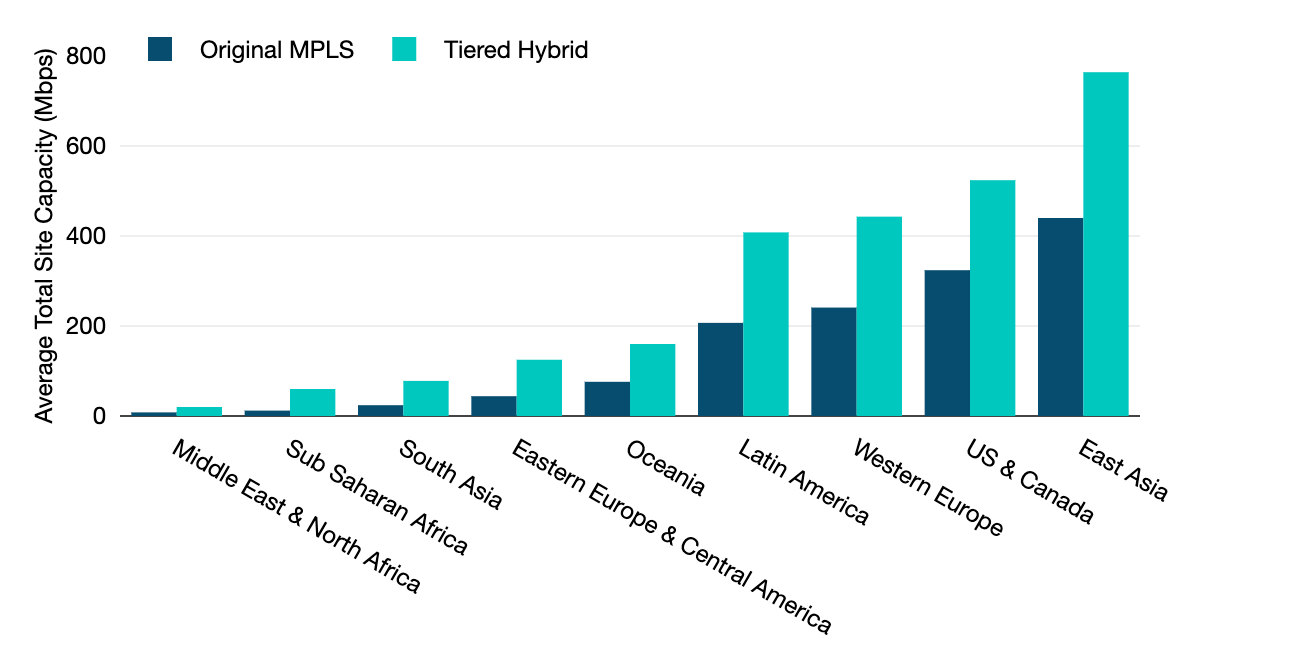
While site capacity increased across all of our subregions, it is notable in this scenario that Latin America saw an increase almost on par with Western Europe.
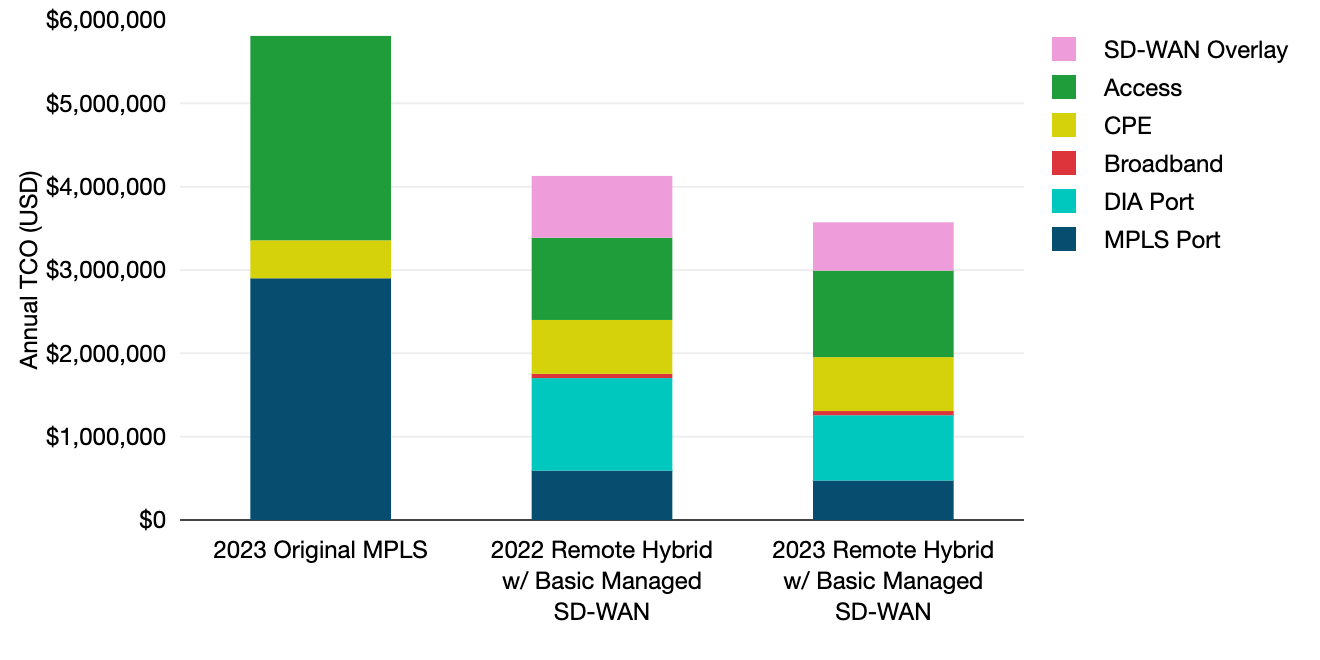
In 2023, the remote hybrid network cost USD 3,572,715, 13% less than in 2022. The cost of the DIA ports decreased the most (29%), followed by SD-WAN (22%), and MPLS (20%).
With DIA prices decreasing at such a rapid pace, the service is no longer the biggest contributor to the annual TCO. In 2023, local access costs (which increased 5%) became the biggest contributor to TCO.
The annual TCO of our remote hybrid network was 38% less than our baseline MPLS network.
The rise of cloud services, remote work, and SD-WAN has caused many enterprises to rethink their network architecture.
While it is critical for WAN managers to be able to map out how adopting different network services can impact their total cost of ownership, it is also important for them to track how prices for these services change over time.
With MPLS, DIA, and SD-WAN prices continuing to fall at a steady pace, keeping track of changes in the market can help enterprises determine what pieces of the WAN to focus on to further optimize their network costs.
This is particularly the case when prices fall at different rates for different underlay products, as we have generally seen in this analysis.
Many enterprises may benefit from updating underlay strategies as the multiples between products fluctuate over time.
Rob Schult is a Research Director at TeleGeography, managing the company’s wholesale pricing and enterprise network research groups. His areas of expertise include telecom service pricing, corporate WAN technologies, and Cloud service integration.
This post was originally published on TeleGeography’s blog.
The views expressed by the authors of this blog are their own and do not necessarily reflect the views of APNIC. Please note a Code of Conduct applies to this blog.