

With today’s information security teams under constant pressure to secure their networks, active defence tools have become an important part of their arsenal. Deception tools such as network honeypots can provide important information and alerts from the pre-attack stage through to post-intrusion depending on how they are deployed, as well as buying time for the defence by slowing down the attackers who think they may have compromised real systems. Depending on the level of interaction provided by the honeypot, this could not only increase the difficulty barrier for the attacker but provide defenders with a first look at the attacker’s tactics and techniques.
In our recent research paper, we at the University of Texas at Austin, Texas, USA, study the deployment of medium-interaction honeypots, which provide some interaction with an attacker through a virtual environment and scripted responses to commands, while also having lower maintenance costs than completely dedicated honeypot machines.
We investigated how these honeypots can be used to effectively measure the threat landscape and draw insights into attacker sophistication. We also go on to show that standard clustering algorithms can be used to understand the structure of the data gathered in a coherent way, helping to identify malicious botnets and organizations.
Measuring the Internet threat landscape
We ran multiple honeypots on five different protocols (SSH, HTTP, RDP, PSQL, and PJL), with each on its own Amazon Web Services (AWS) instance, and also set up SSH honeypots in three different AWS regions (Northeast USA, London, and Singapore). These honeypots were active for 22 months (April 2019 – January 2021).
During that time, we saw over 100,000 unique IP addresses connecting to our honeypots and creating close to 7M sessions. We focused on extracting insights on attacker behaviour in a longitudinal study, to determine how sophisticated our attackers are, and how well medium-interaction works. To summarize some of our conclusions from the measurement results, we found that:
- A smaller fraction of IPs was responsible for most of the sessions, as noisy scanners created a large number of repeated connection attempts.
- The distribution of attackers (Table 1) across services was sparse, that is, most attackers tended to focus on a single service.
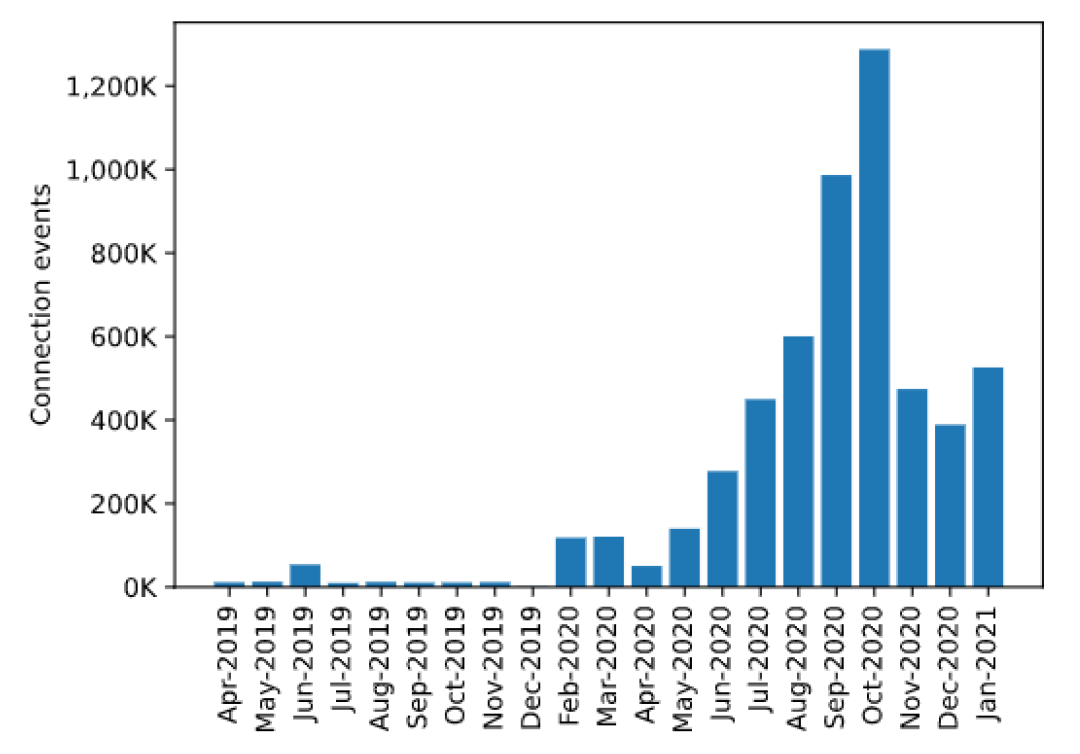
- A large increase in connection events (Figure 1) in the latter half of 2020 showed the effects of increased attacks due to remote work during the COVID-19 pandemic.
- A small number of attackers tried to check for deception before attempting to break into the machine.
- Allowing execution of commands in the honeypot environment provides invaluable information to discern the intent of the attackers.
- Medium-interaction honeypots worked well to frustrate human attackers who tried to install software and add users to the machines.
| Protocol connected | Unique IPs |
| SSH only | 56.10% |
| HTTP only | 34.28% |
| RDP only | 8.03% |
| PSQL only | 0.48% |
| SSH + HTTP | 0.48% |
| SSH + PSQL | 0.19% |
| PJL only | 0.13% |
| SSH + PSQL + HTTP | 0.13% |
| RDP + PJL | 0.13% |
| HTTP + PSQL | 0.06% |
Clustering attackers
Using insights from our measurement and attacker activity logs on our SSH honeypots, we developed a novel clustering approach to group our attacking IPs. Since these honeypots were on AWS instances with randomized IPs, most of the attacks we saw were automated scanners attempting to brute force their way into our honeypot. For the majority of our measurement period, we let an attacker succeed randomly after a few tries, and logged the credentials they attempted. While we did not do a complete packet capture, we recorded all connection attempts and session activity once they logged in.
Thus, we were able to extract a few features for each IP:
- The set of credentials attempted.
- Any outbound requests attempted (web/mail proxy, tunnel, DDoS).
- The time interval between connection probes.
- Command activity once a successful session is created.
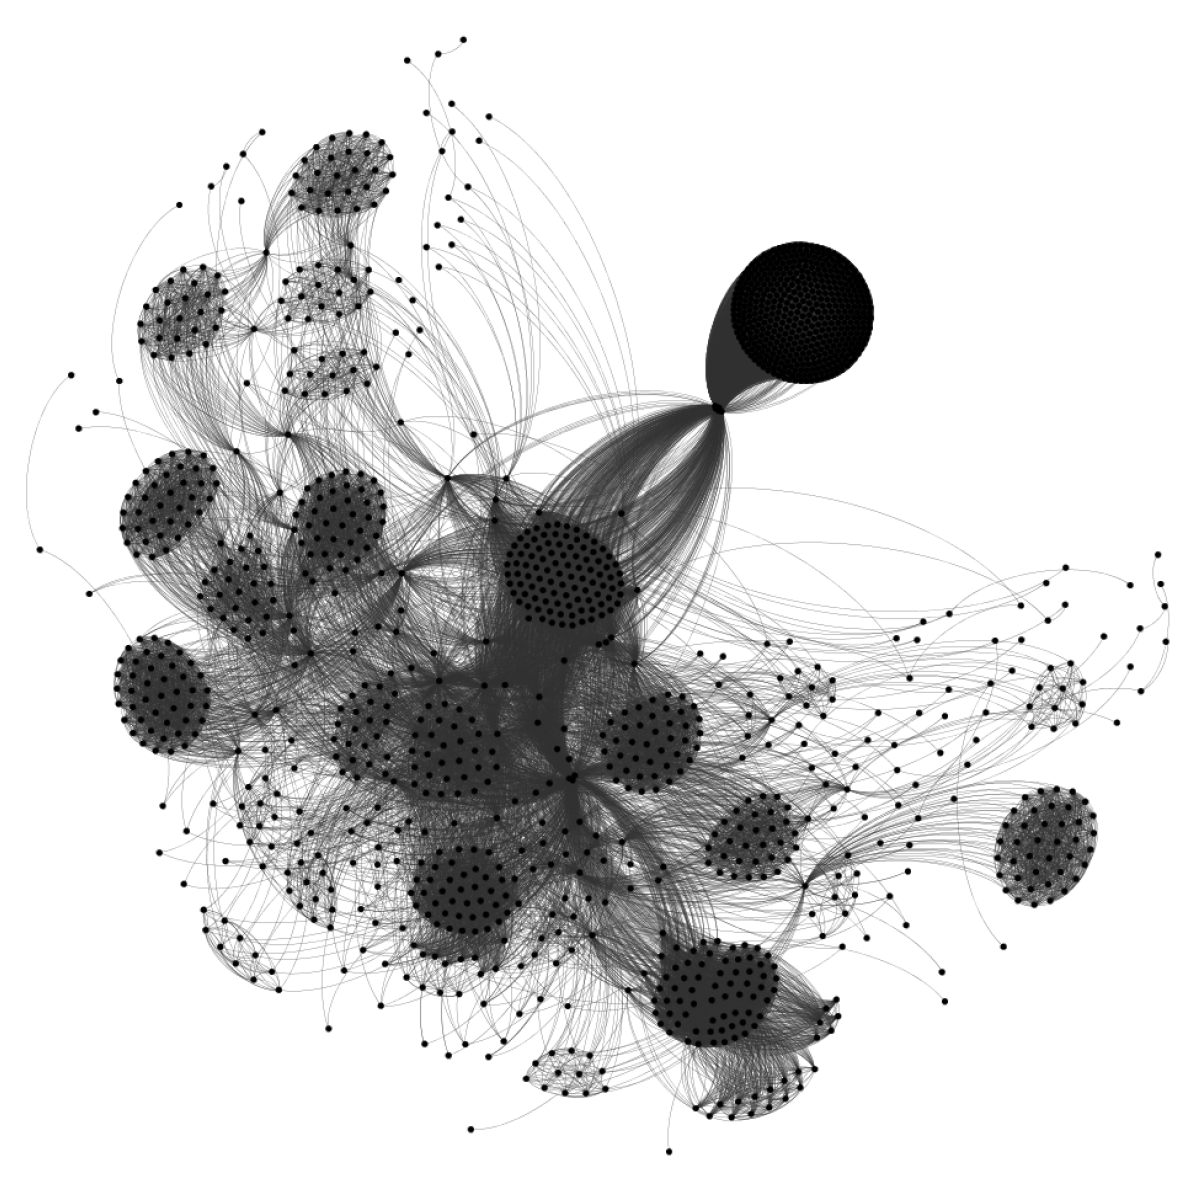
Using these features, we first created various data representations for each feature to cluster our IPs. For example, we constructed graphs where nodes (IPs) are connected if they match on a certain feature (such as outbound requests to the same domain), time series of activity from each IP to match on probe intervals, and a set of mappings from commands to malicious capabilities to match IPs that have similar session activity.
Once we’ve clustered IPs for each feature, we combine all the groups using an algorithm called consensus clustering. This algorithm reduces the noise and inaccuracies from clustering on the individual features and allows each piece to build towards a final clustering result.
Result snapshot
From the IPs that survived our clustering process, we formed 48 final groupings of IPs. Most of these groups matched on multiple features (for example, credentials attempted, commands executed, probe interval), which gives us confidence in our result.
We found groups matching on various subsets of the individual features, with the most common being on the credential list and outbound request. This makes sense as automated bots that are part of the same group are likely scripted with the same credential list and final target. However, we also found clusters of IPs that tried different credential sets but executed the same script upon login, as well as clusters with the same script, but different outbound requests, which could be useful knowledge for security teams during forensics. We found a group of IPs attacking honeypots in particular, a distributed botnet attempting the same scripted attack, as well as a malicious organization with a professional web presence advertising an SEO business but using bots under the hood.
We’ve shown with our work that using interactive honeypots, even against automated bots, can prove useful to understand who is attacking a network. Our research is intended to be extensible to work against more sophisticated attackers, various networks and protocols, as well as different features extracted from other honeypots. We foresee our technique as one that can flag groups of attacking IPs, determine their points of similarity and difference, and feed that information to security teams that can take appropriate further action.
For more details on our work, please take a look at our paper ‘Measuring and Clustering Network Attackers using Medium-Interaction Honeypots‘ in the proceedings of the Workshop on Traffic Measurements for Cybersecurity at the European Symposium on Security and Privacy (Euro S&P) 2022.
Zain Shamsi is a researcher at Applied Research Laboratories, at the University of Texas at Austin. His research involves applying machine learning to solve network measurement and cybersecurity problems.
The views expressed by the authors of this blog are their own and do not necessarily reflect the views of APNIC. Please note a Code of Conduct applies to this blog.