

In 2020, at Mobicom Corporation LLC (a Mongolian telecommunications company), we needed to monitor the optical signal level for our Cisco 40G interfaces. We attempted to use Simple Network Management Protocol (SNMP) on various monitoring systems, such as Solarwinds, LibreNMS, SNMP Walker, and others. However, after trying multiple methods we were unable to get the desired outcome, as these systems did not have the SNMP Object Identifier (OID) to monitor the optical signal level for the 40G interfaces.
Figure 1 shows the command line and LibreNMS results for 40G and 100G interfaces. You can see the differences between these interfaces, where I can monitor the signal level for 100G interfaces but not for 40G interfaces.

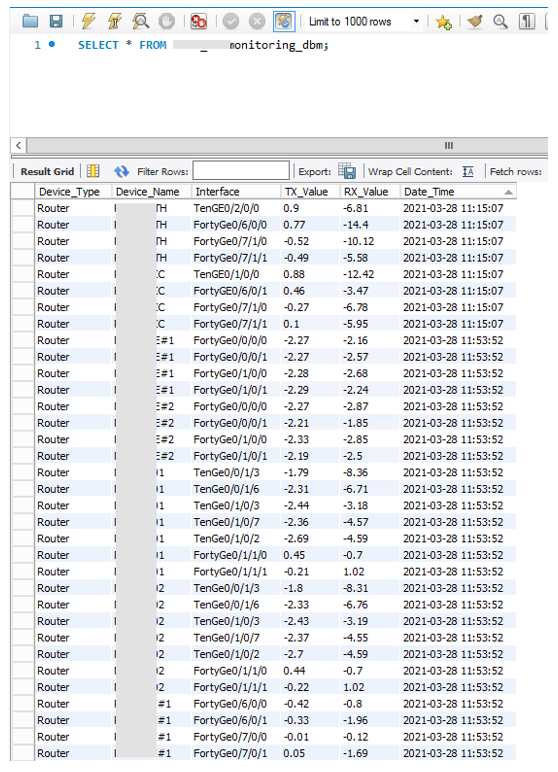
After several unsuccessful attempts, I tried using Python’s Netmiko module to obtain optical signal level results for 40G interfaces, store them in a database, and display them in Grafana (Figure 2).
This marked a turning point for me. Seeing the results of commands from network devices in Grafana gave me a strong interest in network automation. Next, I developed a local web page using Netmiko and PHP to make configuration changes on the network devices. This was a fascinating experience for me.
Following this exercise, I travelled to Manila to participate in APRICOT 2023 where I participated in the Network Automation for Network Engineers Workshop. The workshop provided me with a wealth of new experience and knowledge.
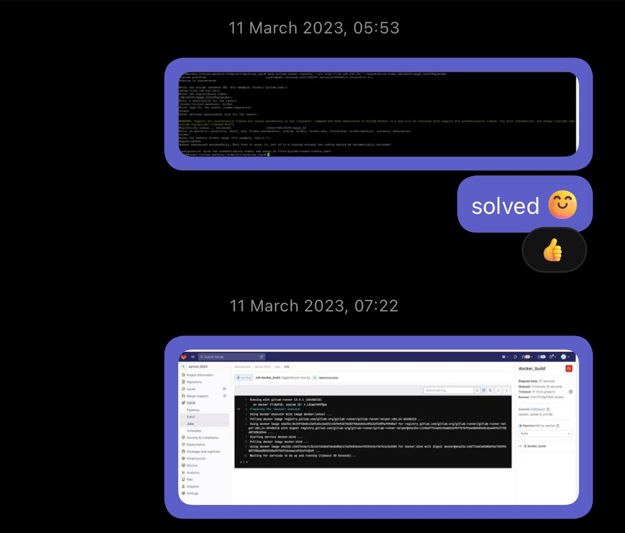
Although the systems seemed challenging during the training, I set myself the goal to implement them in our network upon my return to Mongolia. Immediately after returning I installed and tested the Docker and Gitlab servers that were used during the workshop. I spent a substantial amount of time integrating these systems and preparing them for use. Despite the challenges, I was determined to succeed.
I remember working through the night until at 5:53 in the morning, I finally managed to register GitLab Runner in the CI/CD pipeline of GitLab. I felt a great sense of accomplishment as I built the CI/CD pipeline container and finally went to sleep.
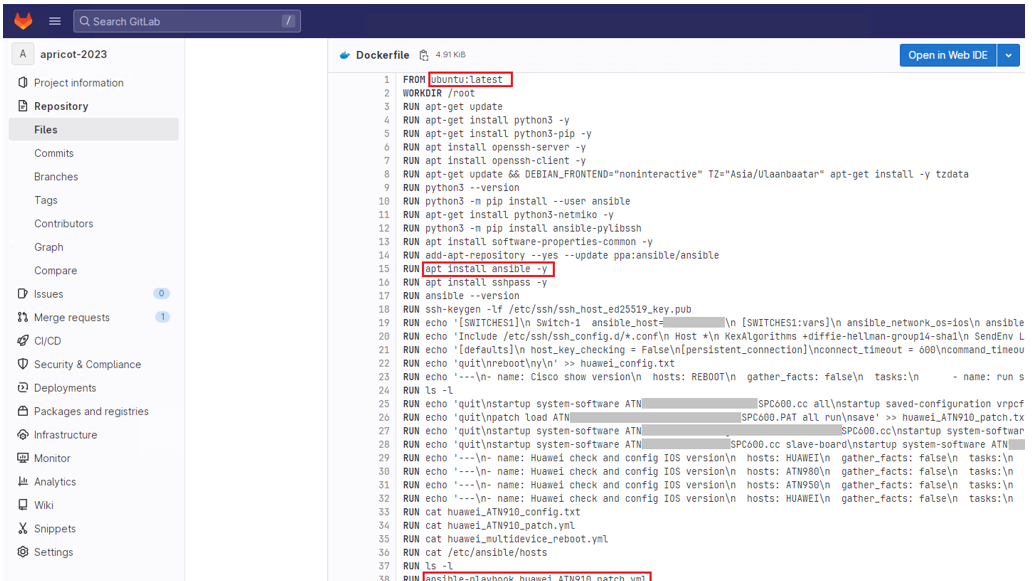
During my exploration of Ubuntu OS, I integrated it into my GitLab CI/CD pipeline container. Inside the container, I set up Python and Ansible automation tools. Following some configuration adjustments, I successfully applied configuration changes to our network devices (Figure 4).
Automating iOS upgrade
Around the same time, one of our vendors recommended upgrading the iOS version of our devices. However, the iOS upgrade work was labour-intensive and time-consuming. So, my senior engineer Ulsbold assigned me the task of automating the process using network automation tools. Given that I had just implemented a system that could do this job, I took on this challenge and set another goal to resolve it.
To prepare for this project, I created a detailed plan. With over 250 devices from this vendor in our network, initial estimates projected a manual upgrade timeframe of 50 days. This calculation assumed an engineer upgraded a maximum of five devices per night, resulting in a total duration of 250/5 = 50 days.
However, we would successfully use network automation to upgrade 20 iOS devices each night, completing the entire upgrade in just 14 days. Here’s how we did it.

This process consists of three steps.
Pretest
Step 1 is the pretest, which saves results before the router reboots. In this step, Python script commands are sent to the router to check the interface, router performance, BGP, ISIS, and the status of MPLS L2VPN, and L3VPN. The results are then returned from the router and stored in the MySQL database. Corresponding MySQL tables are created to store the results of each command.
We named the MySQL table ‘command + before’. The pretest results, stored in the MySQL tables, are displayed on the left side of the Grafana dashboard. The pretest results for the 20 routers planned to be upgraded that night are all saved.
Upgrade
In Step 2, we upgraded the operating system on the routers. This involved developing two types of network automation servers connecting to our monitoring network — a Docker server and a GitLab server.
A Docker inside Docker (dind) and a GitLab-runner application were installed as containers on our Docker server. GitLab-runner was registered in the CI/CD pipeline on our GitLab server. The CI/CD pipeline built its container on dind. This container works with the Ubuntu OS, where the Ansible automation tool was installed. Router configurations could be changed using the Ansible automation tool.
Using Ansible we performed these tasks:
- Make a backup at 20:00.
- Change the system boot to the new version at 22:00.
- Reboot the routers at 01:00
To run these Ansible jobs automatically from the CI/CD pipeline, we used a Linux shell and Cron job, which pushes codes into the GitLab file repository.
Post-test
Step 3 involves the post-test phase. After the router has been rebooted with the new operating system, the same commands used in Step 1 are sent to the devices.
The results are then saved to a MySQL database. MySQL table is named ‘command + after’ corresponding to each command created. You can review the corresponding MySQL tables on the right side of the Grafana dashboard and compare them to the previous results.
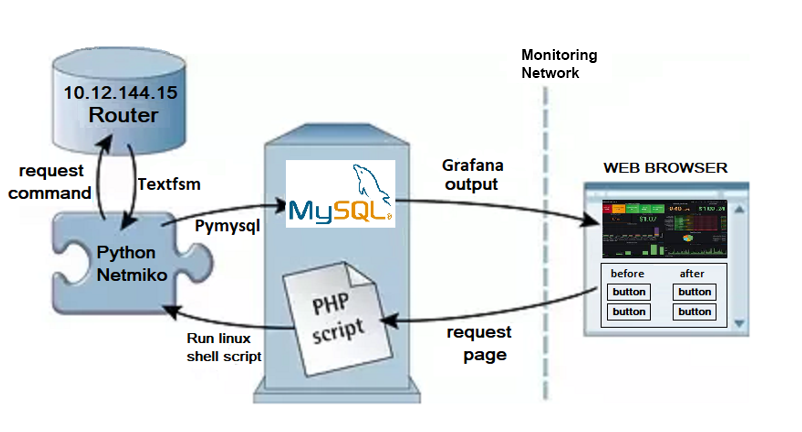
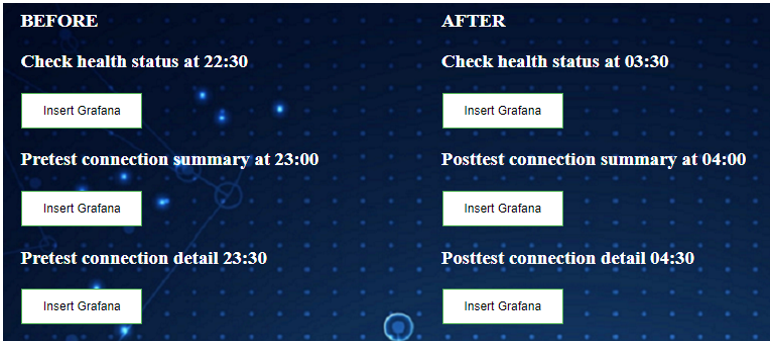
We ran pretest and post-test Python codes shown in Figure 6. When the web button is clicked, PHP launches a Linux shell. The shell then executes Python code, sends commands to routers, converts the command result to JSON, and inserts them into the MySQL database.
The data shown on the Grafana dashboard comes directly from the MySQL database. While we could have automated the execution of the Python code without manual intervention, we decided that it was preferable for the Network Operations Centre (NOC) engineers, who handle this task during night hours, to have more direct control over their work. Therefore, we implemented a button on the local web interface that, when clicked, triggers the execution of a Python job locally, as shown in Figure 7.
Router connection and interface details
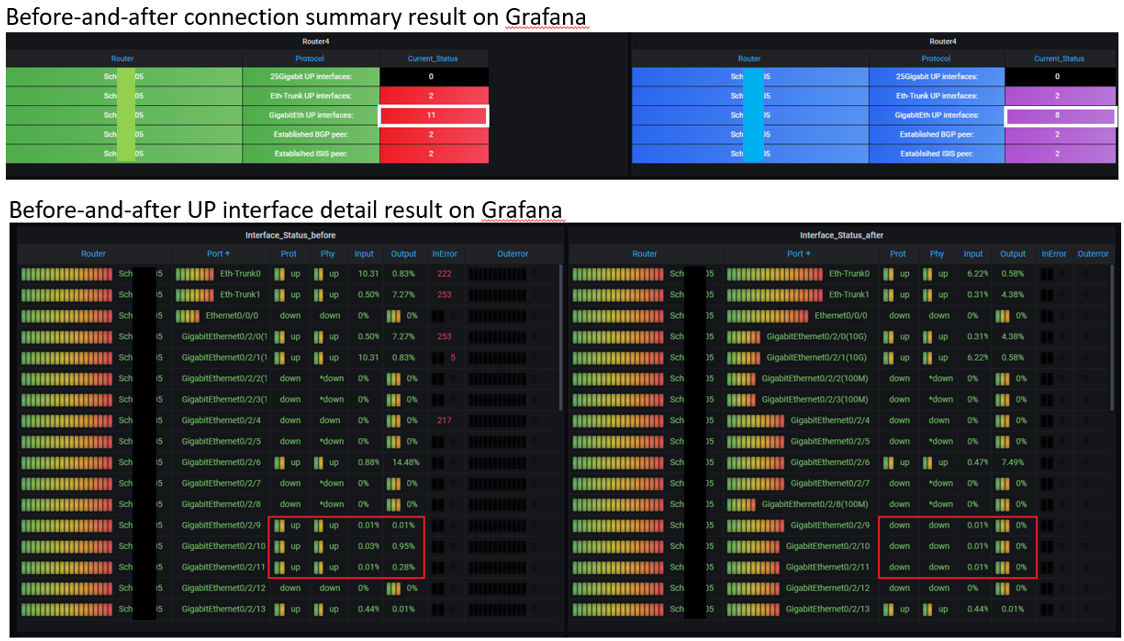
The connection summary provides information on:
- How many Gigabit interfaces are up.
- How many Eth-Trunk interfaces are up.
- How many BGP and ISIS sessions are established on the router.
Before restarting the router, all 11 Gigabit interfaces were operational. However, upon rebooting, only eight Gigabit interfaces were functioning. To identify the three interfaces that were down, we examined the interface’s detail section. Before the reboot, Gigabit interfaces 9, 10, and 11 were up, but after the reboot, they went offline. This analysis (Figure 8) allowed us to pinpoint the issue.
Issue and solution
We did encounter an issue during the operating system upgrade of our local router, as shown in Figure 9. Following the upgrade and device reboot, the NOC engineers inspected all services on the local router and found everything functioning properly and considered the upgrade successful.
However, the following morning, we received a complaint from a customer stating they were unable to access the branch from head office. Upon investigation, while services on the local router appeared normal, it was discovered that the L2VPN tunnel on the remote router was down.
This incident highlighted the need to not rely only on local router service checks as a measure of the upgrade’s success. To fix this, we improved our process by examining the L2VPN status on the remote router and refining our Python code accordingly.

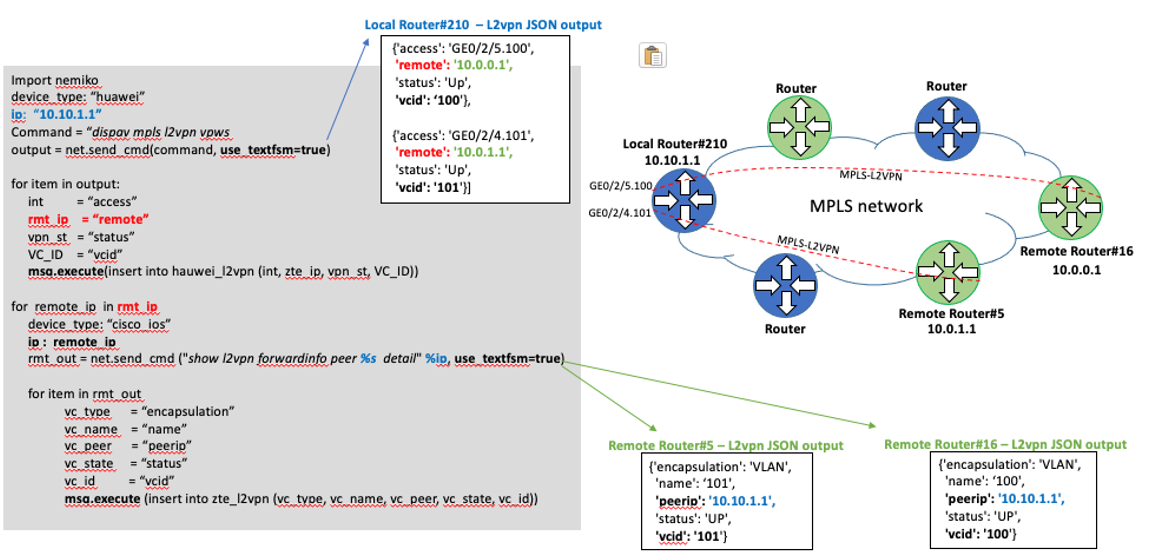
Figure 10 displays the Python code used to assess the L2VPN tunnel status on both the local and remote routers. First, we examined the L2VPN tunnel status on the local router, and the result was recorded in the MySQL database. This examination revealed that our local router had established two L2VPN tunnels, along with the IP address of the remote router.
Next, we accessed the remote router to verify if the L2VPN tunnel had indeed been established by our local router. The findings from this verification process were also stored in the MySQL database.
Having the ability to check the status of the L2VPN tunnel on the local and remote routers solved the problem.
Moving forward
After using network automation tools for this initial task, we expanded its usage to tackle a variety of other tasks. We used the tools to transfer all MPLS Multiprotocol BGP configurations from core routers to aggregation routers, and to automate pretest and post-test procedures on devices from various vendors, including Cisco, Mikrotik, Huawei, and ZTE, using Python and Textfsm. We are currently researching Salt automation systems.
Overall, these automation processes helped streamline network management and improve efficiency. As the results show, it also enhances testing accuracy and problem-solving and reduces the time required for validation across different network environments.
I can highly recommend APNIC Academy training as a starting point to learn about network automation.
Batmagnai Erdene is a Network Engineer in the Network Operation and Maintenance Division for Mobicom Corporation. He works on MPLS, IP transit, and the ISP core network.
The views expressed by the authors of this blog are their own and do not necessarily reflect the views of APNIC. Please note a Code of Conduct applies to this blog.
Nice