

Anycast can make it very simple to connect to a globally distributed service. However, the catchments for the service are determined by BGP policies, which are not necessarily (or frequently) based on performance metrics such as latency and load. As a result, it can be extremely challenging to predict the catchment precisely for a specific anycast deployment (configuration), let alone optimize the performance.
This problem has attracted significant research over the years, focusing on catchments, performance, and deployments of anycast sites, often using passively collected service logs and/or proactive measurements. A key challenge is that it’s difficult to optimize performance using anycast due to the complex nature of BGP relationships that dictate selected paths between clients and anycast sites. Simply adding more anycast sites can, counterintuitively, make performance worse.
In this post, I will explain how my colleagues and I at Akamai Technologies, Emerald Innovations, Duke University, Northeastern University, University of Virginia, and Vrije Universiteit Amsterdam recently demonstrated how to significantly improve average return-trip times (RTTs) between clients and anycast servers, which can improve the responsiveness and throughput of anycast services. The following post is a summary of our findings published at SIGCOMM 2021.
- AnyOpt is a measurement and optimization system that accurately predicts anycast configuration RTTs and finds the optimal set of anycast sites to minimize average RTTs.
- AnyOpt performs better than the alternatives when it comes to providing low-latency paths — reducing median latency by 43.4%.
- The order of anycast announcements from different anycast sites can significantly influence resulting catchments. Thus, when deploying anycast optimization, you must carefully control announcement timing.
Why is anycast (often) slow?
IP anycast is a routing mechanism that allows service providers to map clients to one of their many replicated sites worldwide. This is particularly useful for managing critical Internet services including, DNS root name servers, Content Distribution Networks (CDNs), and DDoS mitigation services.
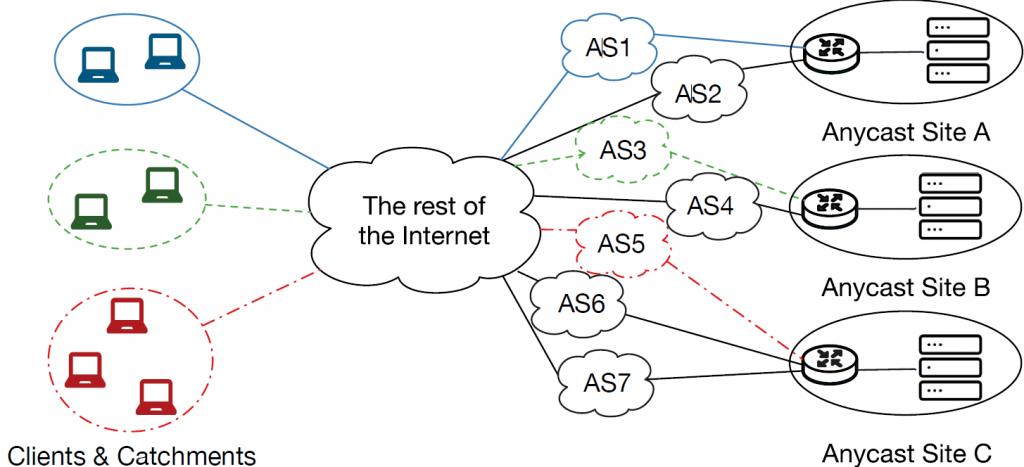
By using IP anycast, service providers can announce the same IP prefix from multiple different locations (anycast sites). For example, in Figure 1, there are three anycast sites. Typically, each site has a border router and servers that receive client traffic. Suppose that the border routers at each site all announce the same IP prefix. Based on Border Gateway Protocol (BGP) routing policies of routers across the Internet, different clients’ traffic destined to the anycast prefix may reach different sites. We refer to the set of clients that reach a site as the site’s catchment.
Ideally, each client would be mapped to the anycast site that offers the lowest latency. For example, consider an anycast service at three sites: Chicago, London, and Singapore.
Using data from measurements from a large CDN to its client networks, we determined the latency between each site and each client network to understand optimal and actual anycast latencies for catchments. Figure 2 shows a Cumulative Distribution Function (CDF) of the RTT latencies in this scenario.
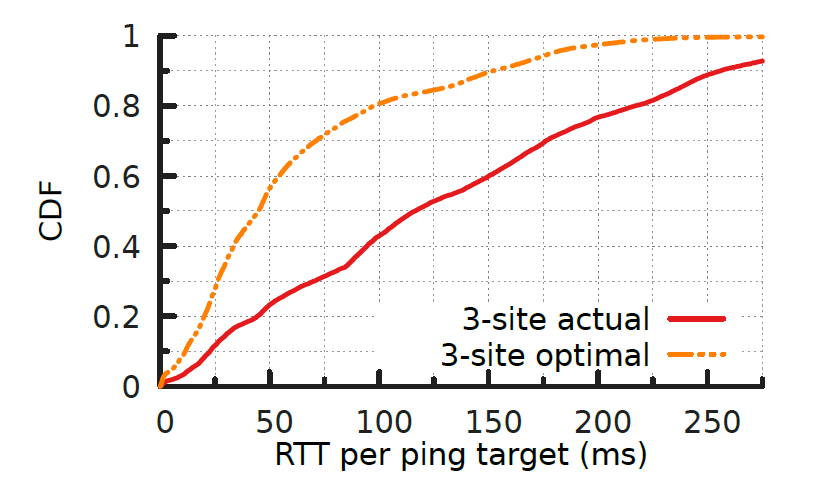
The orange line shows an ideal deployment: The latency between each client and its lowest-latency site. If these catchments could be achieved, the average client RTT to their catchment sites will be only 62 ms.
The red line shows the actual RTT for a default deployment where every anycast site announces to all of its neighbours. There is a substantial increase in latencies (a median of 133 ms, which is more than twice that of the optimal case), as BGP routing selects paths that often do not map clients to their closest sites. For example, we found that many clients in the Americas and Europe are sent to the anycast site in Singapore.
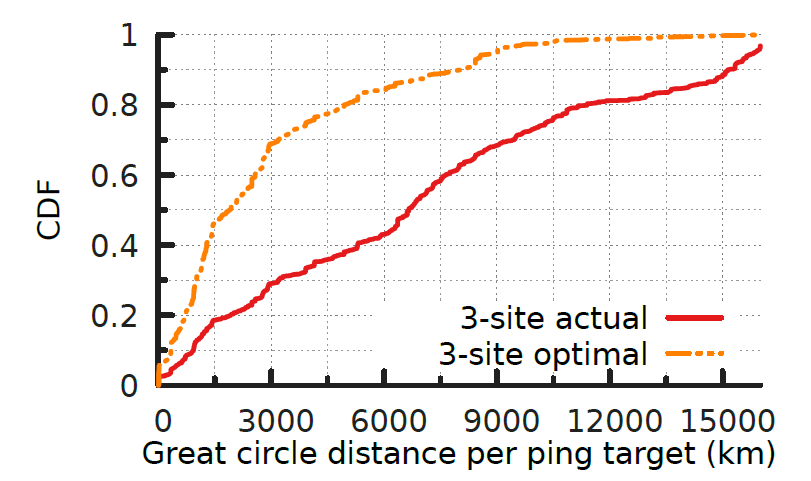
One explanation for this increase in latency is based on (geographic) path inflation. Figure 3 shows a CDF of the geographic distance from each client to the anycast sites, where the average distances to clients based on a real deployment (red) is, on average, thousands of kilometres worse than the optimal case (orange).
Towards practical anycast optimization: AnyOpt
To deploy an anycast-based service, a service provider must choose anycast sites to announce the anycast prefix. A key challenge here is that mappings between client networks and anycast sites are determined by BGP’s policy-based routing decisions rather than service providers’ goals such as minimizing latency and balancing the load.
Several measurement studies have revealed that some anycast catchments exhibit unexpectedly inflated latency, and increasing the number of anycast sites in a deployment counter-intuitively increases the average latency for clients.
The question we sought to answer in this work was when given a set of potential anycast sites, how do we choose a subset among them to minimize the average client latency. To do that, we need to first be able to predict the catchment and estimate the latency.
In our work, we took a three-stage approach:
- Measure a client’s preferences between each pair of anycast sites.
- Model a client’s route selection behaviour as a linear preference order with the pairwise comparison results.
- Solve an (offline) optimization problem to find a set of announcements that minimize latency.
Our testbed
To evaluate the existence of linear order, we built a moderate-scale testbed. Figure 4 shows the footprint of our testbed.
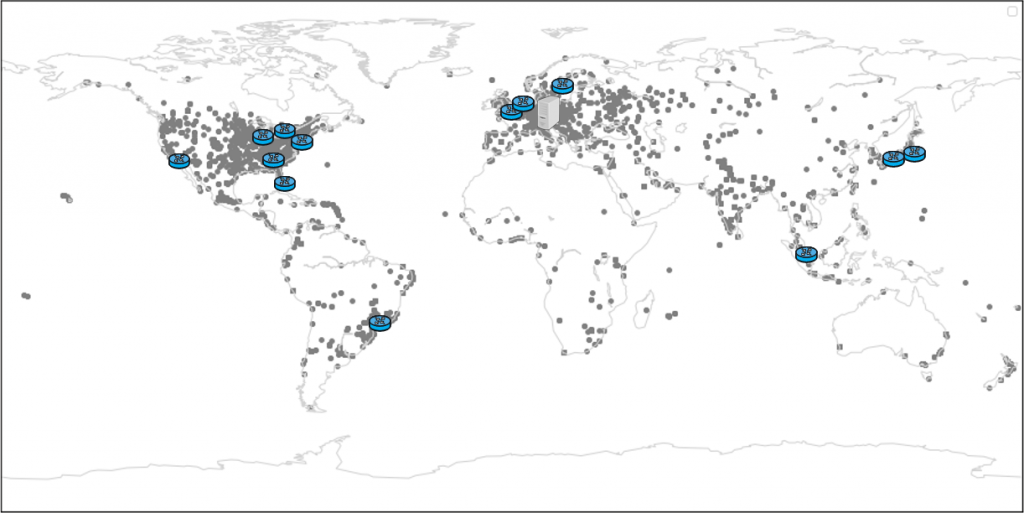
We have 15 anycast sites around the world considering both traffic concentration and also geographical coverage.
Each site has one transit provider and several peering links. We also deployed an orchestrator (server) in Europe to control the anycast configuration and measure the preference order and RTT of client networks. The server establishes a tunnel with each site, peers with those sites, and issues network-measurement probes through the tunnels.
We also use a ping target set that contains more than 15,300 different router IP addresses. This set covers paths to the vast majority of client networks that visit a large CDN and comprises more than 12,000 distinct /24 BGP prefixes and 5,300 Autonomous Systems (ASes).
Our approach relied on finding a linear preference order for each network towards our anycast sites, of the form (A > B > C > …), where ‘X > Y’ means ‘the path to Site X is more preferred than the path to Site Y’. So, how can we discover the linear preference order for all clients?
Please refer to our paper for more details on our methodology.
How well does it work?
To validate our approach, we implemented and conducted experiments using our testbed. We deployed 38 anycast configurations, each one announcing from a random subset of between 1 and 14 different sites. After we deployed the configuration, we measured the RTTs between clients and their selected sites and compared it with the predicted RTT according to a client’s linear preference order. Figure 5, shows the errors in RTT predictions.
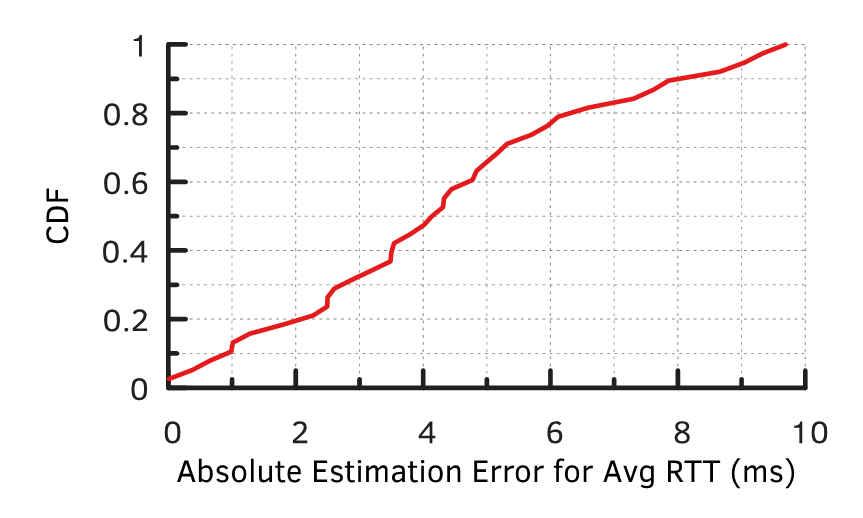
We found that our predictions are highly accurate; for nearly 90% of all predictions, the absolute error is less than 8 ms.
Given a high level of prediction accuracy, it makes sense to use AnyOpt to search for the optimal configuration offline.
AnyOpt reduces latency by 43%
Figure 6 shows the RTTs between targets (client networks) and their selected anycast sites, under three configurations. We found that AnyOpt provides the optimal offline configuration — it only includes 12 sites.
We also plotted the top 12 sites with the smallest unicast average RTT (12-greedy), and for all 15 anycast sites.
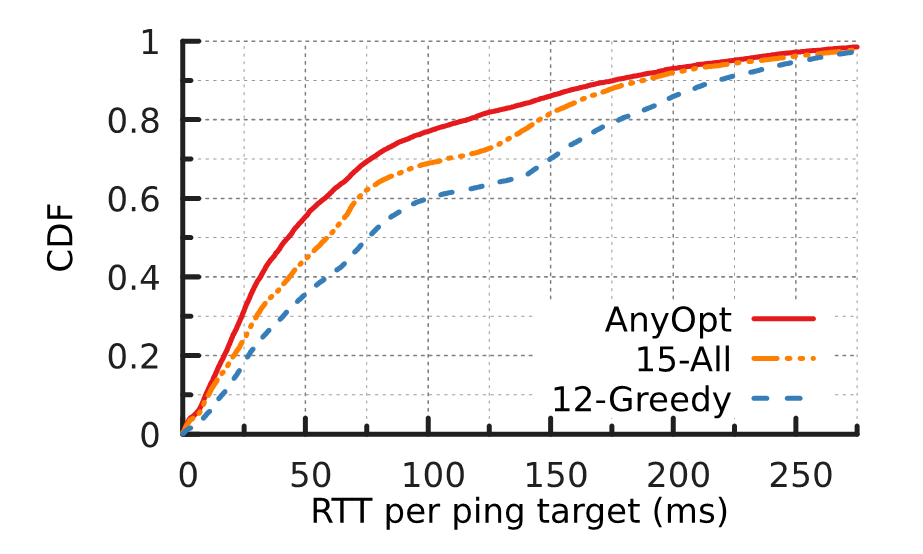
AnyOpt performs better than the alternatives when it comes to providing low-latency paths — reducing median latency by 43.4%. It can achieve a 32 ms median RTT reduction compared to a greedy approach using the same number of sites. Even when compared with cases where all 15 available sites are used, AnyOpt achieves a 14 ms median RTT reduction despite having three fewer sites.
While AnyOpt represents a substantial step forward for anycast optimization, several open problems remain to be solved, including scalability to very large networks and support for applications such as load balancing.
Please refer to our paper for more details, and the results of our study.
Xiao Zhang is a PhD candidate at Duke University.
The views expressed by the authors of this blog are their own and do not necessarily reflect the views of APNIC. Please note a Code of Conduct applies to this blog.
Hi
Thanks for this very interesting article.
There’s however a confusion between the text and the figures. The text says red is ideal case where it’s the opposite shown in the figure (orange line is optimal).
It impacts the readability of the article
Great read, though
Thanks for picking that up and letting us know Grooveek. It’s now fixed.