

Internet-wide scanning — the process of initiating network connections with public services on a set of given ports — allows researchers and network operators to understand how the Internet works in practice.
Unfortunately, no study has been able to analyse the entire IPv4 service space across all ports. Scanning all 65K ports across all 3.7 billion IPv4 addresses would take five years when using one of the fastest Internet scanners, ZMap, at a bandwidth of 1 Gbps (a bandwidth that does not overwhelm destination networks). Consequently, researchers have been subsampling the services and ports they scan, causing them to miss the majority (tens of billions) of Internet services.
To scan all IPv4 services, my colleagues and I at Stanford University have built a system called GPS, which is the first scalable and wall-time efficient solution for predicting IPv4 services across all 65K ports.
- GPS is an open-source scanning system that predicts IPv4 services across all ports in less than 48 hours, and finds billions of previously-hidden services.
- To predict services, GPS parallelizes conditional probability calculations.
- Using BigQuery, GPS is is 10000x faster than the XGBoost scanner.
- GPS uses Google BigQuery to calculate all predictions in 13 minutes.
GPS algorithm
GPS uses the following four-step algorithm to predict services:
- Collect a seed set (an IPv4 sample across all ports) to learn from.
- Construct a probabilistic model for service prediction.
- Use the model to predict at least one service across all likely-responsive IPv4 hosts.
- Use the model and the first found service to predict all remaining services on responsive IPv4 hosts.
Step 1: Collecting a seed set
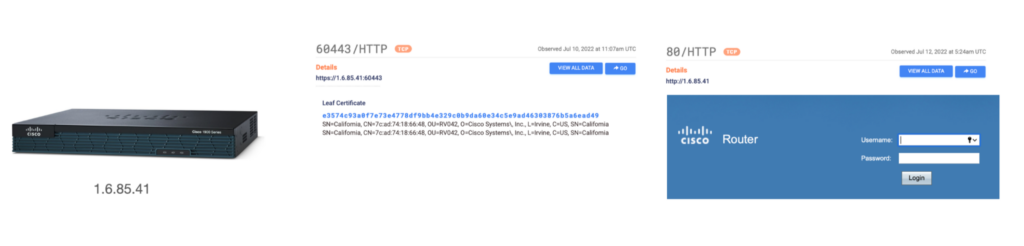
GPS starts with zero knowledge about Internet hosts. It first collects an IPv4 sample across all 65K ports to learn service patterns. The seed set will find hosts such as a Cisco box (Figure 1), which often hosts an HTTP login page on port 80 and an HTTPS page on port 60443.
Step 2: Identifying predictive patterns
To identify predictive patterns, GPS uses conditional probabilities to find the most predictive feature values. GPS will combine transport, network, and application layer features, to calculate probabilities such as: P(Port 60443 | Port 80), P(Port 60443 | Port 80, HTTP Cisco Login), and P(Port 60443 | Port 80, HTTP Cisco Login, AS9583).
GPS calculates the following four probabilities across all services and features found in its seed set:
- Transport layer correspondence: P(Port_a | Port_b)
- Transport and application layer correspondence: P(Port_a | Port_b, Application_Port_b)
- Transport and network layer correspondence: P(Port_a | Port_b, Network_IP)
- Transport, application and network layer correspondence: P(Port_a | Port_b, Application_Port_b, Network_IP)
GPS uses conditional probabilities because they are accurate, simple, and parallelizable calculations that can be done across all 65K ports. Moreover, unlike competing machine learning implementations that require millions of Internet services (which 99.99% of ports do not have) to train on, conditional probabilities do not require a large training set.
Notably, brute forcing all calculations is computationally expensive. We implement GPS with serverless computing — Google BigQuery — to minimize the wall-clock time of these calculations.
Step 3: Using probabilistic models to predict at least one service across all IPv4 hosts
The conditional probabilities GPS uses in step 2 assume that we know at least one port that is open on a host. However, the seed set only covers a small subset of hosts and therefore GPS has no knowledge about which ports are opened across most hosts. The only piece of information that GPS does know across all IPv4 hosts is the network that the IP belongs to. To use the conditional probabilities, GPS uses only network layer features to collect the minimum amount of the most predictive information about every likely-responsive hosts.
For example, for all Cisco boxes (Figure 1) that GPS finds in its seed set, it will first calculate that P(Port 80| Port 60443) = 71%, while P(Port 60443 | Port 80) = 0.2%. GPS then uses this information to determine that it should use network layer features to find services only on port 60443, as it is the most predictive service.
Concretely, GPS runs the following algorithm to identify the most predictive information. For every IP in the seed set it:
- Computes all four probabilistic models using all of the service’s features.
- Identifies the Port_b that results in the maximum P(Port_a) and save the (Port #, Network_IP) in a ‘to-scan’ list.
Step 4: Predict all remaining services on responsive IPv4 hosts
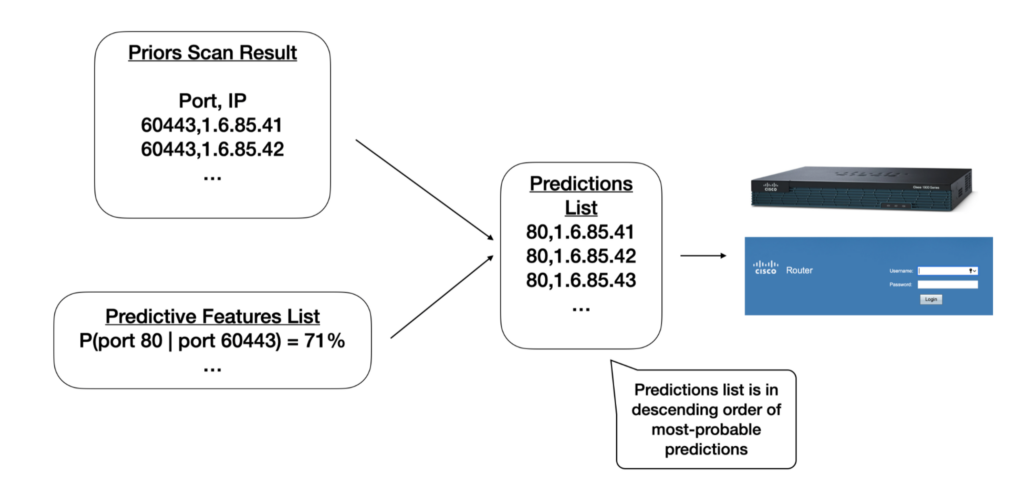
Once GPS scans the output of the previous step, GPS uses the probabilistic models and scanning results to compile a final predictions list (Figure 2). For example, given that P(Port 80| Port 60443) = 71%, GPS will find all hosts that have responded on port 60443 and will predict that they also host a service on port 80.
Evaluating GPS
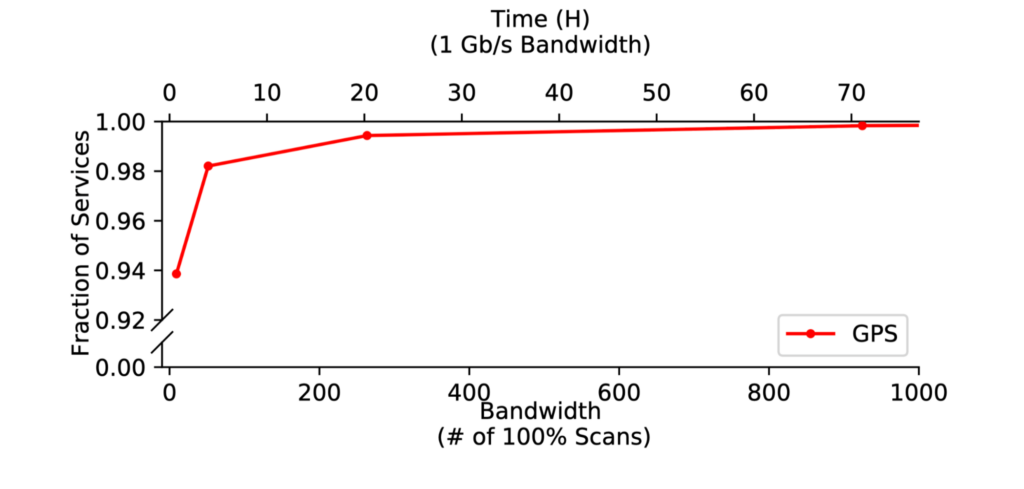
The objective of GPS is to maximize finding services across all ports. To evaluate GPS, we compiled a ground truth of services using 100% IPv4 scans across the most popular 2K ports (we evaluated against other datasets in the full paper).
GPS found 99% of services in our ground truth and took less than 24 hours to scan its predictions (Figure 3).
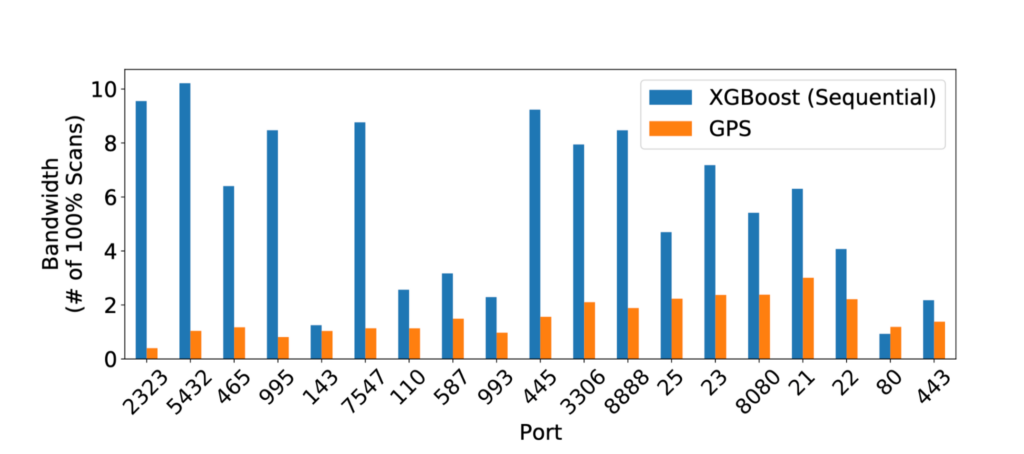
We evaluated GPS against an XGBoost classifier machine learning implementation for predicting services and found that GPS saves up to 28x more bandwidth than the XGBoost scanner when scanning 18/19 popular ports (Figure 4).
On a single core, GPS calculates predictions in 9 days and 9 hours — 5.6 times faster than the XGBoost scanner. Using serverless computing, GPS calculates predictions in 13 minutes — 10000x faster than XGBoost scanner — while only costing 75 cents. GPS’ bottleneck is bandwidth, as seed scan collection can take days/months and the uploading/downloading of data between serverless platforms can take hours. Nevertheless, with an available seed scan, GPS has a total runtime of less than 48 hours.
GPS is open-sourced and can be found at: https://github.com/stanford-esrg/gps
This work was presented at Sigcomm 2022. You can read the paper and watch the conference talk.
Liz Izhikevich is a PhD Candidate/NSF Fellow/Stanford Graduate Fellow at the Computer Science Department at Stanford University.
The views expressed by the authors of this blog are their own and do not necessarily reflect the views of APNIC. Please note a Code of Conduct applies to this blog.