

Content Delivery Network (CDN) administrators are often faced with a fundamental question: “Should I adopt a new shiny protocol or should I continue using a trusted and reliable protocol?” This has especially been true with the development, release, and standardization of QUIC.
Unfortunately, academic publications and industry experiments provide conflicting results, because of inappropriate baselines and unstandardized testing environments, making it challenging for CDN administrators to make informed decisions.
We at Brown University observed that bridging the chasm and providing consistent results is impossible using current methods. In particular, academic benchmarking on open platforms lack key optimizations, and industry benchmarks overlook proprietary optimizations.
In a recent paper published at the Web Conference 2021, we addressed these issues by providing a testing harness and a method for dissecting the performance of production QUIC. This post shares some highlights from our study.
- Operational issues, developer design choices, and congestion control were the cause of many performance differences rather than protocol design.
- QUIC’s faster connection establishment has a noticeable but limited impact.
- Deploying QUIC does not automatically lead to improvements in network or application performance for many use cases.
Enabling robust and comparable performance analysis
Motivated by the conflicting observations and results, my team and I developed a robust methodology for understanding and dissecting QUIC performance. The key insights underlying our methodology are twofold:
- Most QUIC deployments use a unique and often in-house codebase that makes it challenging to compare QUIC results between companies.
- Unlike open-source deployments, many companies also include proprietary optimizations within their UDP stack, which are not readily available in the traditional kernel.
Motivated by these insights, our methodology aimed to benchmark production endpoints rather than testbed deployments. Additionally, rather than comparing across QUIC deployments for different companies, we performed a localized comparison between QUIC and TCP deployments for specific companies. These comparisons allowed us to, in theory, control company-specific optimizations and policies. Moreover, to capture a more holistic view of QUIC performance, we compared and analysed multiple QUIC clients.
There are several challenges in capturing and using data from production endpoints for analyzing QUIC, including:
- The need for companies to externalize server endpoints.
- Server endpoints provide application-level access and not direct access to the transport protocols.
- Application-level performance metrics are often different from transport-level performance metrics.
We addressed these challenges by working with providers to identify available endpoints. We tested these endpoints using HTTP/2 and HTTP/3 application protocols, which allowed us to analyse TCP and QUIC protocols, respectively. Finally, we tested for both single-object and multi-object performance: the single object performance enables us to understand raw transport behaviour while the multi-object allows us to understand how the application can use new protocol features.
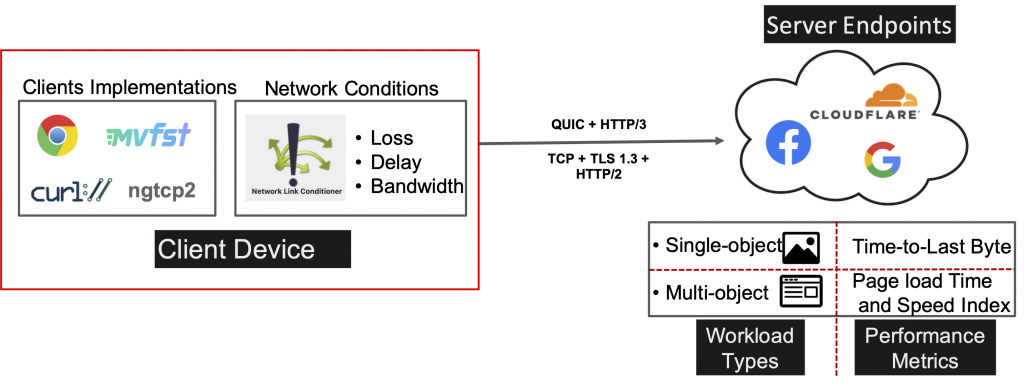
To perform our tests, we developed a testing harness consisting of a client device that emulates a broad range of different network conditions, thus enabling us to analyse implementation behaviour across a broad range of scenarios. For our H2 clients, we used Google Chrome and cURL, and for our H3 clients, we used Google Chrome, Facebook Proxygen, and Ngtcp2.
We tested against publicly available endpoints from Google, Facebook, and Cloudflare. To the best of our knowledge, these were the only companies that served QUIC in production as of December 2020.
Methods for dissecting performance idiosyncrasies
The main goal for our measurement tools is to identify the root causes behind performance discrepancies between production QUIC and TCP. Our emphasis on evaluating and analysing production performance requires a fundamental shift in approach compared to prior QUIC studies, whose conclusions are mainly based on local experiments.
The generalized workflow for our single benchmark is as follows (Figure 2):
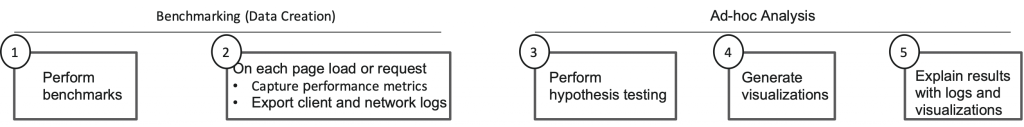
Our workflow differs slightly between the single and the multi-object analysis (refer to our paper).
Overall, we found that this approach of connecting real-world findings with client analysis or local reproduction bypasses concerns of misconfiguration and provides relevant insight into the aspects of QUIC that are lacking at the production level.
Analysis of performance idiosyncrasies in production QUIC
Our hypothesis for our single-object web experiments was that the difference between TCP and QUIC results should be minimal given QUIC only uses one bidirectional stream to send and receive data for a single web object. This is effectively the same as using a TCP connection.
However, our results showed the contrary since significant Time To Last Byte (TTLB) differences exist between H2 and H3 for numerous network conditions and object sizes.
We found this to be due to several reasons:
Protocol design
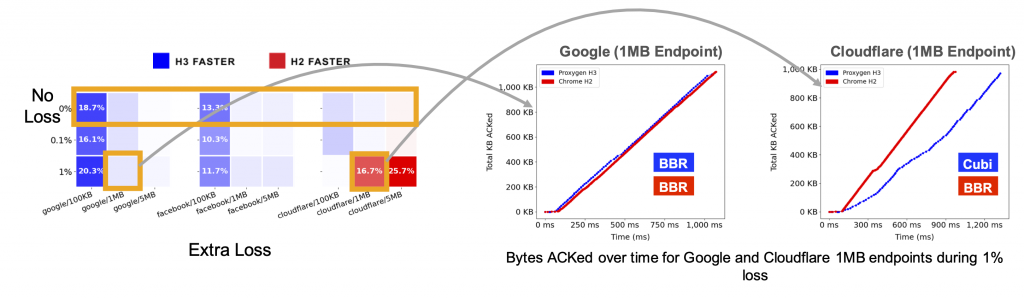
We observed that without added loss or latency (Figure 3, first row), H3 consistently performed better than H2 for 100KB payloads. However, for larger payloads, H3’s performance was essentially equivalent to H2’s. We attribute this behaviour to QUIC’s 1 RTT handshake advantage over TCP for two reasons:
- The behaviour is consistent across content providers, implying that protocol design rather than implementation design is the root cause.
- As a matter of logic, a 1 RTT difference impacts short-lived connections greater than longer ones. Thus, our data demonstrates that with a network bandwidth of 10Mbps, QUIC’s 1 RTT advantage significantly impacts connections whose payloads are less than 1MB, but negligible impact otherwise.
A key implication of this result is that QUIC’s faster connection establishment has a noticeable but limited impact.
Congestion control algorithm
We observed a pattern with Cloudflare where H3 performed much worse than H2 during 1% added loss (Figure 3, third row). To identify the root cause behind Cloudflare’s poor QUIC performance, we first plotted bytes ACKed over time from our median requests to Cloudflare and Google 1MB endpoints during the 1% loss to visualize the differences in packet behaviour between these two QUIC deployments.
The ACK visualizations (middle and right graphs Figure 3) show that for Cloudflare, H3 lagged behind H2 from the onset of their requests and was never able to catch up. This greatly contrasts with Google’s behaviour, where H2 and H3 were virtually identical throughout their requests. Considering that Cloudflare uses Cubic for QUIC’s congestion control and BBR for TCP’s, we suspected that Cubic’s handling of early loss was the root cause behind H3’s degraded ACK rate.
Cubic is prone to performance degradation during early packet loss since the sender sets window max to the current congestion window whenever it detects a lost packet. When there is early loss, the congestion window is bound to be small since it has only received a few ACKs to increase its size exponentially during slow start.
Unlike Cubic, BBR is not as severely hindered by early loss since it uses the data acknowledgement rate rather than loss as a signal for congestion. As a result, Cloudflare’s poor H3 performance demonstrates Cubic’s difficulty in using a link’s full bandwidth during random loss.
While the sustained, random loss at 10Mbps bandwidth may not reflect a common, real-world network condition, our analysis still shows that congestion control can significantly impact the performance of QUIC.
A key implication of this result is that it is important to differentiate between QUIC and its congestion control as not doing so will incorrectly lead to false pretences about QUIC.
New edge cases and client configuration
We discovered an incompatibility in Ngtcp2’s client codebase led to performance issues when adding a 100ms delay to the network. This is due to a bug in Proxygen’s BBR congestion control code.
When Proxygen sends a probe packet the ACK for this probe is not received within 100ms (due to the added 100ms delay), and the probe timeout (which is set to 100ms) initiates another probe packet. Unfortunately, when the ACK for the first initial packet is received, right after Proxygen sent it’s probe, Proxygen incorrectly infers this is the ACK for the most recent probe. As a result, the proxy inaccurately calculates the RTT measurements from the implicit ACKs and feeds this information into BBR, which thinks the RTT measurement is below 10ms when the actual RTT is above 100ms.
This bug has a significant impact on the BBR congestion control model as perceived bandwidth is calculated based on RTT. When BBR encounters such a substantial and sudden increase in RTT, in this case from 10ms to 100ms, it will stop exponentially increasing estimated bandwidth as it perceives that full bottleneck bandwidth has been reached.
As a result of our analysis, we also realized that Ngtcp2 used 2 RTTs instead of 1 RTT to complete its handshakes with Facebook and Cloudflare servers, leading to poor performance relative to other clients.
This result has several implications: due to introducing new features (for example, packet spaces), QUIC creates novel edge cases that can seriously degrade network performance if mishandled. Client configuration plays an important role in optimizing QUIC performance.
Deploying QUIC isn’t so simple
Our study shows that optimizing QUIC, in practice, can be difficult and time-consuming considering the overhead of dealing with QUIC’s edge cases and implementing congestion control algorithms from scratch.
Moreover, by demonstrating large differences between Google, Facebook, and Cloudflare’s QUIC performance profiles, we show that deploying QUIC does not automatically lead to improvements in network or application performance for many use cases.
Given the difficulty and associated overheads, we urge the community to explore the designs of automated frameworks for exhaustively debugging QUIC and to consider the development of automated frameworks for systematically developing tailored policies that use QUIC’s unique properties.
Theophilus A. Benson is an assistant professor in the Computer Science Department at Brown University.
The views expressed by the authors of this blog are their own and do not necessarily reflect the views of APNIC. Please note a Code of Conduct applies to this blog.