

Video-conferencing applications have seen an unprecedented surge in popularity over the past few years. Zoom has been at the forefront of this phenomenon, with adoption by many organizations for various use cases, including remote teaching and telemedicine. Unfortunately, Zoom uses a proprietary and undocumented header format that hinders efforts to measure Zoom and its performance in the wild.
Video conferencing is especially sensitive to changes in network performance as even transient variations in latency and bandwidth can cause audio and video signals to stall or become distorted or pixelated. Given increasing user performance expectations and resource contention in today’s networks, operators and researchers need the ability to measure (and improve) the performance of Zoom video-conferencing sessions in large-scale production networks. This is particularly important for network operators, who do not have the tools or capabilities to measure Zoom and other video-conferencing applications and, as a result, do not even know if their users’ video-conferencing sessions suffer from performance problems, apart from when they receive explicit complaints.
In our work on Zoom performance measurement published in ACM IMC 2022, we demystify Zoom and its packet format and show how operators can measure the performance of video-conferencing sessions from the network’s vantage point, that is, solely using passively collected packets, without requiring cooperation from end hosts, and at high traffic rates. We make all of our software tools available as open-source software; this includes a Zoom Wireshark plugin to easily inspect and analyse Zoom traffic.
Measuring Zoom performance in the wild
Due to the proprietary packet format, prior efforts to measure Zoom in larger, production networks only considered coarse-grained metrics such as per-flow packet or byte rate that do not carry enough detail to estimate the performance of a session. In fact, these metrics are frequently misleading as the overall byte and packet rates of video-conferencing sessions often change for reasons entirely unrelated to the network. For example, user interface interactions (such as switching between full-screen and thumbnail video modes) cause the Zoom server to adjust the sending rate. As a result, finer-grained metrics such as latency, jitter, frame rate, packet loss, and meeting structure over time (for example, when participants join or leave a meeting or share a particular media type) must be evaluated in conjunction to uncover meeting characteristics and estimate performance.
Demystifying Zoom
To extract useful performance data from Zoom media packets, we need to understand firstly how Zoom encapsulates media to be sent over the network and how to filter the respective traffic and secondly if Zoom packets contain any useful header fields in clear text that can be used to make deeper inferences about the traffic and, ultimately, estimate performance.
Detecting Zoom Traffic
Through controlled experiments, we discovered that Zoom either uses a direct peer-to-peer (P2P) connection between meeting participants or relays media streams through an intermediate server, a so-called Selective Forwarding Unit (SFU). Zoom publishes the list of IP address blocks and port numbers their servers use such that filtering for Zoom traffic that originates at or is destined for a Zoom server is trivial. Detecting P2P connections that Zoom commonly uses in two-party calls, however, is more complex. We found that these connections can be detected by observing a STUN message exchange to a Zoom server that precedes each P2P connection. More details on this logic can be found in our paper.
Demystifying Zoom’s packet format
Even though Zoom states that it uses encryption for all media traffic, to find out if the entire UDP payload is encrypted, we analysed the entropy of the payload bytes. Apart from encrypted portions of the header, using this technique (explained in more depth in our paper), we were able to find payload fields that indicate the media type (specifically, audio, video, or screen sharing), various packet- and frame-level sequence numbers and timestamps, and even a field that indicates whether the participant is currently speaking or not. Through detective work, we were eventually able to find repeating structures consisting of several distinct fields at different offsets and the dependencies between them in the packet payload.
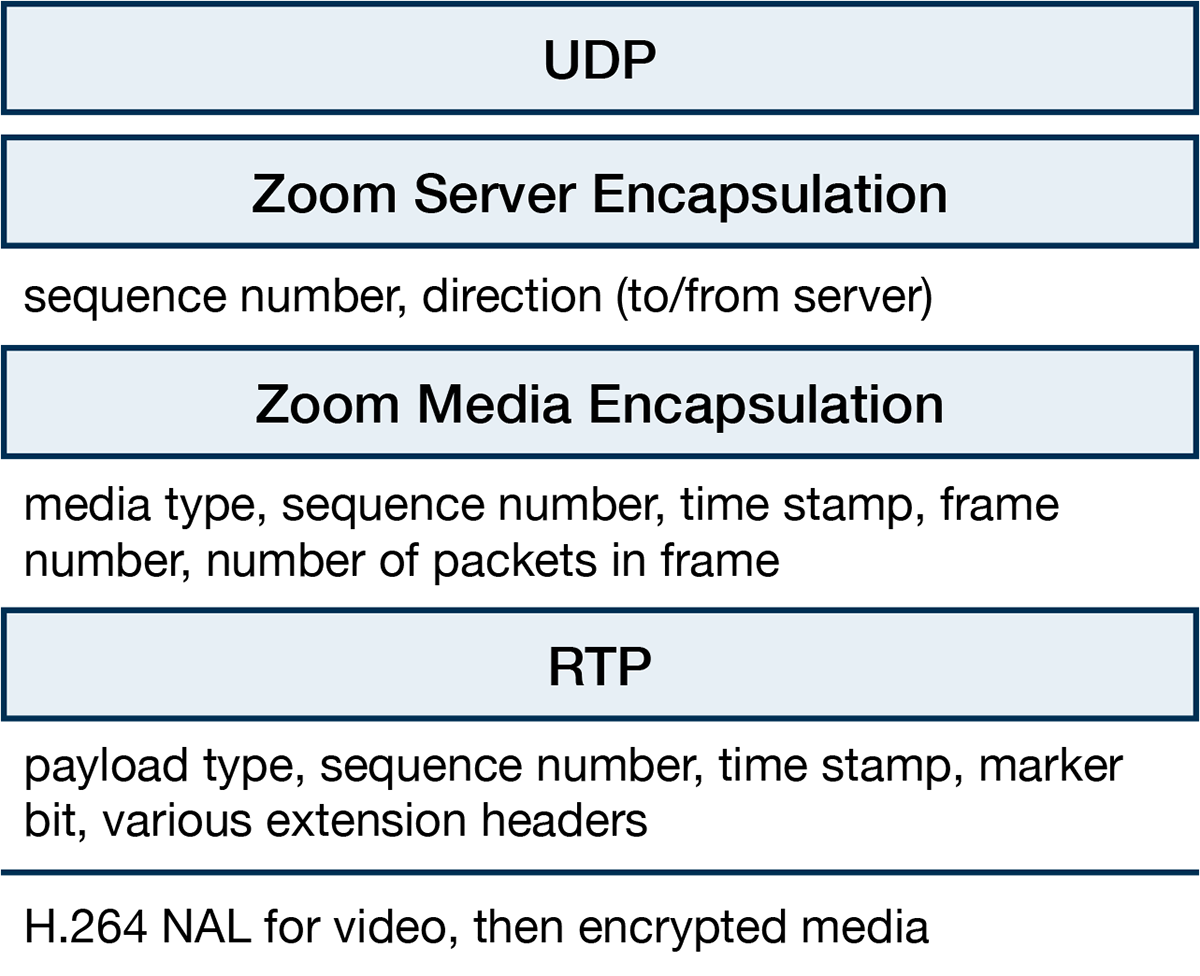
One such structure is a standard RTP header where the packet’s media type determines where the RTP header starts. After this header, video packets carry an H.264 header which is then followed by the (encrypted) media payload. Figure 1 shows the resulting header format.
Extracting fine-grained performance metrics from Zoom packets
This deeper understanding of Zoom’s packet format allows us to extract several performance-related metrics directly from the packets. For example, each media frame within an RTP stream carries a unique time stamp. Using the timestamp, it is then possible to compute the current frame rate as well as the frame-level jitter. These metrics both have a direct impact on the audio and video quality perceived by the user. Also, knowing exactly where the media payload starts (for example, after the H.264 header) allows us to specify the media bit rate exactly. Analysing RTP sequence numbers allows for quantifying packet losses and retransmissions. The set of metrics our tools provide is listed in Table 1.
| Metric | Requires Zoom header format |
| Flow-level Bit Rate and Packet Rate | |
| Media Bit Rate | ● |
| Frame Rate | ● |
| Frame Size | ● |
| Latency | ● |
| Jitter | ● |
| Loss, Retransmission, Out-of-order | ● |
To quantify the number of participants in a meeting, when they join and leave, and what media they share, we developed a heuristic that uses multiple features (for example, association with IP addresses and port numbers) to group media streams that are part of the same meeting together. After grouping, we often see the same packet multiple times — once when being sent from a meeting participant and then when being received by (often multiple) participants after forwarding by Zoom’s server. By matching the RTP sequence numbers of such outgoing and incoming packets, we can then measure the round-trip-time (RTT) to the Zoom server for every single packet.
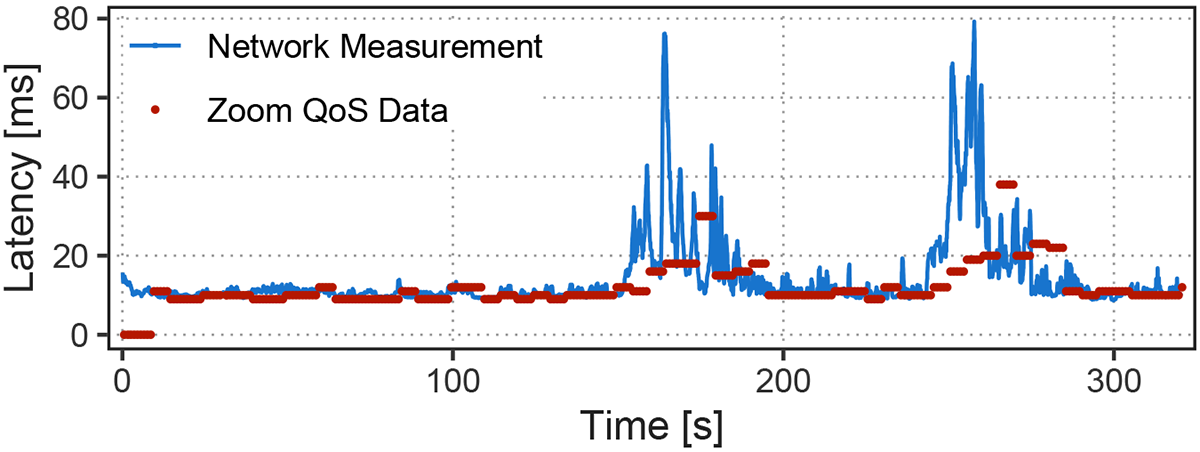
We validated several of our measurement techniques using Quality of Service (QoS) data provided by the Zoom client. Figure 2 shows a comparison between our latency measurements (blue line) and Zoom-provided data (red dots) in a controlled experiment. In general, our measurements match the Zoom-provided data, but we provide significantly more data points (one per packet vs one every five seconds), which allows us to detect short-term spikes in latency.
Enabling measurement at scale
To demonstrate the scalability of our techniques, we built a measurement system that can analyse all Zoom traffic entering or exiting the Princeton University campus. We use a P4-programmable Intel Tofino switch, on which we implemented the Zoom filtering logic described above (including detecting P2P flows). On our campus, network taps installed at all border routers mirror all packets to this switch that then only forwards the Zoom traffic to our analysis server in order to reduce the packet rate to be processed in software.
Using this setup, we collected a 12-hour trace consisting of roughly 1.8 billion Zoom packets and 59,020 RTP streams. While we only scratch the surface of the analyses possible using our tools, we demonstrate how individual metrics (such as byte rates and even frame rate alone) are misleading when judging performance. For example, we find that Zoom adjusts both picture resolution (resulting in smaller frame sizes) and frame rate both when adjusting for poor performance and in response to user interface changes. Disambiguating such cases requires inspecting all metrics in conjunction. Inspecting more network-related metrics (for example, jitter) in contrast with application-level metrics can resolve ambiguity in this scenario. A deeper analysis of our data set can be found in the paper.
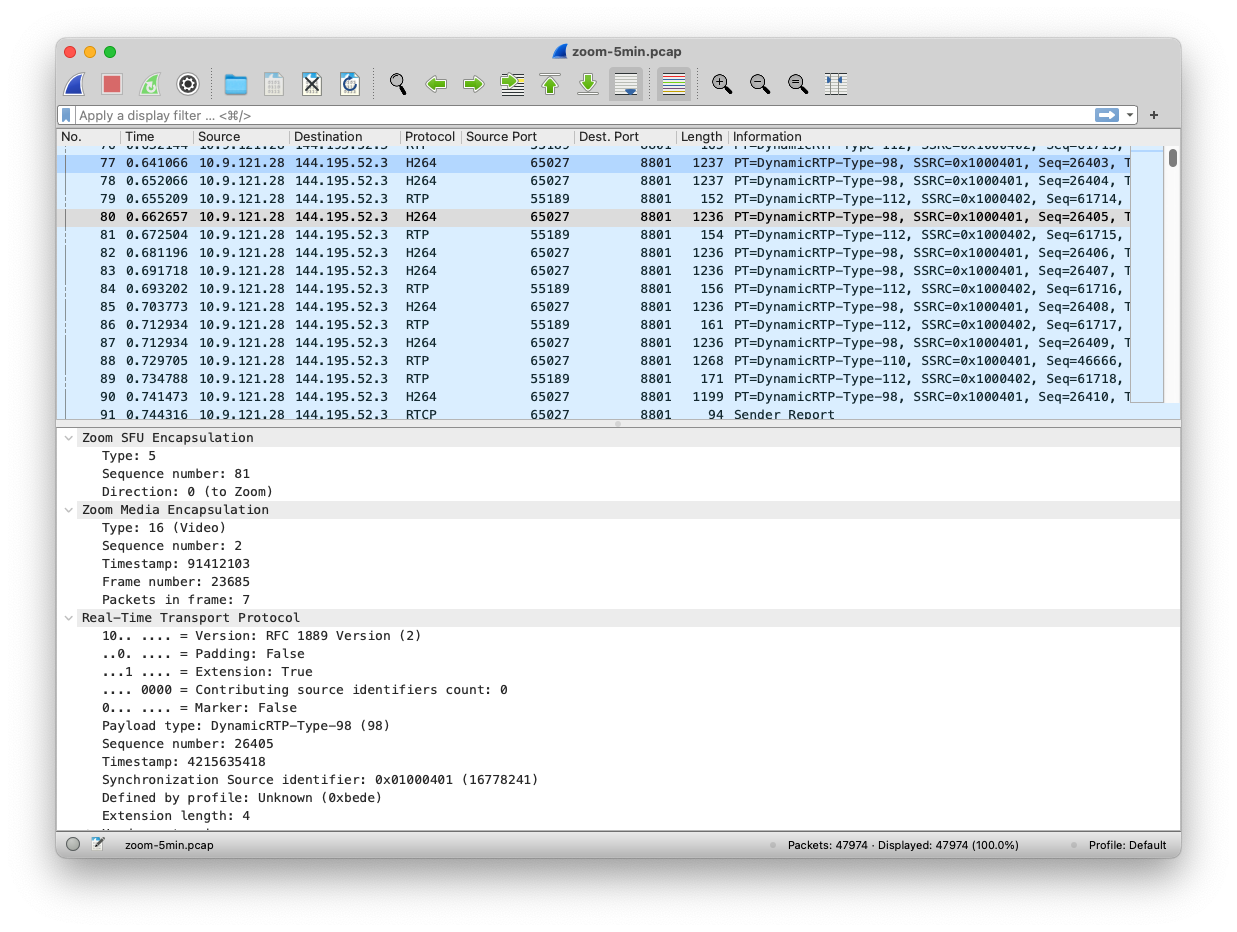
To give the community the tools to inspect their own Zoom traffic, document our findings, and bootstrap future work on Zoom measurement, we wrote a Wireshark plugin that can be used to analyse Zoom traffic easily. Figure 3 shows a screenshot of the plugin in action. Furthermore, we’ve released all our analysis tools that take PCAP files as input, parse and process Zoom packets, and generate easy-to-analyse data sets of the relevant metrics at multiple levels of aggregation.
Conclusions
In the past, Zoom’s proprietary header format made it hard for network operators and researchers to understand how Zoom operates and performs in the wild. In this work, we demystify Zoom far beyond prior work and show how to extract metrics that closely relate to the quality of a Zoom call, such as media bit rates, frame rate, and frame-level jitter. We achieve this by solely inspecting passively collected packets, without any coordination from Zoom clients or servers. We believe our work and set of tools paves the way for enabling network operators and researchers to conduct in-depth measurements of Zoom performance in production networks.
Oliver Michel is a postdoctoral research associate at Princeton University focusing on hardware support for real-time video conferencing applications, scalable packet-level network monitoring, programmable data planes, and high-performance networking architectures.
Discuss on Hacker NewsThe views expressed by the authors of this blog are their own and do not necessarily reflect the views of APNIC. Please note a Code of Conduct applies to this blog.