
We at SIDN Labs have developed and open-sourced a DNS anycast monitoring tool called Anteater for DNS operators. Anteater’s main value is that it informs a DNS operator about the latencies that clients experience across the operator’s entire authoritative DNS infrastructure, purely on the basis of passive DNS measurements — even if the anycast service itself is run in-house or outsourced. In this blog we discuss how we measure the real latencies experienced by clients querying our authoritative server, in near real time, and how you can monitor such latencies in near-real time using ENTRADA and Anteater.
DNS operators and the challenge of delivering fast responses
DNS operators strive to deliver fast DNS responses to clients — say, under 50ms, and hopefully well under. However, they typically don’t really know what latencies their clients experience. Why?
Well, because DNS operators don’t have access to clients’ networks, so they cannot send queries from the clients’ vantage points or measure the round-trip times (RTTs). There are alternative ways of obtaining the data, such as using RIPE Atlas (~10k measurement points in client networks). However, tools like this only cover some of the client networks that a large DNS operator serves.
So, what are the alternatives? You could also run Verfploeter, but that requires active measurements from the anycast network. Making such measurements is complicated, because many operations teams don’t have full access to their name servers, especially if they hire third-party services. Also, Verfploeter does not support IPv6, which means it won’t capture the RTTs of DNS queries/responses sent over IPv6.
We therefore wondered whether we could find an alternative approach that filled the following criteria:
- No requirement to perform extra measurements
- Support for IPv6
- Measurements based on real clients, not arbitrary vantage points
Our approach: using DNS over TCP to measure RTTs
It turns out that there is another, somewhat overlooked source of the required information: your own traffic, specifically the DNS queries sent over TCP. DNS supports both TCP and UDP, and TCP is used for large responses after truncation (or zone transfers). Given that TCP requires a session to be established, we can measure the RTT from a client to a server during the TCP handshake (time difference between the first and third packets).
Together with colleagues at the University of Southern California/Information Sciences Institute (USC/ISI), we have released a technical report detailing that measurement methodology. The report proves that the approach can be used to measure real clients’ RTTs and explains how it can be used. (You can also watch the video presentation at DNS-OARC and view the slides as well.)
If you’re a DNS operator, the biggest advantage of using DNS over TCP RTT measurements is that the data is available for free: it’s right there on your own DNS infrastructure. You just need to analyse it. And that is what our open-source tool, Anteater, does. You can download it from our GitHub repository.
Leveraging TCP RTT with Anteater
Figure 1 shows an anycast server with five sites (A1—A5). Clients, such an ISP’s resolver, end up being mapped by BGP to one of these five anycast sites. At SIDN, we collect traffic from our anycast servers and their sites and export it to ENTRADA, our open-source DNS data streaming warehouse. ENTRADA is a Hadoop-based application that converts cumbersome pcap files to a format that can be easily queried with SQL.

What Anteater does is pull data from ENTRADA, aggregate it according to various criteria (servers, server sites, specific Autonomous Systems (ASes)), and store it in a PostgreSQL database. ENTRADA automatically calculates the RTT during the TCP handshake and adds its own database, which makes our lives much easier. The last step consists of configuring a Grafana dashboard — for which we have also included automated scripts.
Monitoring your servers in (near) real time
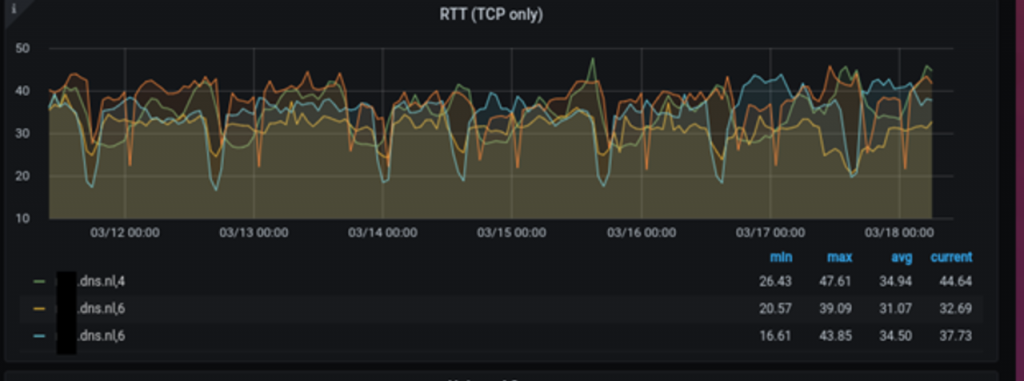
OK, so what can Anteater do for you as a DNS operator? First, you can now, in real time, see the RTTs that your servers deliver to their clients. Figure 2 shows hourly measurements for .nl’s authoritative servers, both for IPv4 and IPv6. We have been using Anteater at SIDN for more than one and a half years now. As you can see from Figure 2, our servers deliver an average response time of 34ms.
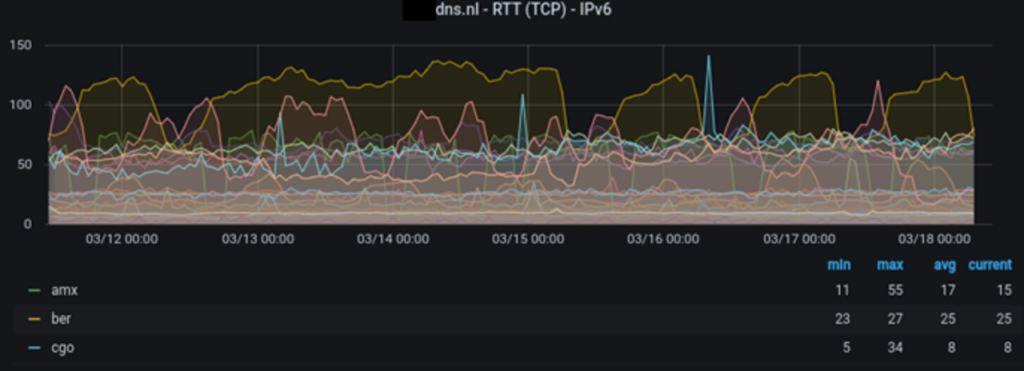
We can also show the RTT of each anycast site (each location announced for a server). Figure 3 shows the RTT in ms for each anycast site of one of .nl’s authoritative servers, for IPv6. In this figure, each line is one site (AMX = Amsterdam, BER = Berlin, CGO = Paris), showing how the RTTs change over time. Our rule of thumb is that any site experiencing RTTs above 100ms should be investigated.
Detecting problems affecting specific clients
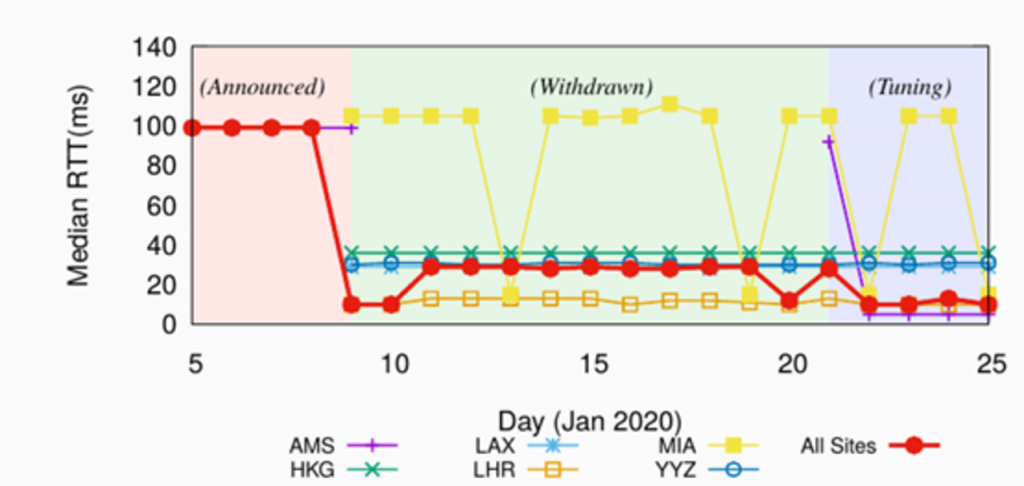
A situation that arose last year illustrates the practical application of the method. In 2020, we found that Google (AS15169) was experiencing high latencies to one of our servers. The high latencies were detected using Anteater, and after that we were able to identify the root cause of the problem and fix it. It turned out that Google was ‘polarized’ to one particular anycast server, reaching only one site of the five available. You can read more about it in the technical report, but we worked with Google and fixed the issue, improving the RTT from 100ms to 10ms, a 90ms decrease.
You can see that in the figure below: the red line shows the overall average RTT from Google to the server in question, for all sites. During the ‘Announced’ phase, the RTT was 100ms. We then fixed the problem, and the RTT went down to around 10ms in the last phase (‘Tuning’, which involved manipulating BGP; see technical report). Without Anteater and DNS-over-TCP measurements, we would not have known about this issue.
Indirectly detecting route leaks with Anteater
Another application for Anteater is to indirectly detect routing issues. Also described in our technical report, we show how one .nl anycast site unexpectedly started to receive lots of traffic from many different networks, most of them in the EU. As can be seen in Figure 5, at around 16:00, the number of resolvers reaching the site went up to 60k/hour, from fewer than 5k/hour beforehand. The query rate increased three-fold.
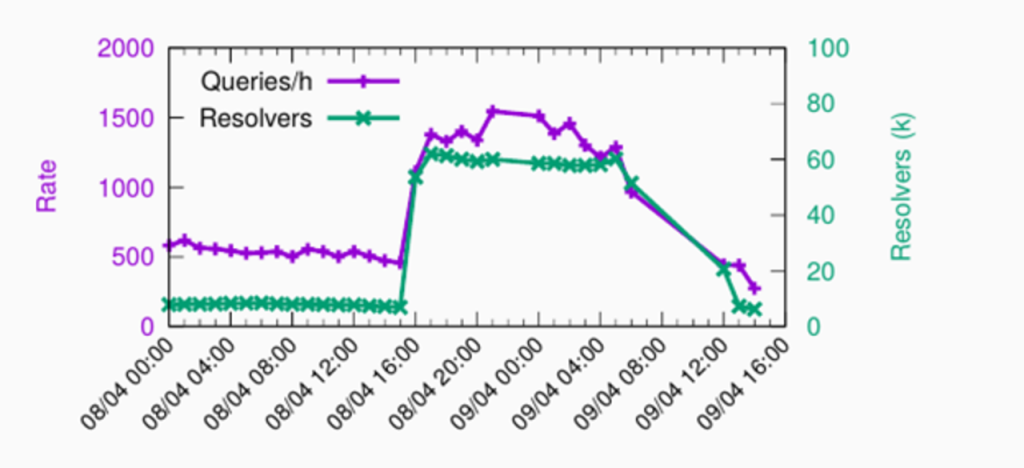
We analysed the RTT for this site, located in Sydney, Australia, as shown in Figure 6. As you can see, the RTT was initially below 50ms, but after 16:00 it went to above 200ms.
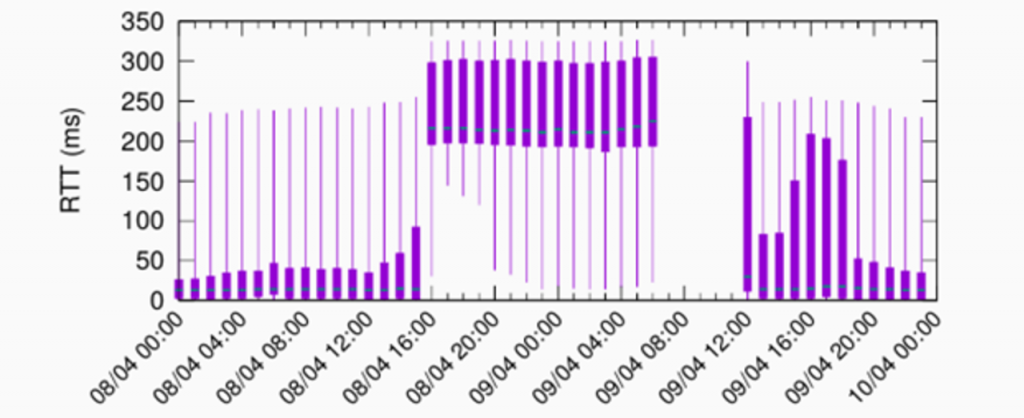
We contacted the operator, who was already working on the issue, and was able to resolve it after establishing that a tier-1 ISP had erroneously propagated the anycast prefix for Sydney to all its peers, globally. Because the tier-1 ISP is very well connected, many clients from the EU were mapped to the site in Australia, which is geographically far from Europe, and therefore has a high RTT. With Anteater, we can arrange for Grafana alerts to be sent when something like this happens (say, “notify me when RTT > 100ms for all sites”).
In our case, the operator first withdrew the route announcements, and that is why we do not see queries on the day after. At around 12:00, the operator started announcing the route again, and the latency for the .nl server in Sydney returned to normal values. Given that the anycast service in question is run by a third-party organization, it would be difficult for us to know about this kind of event without Anteater (and ENTRADA DNS TCP RTT measurements).
The last dashboard we provide with Anteater is for monitoring the RTTs to specific ASes. For example, we know that a third of .nl’s (and .nz’s) DNS traffic comes from five large cloud providers, making it important to deliver fast response times to the providers concerned (<40ms). Figure 7, below, shows the RTT measurements for various ASes, over IPv4. As you can see, most ASes experience RTTs of less than 30ms, which is considered good. Any anomalies here could suggest network problems, so we have configured alerts to take care of that.

To sum up
DNS over TCP provides vital information that can be used to monitor and troubleshoot anycast networks, enabling DNS operators to further increase their control over their authoritative DNS servers’ RTT performance. As described in this blog, Anteater, our open-source tool, can be used to monitor anycast DNS systems in near real time. At SIDN, we’ve been working with Anteater for more than eighteen months, and we hope that other DNS operators can also benefit from using it, so that the stability of the whole DNS improves.
Giovane Moura is a Data Scientist with SIDN Labs.
Cristian Hesselman contributed to this post.
This post originally appeared on the SIDN Labs Blog.
The views expressed by the authors of this blog are their own and do not necessarily reflect the views of APNIC. Please note a Code of Conduct applies to this blog.
