DNS over TLS (DoT) is an extension to the DNS over UDP/53 (Do53) protocol, which provides additional confidentiality to the DNS messages between the client and server. Since its standardization in RFC 7858 in 2016, DoT has gained increasing support by various DNS services as well as operating systems.
To understand how available DoT is and how it performs for an end user, we studied the adoption, reliability, and response times of DoT using RIPE Atlas.
Unencrypted DNS traffic is vulnerable to fingerprinting or tracking, among other issues. To overcome such privacy risks, DoT secures the communication by first establishing a TLS session (on port 853) between a client and resolver, before sending DNS requests and responses.
In this study, we investigate DoT using 3,200 RIPE Atlas home probes deployed across more than 125 economies in July 2019. We issue DNS measurements using Do53 and DoT, which RIPE Atlas has been supporting since 2018, to a set of 15 public resolver services (five of which support DoT), in addition to the local probe resolvers, shown in the figures below.
The DNS lookups are performed over IPv4 for 200 domains (A records) once a day over a period of a week, which results in 90 million measurements overall for our experiment. These allow us to study the reliability and response times for different Do53 and DoT resolvers around the globe.
The main findings of our experiment are:
- Adoption: Only 13 (0.4%) of the 3,200 home probes receive responses over DoT from their local resolvers. The 13 probes are located in Europe (11 probes) and North America (2 probes) exclusively
- Reliability: Overall, failure rates for Do53 are between 0.8 to 1.5% for most resolvers; on the other hand, failure rates for DoT are higher and more varying with 1.3 to 39.4%. Local resolvers exhibit higher failure rates for both Do53 and DoT in contrast to public resolvers. In particular, for DoT, issues occur closer to the probes and along the paths, indicating that middleboxes drop DoT traffic, which results in numerous timeouts.
- Response times: Most DoT response times are slower by more than 100ms when compared to Do53, largely due to the measured connection and session overhead for the TCP and TLS handshakes. DoT response times for the local resolvers are on par with DoT response times of the faster public resolvers.
- RIPE Atlas probes in Africa and South America show the highest variation with respect to reliability and response times for different resolvers.
Reliability
To determine reliability, we calculate the failure rate, specifically the number of failed queries divided by the total number of queries. We consider a query failed if the probe could not send the DNS request to the resolver or if the probe did not receive a DNS response by the resolver; in both cases, the RIPE Atlas API records an error along with an error message. Most errors for both Do53 and DoT are related to timeouts, socket errors, connect() errors, and TCP/TLS errors (exclusive to DoT).
Overall failure rates
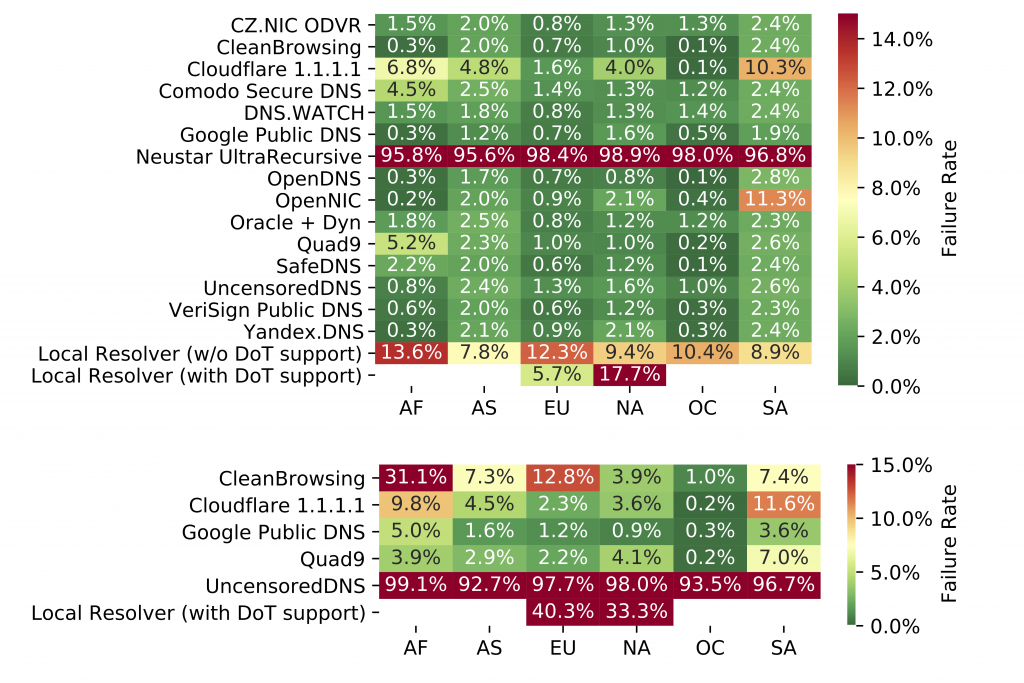
Taking all measurements into account, the failure rate for Do53 is 7.9% while the failure rate for DoT is higher with 22.9%, that is, a difference of 15.0% points. However, note that the overall failure rates are heavily influenced by a few resolvers exhibiting high failure rates (in specific parts of the world), as shown in Figure 1.
Read: Tracking RPKI repository performance with a RIPE Atlas measurement bundle
Comparing the failure rates for resolvers that offer both Do53 and DoT, failure rates are inflated for DoT, which range from roughly 0.5% points for Google and Cloudflare, over 1 to 10% points for Quad9 and CleanBrowsing, to more than 30% points for local resolvers. The DoT failure rate for UncensoredDNS is more than 95% points, which suggests server-side issues, whereas for the other resolvers, issues are more common along the path and closer to the probe. As DoT was only standardized in 2016 and has not seen widespread adoption yet, its traffic (TCP/853) is likely still dropped by middleboxes, which results in the many observed timeouts (default 5-second timeout).
Regional comparison
Figure 1 shows the median failure rates of Do53 (top) and DoT (bottom) by resolver and continent (based on probe location). For Do53, the failure rates are similar across all continents and most resolvers (0.3-3%). Local resolvers fail significantly more often (5.7-13.6%), which means that RIPE Atlas probes have less success in resolving domain names when using their local resolver (regardless of DoT support). As a result, Do53 measurements on RIPE Atlas are more reliable with public resolvers compared to local ones. When comparing different continents, probes deployed in Oceania are the most reliable for Do53, as they have failure rates of at most 0.5% for the majority of resolvers.
Concerning DoT, the most reliable resolvers across all continents are Google and Quad9 (<5% in most continents); Cloudflare and CleanBrowsing fail more frequently, particularly in Africa (9.8% and 31.1%) and South America (11.6% and 7.4%). Local resolvers with DoT support exhibit high failure rates as well (40.3% in Europe and 33.3% in North America). As discussed above, most queries to UncensoredDNS fail, resulting in high failure rates across all regions (92.7-99.1%). Considering most DoT resolvers have higher failure rates in Africa and South America, both continents may be affected by middlebox ossification more heavily.
Overall, the measurements suggest that the reliability of DoT highly depends on the DNS service and the client’s geographical location.

Response times
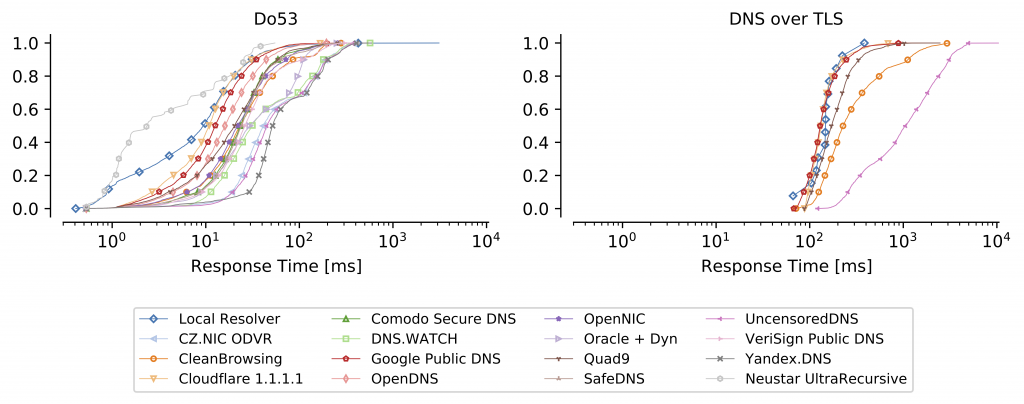
For the analysis of the response times, we use the fifth percentiles of the response times for each (probe, resolver) tuple, shown in Figure 2. Considering that we repeat the measurements for 200 domains over a week, these fifth percentiles should approximate the response times for cached records.
Note: As described in the DoT standard (RFC 7858, section 3.4), the connections and session should be reused for multiple queries in order to reduce the establishment overhead, ideally also with TCP Fast Open. However, measurements on RIPE Atlas are intended, and designed, to be independent from each other; therefore, connections and sessions are not kept alive, that is, the recorded response time for each DoT measurement includes the time required for both the TCP and TLS handshakes.
Overall response times

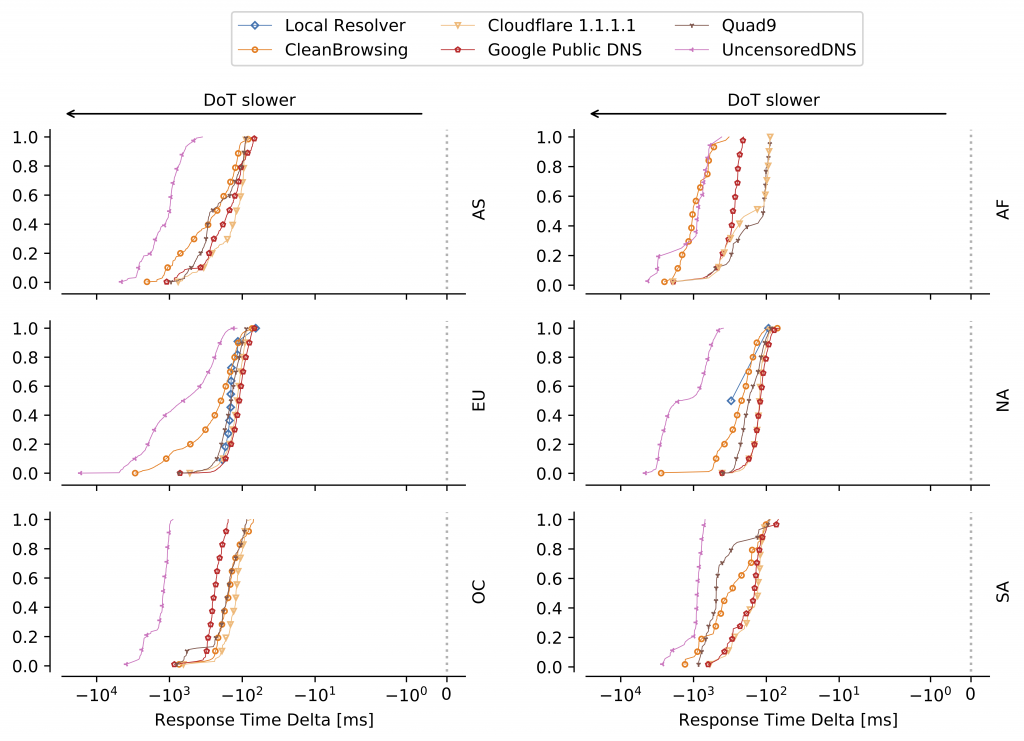
Figure 2 shows that the response times for DoT are higher by more than 100ms for nearly all data points, considering the median response times for Do53 are 10 to 30ms for most resolvers and 130 to 150ms for the faster DoT resolvers. The response time deltas between Do53 and DoT for each (probe, resolver) tuple is shown in Figure 3 for the resolvers that support both protocols, split by continent. As shown, the differences between Do53 and DoT range from (roughly) at least 100ms up to around 1 second for most probes and resolvers, in some cases even several seconds.

Although local resolvers have higher DoT failure rates when compared to public resolvers, the distributions of their DoT response times (median 147ms) are comparable to the ones of the faster public DoT resolvers.
Regional comparison
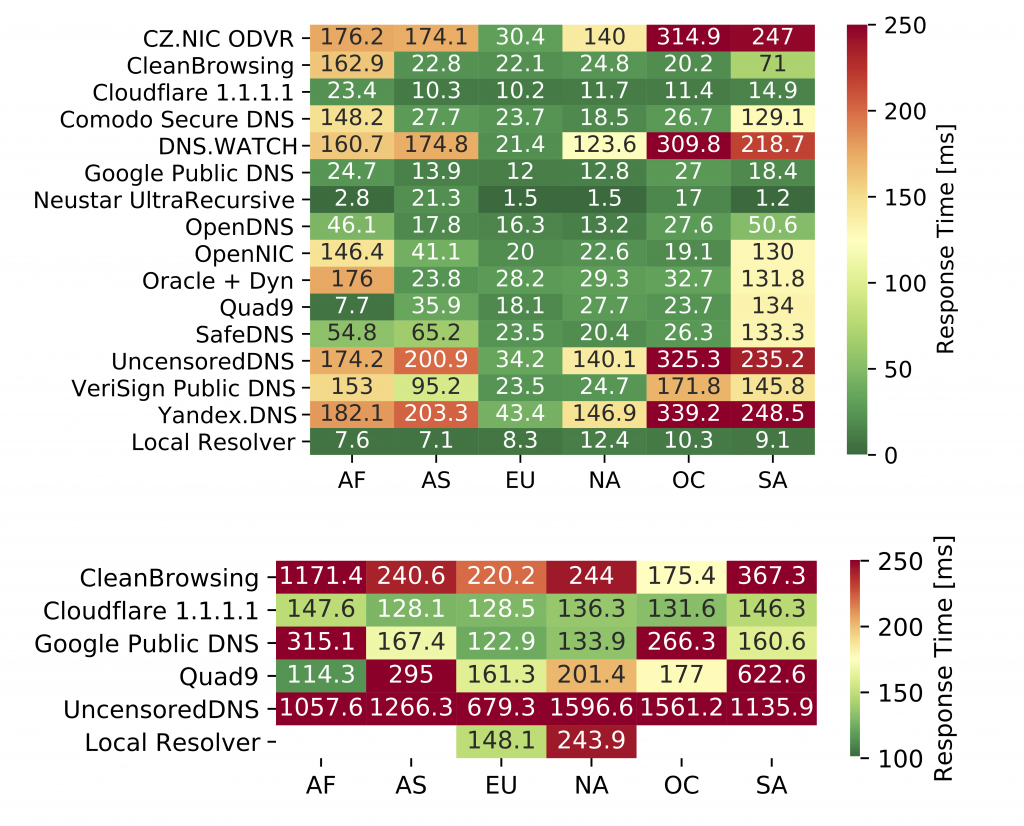
The response times shown in Figure 2 are further split by continent location of the probes. Figure 4 shows the medians of the resulting response times for Do53 (top) and DoT (bottom).
Regarding Do53, probes located in Europe have the lowest delays (at most 43.4ms) for all resolvers. Probes in other continents, namely Africa, Asia, Oceania, and South America have occasionally higher response times, where response times for some resolvers are above 100ms (up to 339.2ms).
When comparing individual resolvers, local resolvers are the fastest with response times of 7.1 to 12.4ms across all continents; samples for Google show comparable measurements (10.2-23.4ms). Other well known resolvers such as Quad9 and Cloudflare are similarly fast and consistent regarding response times across most continents. On the other hand, regional differences are higher for resolvers with fewer points of presents around the globe.
Read: Geoff Huston’s notes on DNS at IETF 110
Considering DoT, differences in response times vary much more between continents in comparison with Do53. Cloudflare is an exception, having the least varying median response times (128.1-147.7ms) across all continents. In contrast, Google exhibits samples in the range of 122.9 to 315.1ms, with particularly high response times in Africa and Oceania. Probes in Europe (148.1ms) and North America (243.9ms) with DoT-supported local resolvers show response times comparable to Cloudflare and Google. In comparison, response times for Quad9 (114.3-622.6ms) and CleanBrowsing (175.4-1,171.4ms) vary more regionally, showing a much higher range regarding response times.

Reliability, response, and adoption
In summary, we present first measurements results on reliability and response times from RIPE Atlas home probes with a focus on comparing Do53 and DoT. With the 90 million collected DNS measurements overall, we highlight issues for RIPE Atlas probes regarding reliability with specific resolvers and regions, and show highly varying response times for DoT, which indicates different stages of DoT adoption across regions and resolvers. We also identify that the adoption of DoT among local probe resolvers is still low.
Given that this article has only provided a brief overview of our measurement study, we invite interested readers to refer to our paper, which covers the discussed results, and more, in greater depth. To facilitate reproducibility, we have also shared all measurement-related material on our GitHub repository. This paper was also presented at the Passive and Active Measurement (PAM) Conference 2021, 29 to 31 March. A video of the conference presentation will be included in the conference’s program page.
Trinh Viet Doan is a PhD Student at the Technical University of Munich. His research interests include Internet measurements as well as consolidation and decentralization of the Internet.
The views expressed by the authors of this blog are their own and do not necessarily reflect the views of APNIC. Please note a Code of Conduct applies to this blog.
