The RIPE NCC recently introduced a new wiki to better document, and understand, complex RIPE Atlas measurements. In this post, they look at documenting measurements created to track RPKI repository performance.
Over the past 10 years, RIPE Atlas has become an important tool in the toolbox of Internet network operators, network researchers, and anybody interested in getting insights on Internet performance.
In RIPE Atlas, you specify a measurement as a set of vantage points (sources) towards a single destination. You can also specify things like the type of measurement (ping, traceroute, and more), the address family (IPv4 or IPv6), and whether you want measurement results once (so called ‘one-off’ measurements) or periodically. Once you submit your specification to the RIPE Atlas system, and have enough RIPE Atlas credits, you get assigned a measurement ID, by which you can find the results of the measurements taken.
This fits very well in the paradigm of measuring a single server periodically from multiple sources, but what if the purpose of your measurement can’t be captured in such a measurement specification?
Measurement bundles
To measure more complex things than a single IP endpoint from multiple sources, you typically must resort to creating multiple measurement specifications. This means your results come spread across multiple measurement IDs, and this can get complex quickly, as you need to keep track of how those different results fit together. And this is even more difficult for others, looking at the same thing as you are looking at, to figure out your measurement results.
One solution RIPE Labs have for this is that you can tag related measurements with measurement tags, so others can find related measurements. But as handy as this can be, I’ve found it doesn’t always do the trick. What I noticed is that when you do something a little bit more complex than setting up a few sources to target a single destination, you have to create many measurement specifications in RIPE Atlas, and there’s no place to write down what you did and why so that others can benefit from what you did and maybe learn from and/or correct mistakes you made.
So — we’re trying out a solution for this! We’ve populated part of our public github pages with a wiki for RIPE Atlas tips and tricks. Part of this wiki is dedicated to what we call measurement bundles. These can be best defined as one or more RIPE Atlas measurement specifications together with a description of what you intended to measure and how you did that. It might also include code, measurement IDs, your reasoning behind particular choices on how you measure, or who is running these measurements (so others can contribute credits!).
An example of a measurement bundle: Measuring RPKI repositories with RIPE Atlas
In a collaboration between NLNetLabs and the RIPE NCC, we are measuring RPKI repositories with RIPE Atlas. NLNetLabs is using these in the JDR RPKI portal. The RIPE Atlas data that is being used is free to access and use by anybody who is interested in the performance of RPKI repositories. Details on how this is measured, the code that generates the measurement specifications, and a list of measurement IDs are all documented in the measurement bundle wiki page for this. Awesome, no?
Read: Introducing JDR: Explore, inspect, and troubleshoot RPKI
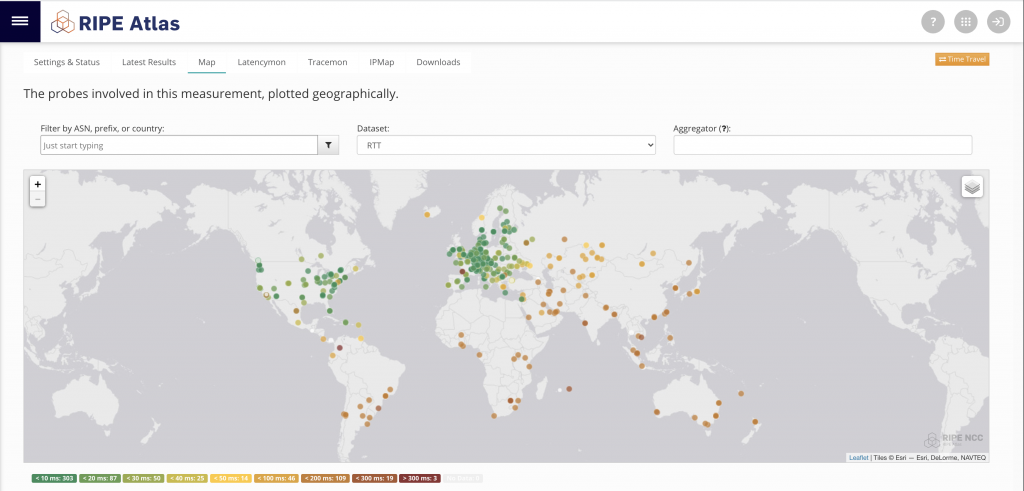
As an example of how this information is useful, we analysed the RPKI RRDP repository that the RIPE NCC hosts in the cloud. Immediately after we started measuring the latency from RIPE Atlas anchors around the world, we noticed that latencies from North American and European RIPE Atlas anchors were very low, while the rest of the world had much higher latencies, as shown in Figure 1.

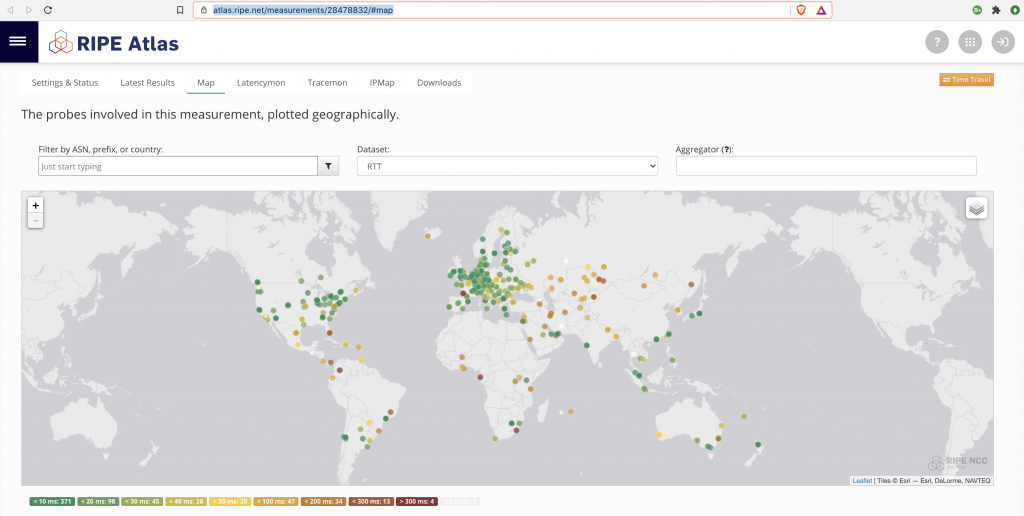
After showing this to the RIPE NCC RPKI team, they re-evaluated the cost-benefit in this aspect of the RRDP cloud deployment and adjusted the settings. Now, the latency from other parts of the world towards the RPKI RRDP repository is significantly lower, as shown in Figure 2.

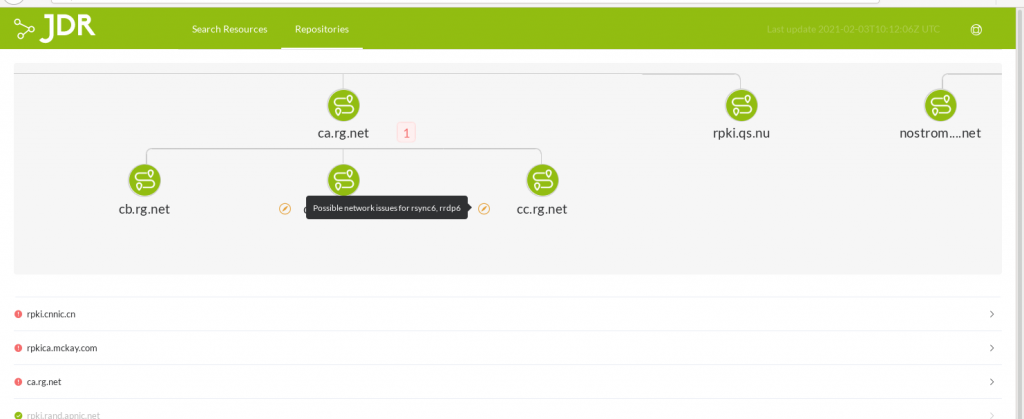
JDR aggregates the most recent measurement results from all the anchors to find possible network related issues, indicated by an icon to the left of a repository name (see Figure 3). The tooltip reveals which of the measured protocols (rsync or RRDP, over IPv6 or IPv4) are responding with either extraordinary high Round Trip Times (RTTs), or do not respond at all. In the particular case shown in Figure 3, we contacted the repository owner, and found out that the high RTTs in IPv6 were due to both a bug and the setup being experimental.

But this is not the only thing one can do with this data. For instance, one can think of a per RIPE Atlas anchor report on latencies to the public RPKI repositories on the Internet. We’d be happy to hear others make use of this data.
Other Examples
There are plenty of examples of RIPE Atlas measurements that are set up that would benefit from better documentation, so we started documenting some. A couple of examples:
- Measuring DNS resolvers with RIPE Atlas — this is also known as the DNSThought project, that originated at the DNS hackathon that the RIPE NCC organised back in 2017
- Topology measurements — this is a type of built-in measurement that is documented, but I found that only after explaining it a bit more, people tend to start to see the value of this. Especially for researchers, this is a treasure trove that many found particularly useful once they discovered it
… but there is way more already! If you have done measurements with RIPE Atlas that you think are useful to document this way, we invite you to do so. It’s a wiki, so you should be able to edit, and add useful documentation there. Please, try it out!
Emile Aben is System Architect and Research Coordinator at the RIPE NCC.
This article originally appeared on RIPE Labs. Jasper den Hertog and Luuk Hendriks contributed to this article.
The views expressed by the authors of this blog are their own and do not necessarily reflect the views of APNIC. Please note a Code of Conduct applies to this blog.
