

The Australian Domain Name Administration, auDA, has published its report for the last quarter of 2020. The report contained the interesting snippet: “The rapid digitization of our lives and economy — necessitated by COVID-19 — continued to underpin strong growth in .au registrations.”
New .au domains created in December 2020 were up 23% from December 2019, while total domains under management were up more than 2.1% over the same period. “We know that in many countries for many forms of work, the conventional office workplace was shut down for much of 2020 and the Internet assumed a critical role for work and play for hundreds of millions of individuals.”
As Nokia Deepfield’s Craig Labowitz reported to NANOG 79 in June 2020, many networks experienced a 30-45% growth in traffic volumes in the year, Content Distribution Networks (CDNs) increased their rate of port turn-ons, and the migration of data and services into the cloud providers increased.
Unsurprisingly, Craig reported increases in daily traffic volumes with longer hold volumes. Video conferences, in particular, increased in volume and weekend peak traffic volumes increased. These two stories are reflections of a common theme that the Internet has been used to plug the gap caused by shutting down many of our physical venues where we worked and played. It seems reasonable to observe that we all made much more use of the Internet in 2020.
What role did IPv6 play in all this?
Measuring Internet growth in 2020
Let’s start with the baseline question: did the Internet itself expand through 2020? And how are we going with IPv6 transition? Was it business as usual for the ongoing IPv6 transition, or were our IPv6 deployment plans placed on hold during the pandemic-induced work disruptions through 2020?
These days they’re hard questions to answer.
A decade ago, in a largely IPv4 Internet, we could assume that most networks used a similar network addressing plan, and expansion of the Internet was matched by an increased use of IP addresses. By tracking the rate of IPv4 address allocations and assignments we could see those parts of the world where Internet deployment was taking place.

Over recent years we’ve largely depleted the pool of unallocated IPv4 addresses, and further growth in network infrastructure is accompanied by more extensive use of IPv4 address sharing technologies with higher-sharing ratios. We’re increasing the utilization efficiency of IPv4 addresses rather than increasing the number of addresses as networks expand.
Read: BGP, RPKI, and MANRS, 2020 in review
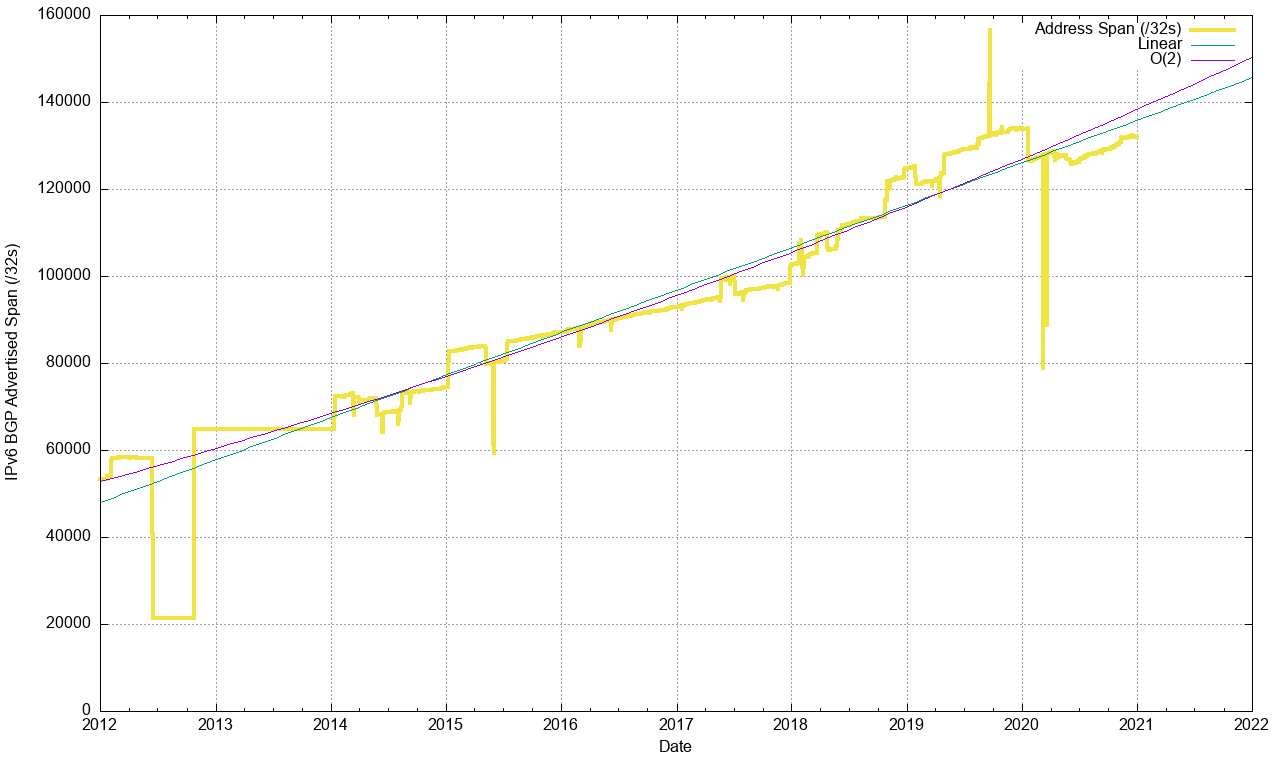
The result is that counting the total span of IPv4 addresses that were announced in the Internet’s routing system during the last three years gives us no clear indicators of network growth, as seen in Figure 1. The address span of the advertised IPv4 network was steady at a total of 2.84B IPv4 addresses at the start of the year and 2.86B addresses at the end of the year. Given the factors of address exhaustion this metric is no longer a good indicator of network expansion.
There are some other metrics that show some level of expansion, such as the number of entries in the global IPv4 routing table, shown in Figure 2, and the number of announced Autonomous System Numbers (ASNs), shown in Figure 3.
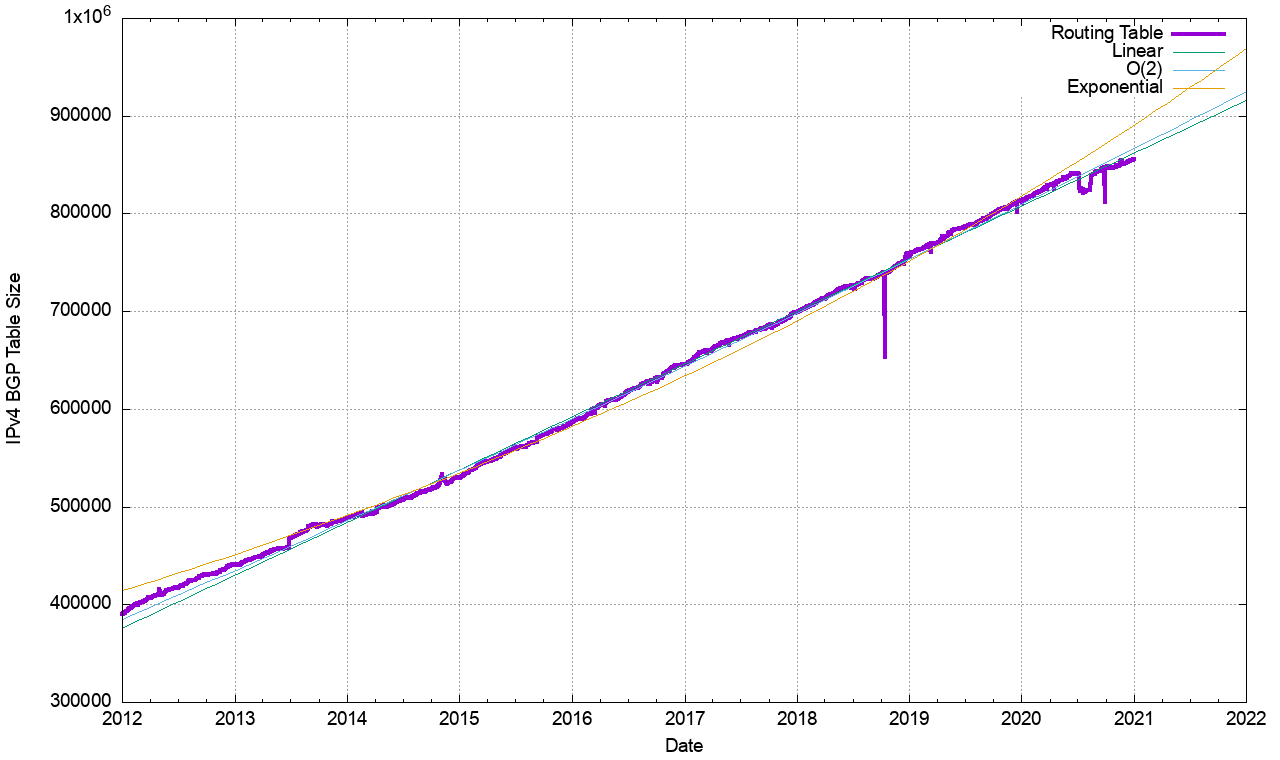
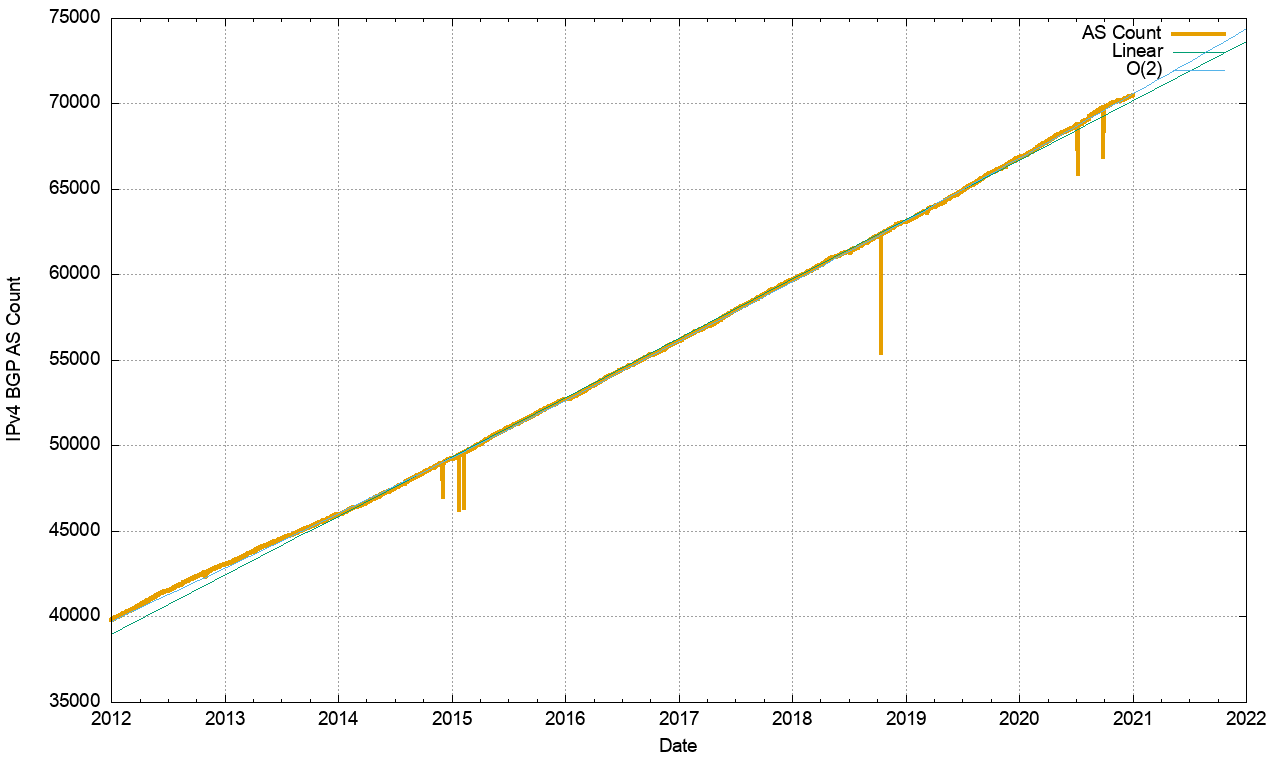
The number of routing tables grew from 814,000 at the start of the year to 860,000 by the end of the year, a growth of 6% across the year. The growth rate was 7% in 2019 and 9% in 2018. In this respect the Internet is still growing, albeit at a declining rate. The number of visible ASNs grew by 3,600 over the year, a growth of 5%. Again, this rate of growth is slightly lower than in previous years. A summary of these metrics of annual change in the IPv4 routing table is shown in Table 1.
| Jan-18 | Jan-19 | Jan-20 | Jan-21 | 2018 | 2019 | 2020 | |
| Prefix count | 699,000 | 760,000 | 814,000 | 860,000 | 9% | 7% | 6% |
| Root prefixes | 328,000 | 353,000 | 387,000 | 400,000 | 8% | 10% | 3% |
| More specs | 371,000 | 407,000 | 427,000 | 460,000 | 10% | 5% | 8% |
| Address span (/8s) | 169 | 169.3 | 169.8 | 171.4 | -1% | 0% | 1% |
| AS count | 59,700 | 63,100 | 66,800 | 70,400 | 6% | 6% | 5% |
| Transit AS | 8,500 | 9,000 | 9,600 | 10,200 | 6% | 7% | 6% |
| Stub AS | 51,200 | 54,100 | 57,200 | 60,200 | 6% | 6% | 5% |
Table 1 — IPv4 BGP table growth profile.
It appears that the drivers for growth in the IPv4 BGP network in 2020 are now quite modest and sit only slightly above population growth factors in many regions of the world. We are probably seeing several factors at play:
- The saturation of many Internet markets, so that the amount of ‘green field’ expansion is far lower than a decade ago
- Considerable concentration on the service market, where the level of utilization of addresses is vastly greater by both content and service publishers and by end clients. The service and client numbers may be growing, but that does not necessarily imply the use of more addresses, or more routing table entries
- This concentration in the service market has been accompanied by further consolidation in the access market, particularly in mobile access networks. This consolidation of client access networks creates greater efficiencies in shared address solutions.
It is not clear that the pandemic has had any impact on these growth factors for the IPv4 network.
From these figures it’s reasonable to conclude that while our use of the network may have increased considerably throughout the year as a result of various responses to the pandemic situation, the network’s size in terms of the number of users and span of the network has increased at a rate that is commensurate with previous years.
IPv6 address use
Does the same conclusion regarding network growth hold when we look at comparable metrics for the IPv6 network? To what extent was the momentum of IPv6 deployment impacted by the pandemic.
There are no address sharing factors in the IPv6 network, so there is still a reasonable correlation between advertised address span and network size. In terms of the total span of advertised addresses, the IPv6 Internet shrank by the equivalent of 2,000 /32 prefixes through 2020, as seen in Figure 4.
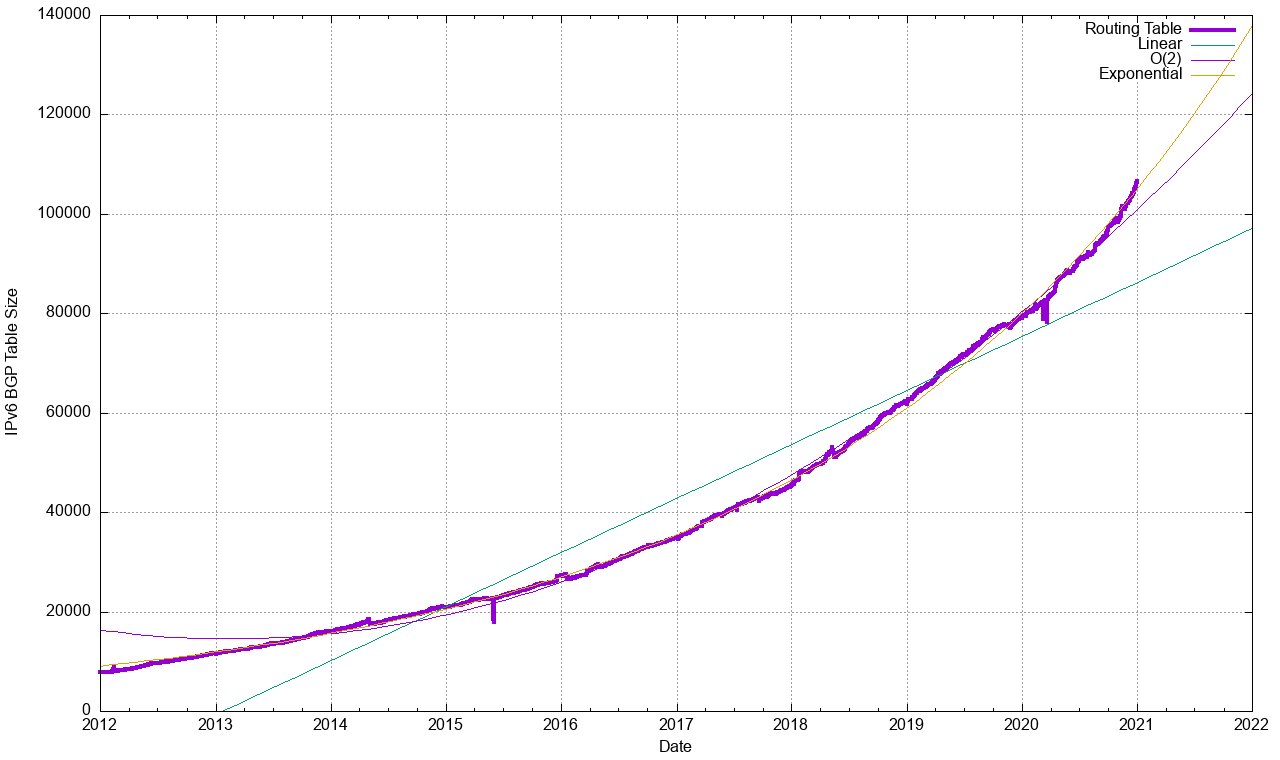
The number of entries in the IPv6 routing table continued to grow, and the eight-year data set still fits within an exponential data model, with a doubling interval every 30 months. Some 25,000 route entries were added to the IPv6 table over the course of 2020, shown in Figure 5.
That was the withdrawal of the prefix
2a01:c000::/19 on 22 January, announced by AS5511, the transit backbone network operated by France Telecom.
The IPv6 ASN count is also rising (shown in Figure 6), although the growth trend is not an exponential growth model. It appears that the trend is closer to an O(2) polynomial function.
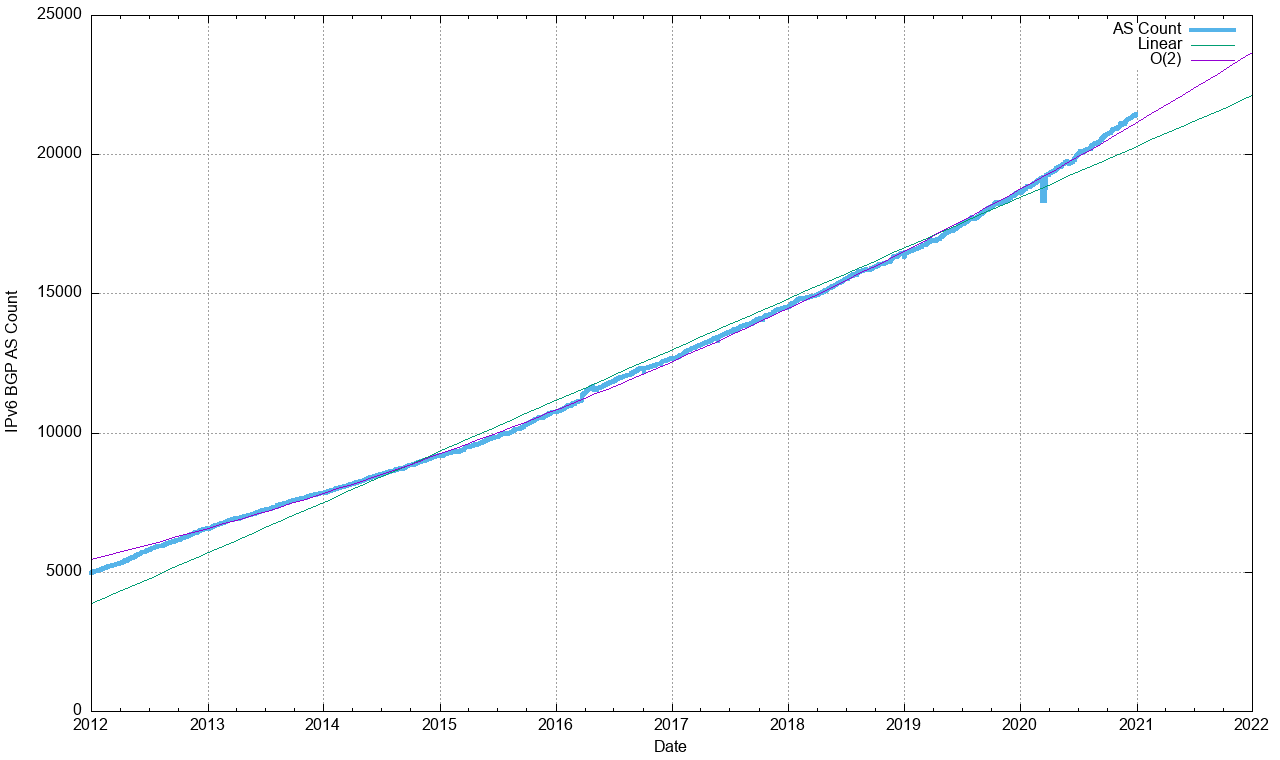
Again, we can summarize the essential statistics of the routed IPv6 network, as shown in Table 2. This table has a number of apparently contradictory signals. The address span fell over 2020, although a major contribution here was the withdrawal of a single /19 route early on in the year. The prefix count grew by 33%, although the table shows that a major component of this growth was the increasing use of more specific route advertisements in the IPv6 network. The growth in root prefixes is a more constrained growth of 16%, which is of a similar size to the growth rate in the ASN count.
This leads to a reasonable estimate of the growth of the IPv6 network of 15% over 2020, which is either comparable or slightly lower than the growth levels of the prior two years. This is double the growth estimates for IPv4, indicating that the work in converting single-stack IPv4 networks to dual-stack networks continued through 2020, possibly at a slightly lower rate than 2018 and 2019, but continuing in any case.
| Jan-18 | Jan-19 | Jan-20 | Jan-21 | 2018 | 2019 | 2020 | |
| Prefix count | 45,700 | 62,400 | 79,400 | 105,500 | 37% | 27% | 33% |
| Root prefixes | 28,200 | 35,400 | 42,300 | 49,200 | 26% | 19% | 16% |
| More specifics | 17,500 | 27,000 | 37,100 | 56,300 | 54% | 37% | 52% |
| Address span (/32s) | 102,700 | 124,900 | 133,800 | 132,000 | 22% | 7% | -1% |
| AS count | 14,500 | 16,470 | 18,650 | 21,400 | 14% | 13% | 15% |
| Transit AS count | 2,600 | 3,190 | 3,590 | 4,100 | 23% | 13% | 14% |
| Stub AS count | 11,900 | 13,280 | 15,600 | 17,300 | 12% | 13% | 15% |
Table 2 — IPv6 BGP table growth profile.
Counting IPv6 users
A very different view of the IPv6 network can be seen by a process of continual estimation of the number of users who can use IPv6. Firstly, let’s look at the use numbers for the same period as the previous three figures, from the start of 2012 through to the end of 2020. See Figure 7.
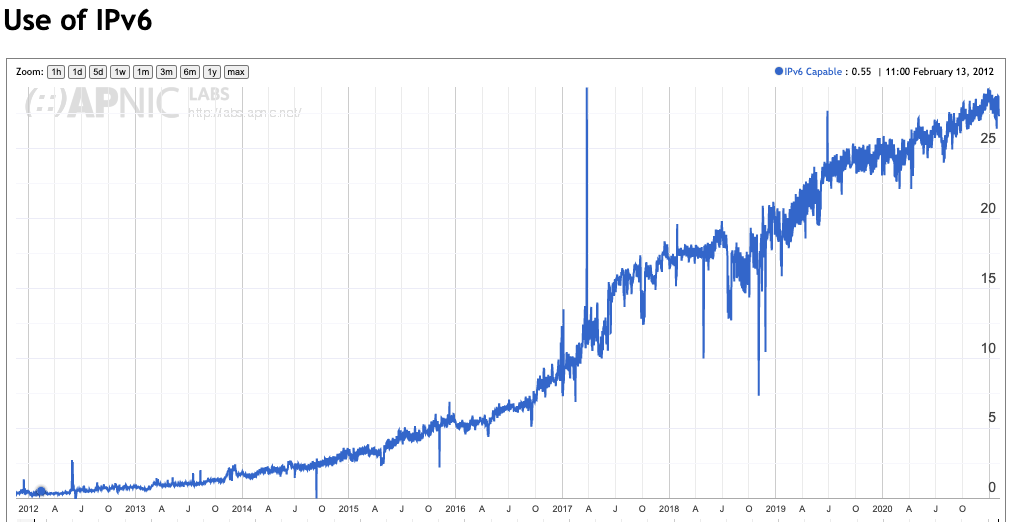
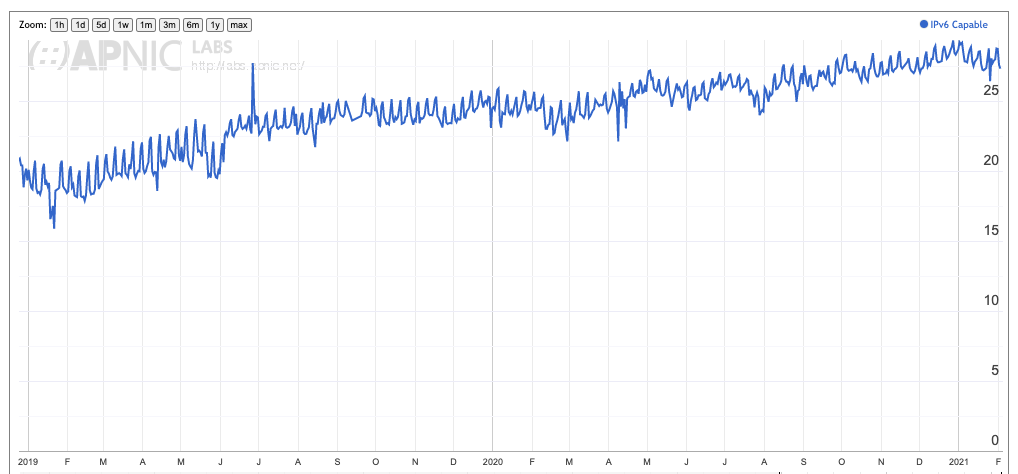
The use-level at the start of 2012 was 0.3% and 28% at the end of 2020, a growth factor of 100 over the period, which is larger than any of the basic network infrastructure metrics. It’s also evident that the uptake of IPv6 has not been even over this period. The large-scale IPv6 deployment in India by Reliance Jio had a marked impact on the statistics, as had the initial large-scale IPv6 deployment in China. Figure 8 takes a more recent view, looking at the past 24 months.
In 2019, the overall growth of IPv6 users was from 18% at the start of 2019 to 24% at the end of that year, or a net growth of 6%. In 2020, the net growth was just 3%, to 27% of users by the end of the year. This implies that for the Internet as a whole, the growth of IPv6 within the Internet halved in 2020. While the level of IPv6 network infrastructure has grown by around 15%, the rate of user uptake of IPv6 in 2020 has lagged the progress of infrastructure provision activities.
Global averages mask a far more diverse set of details when we look more closely at the level of IPv6 update within various economies. The overall result in terms of the world map of IPv6 usage for each economy is shown in Figure 9.
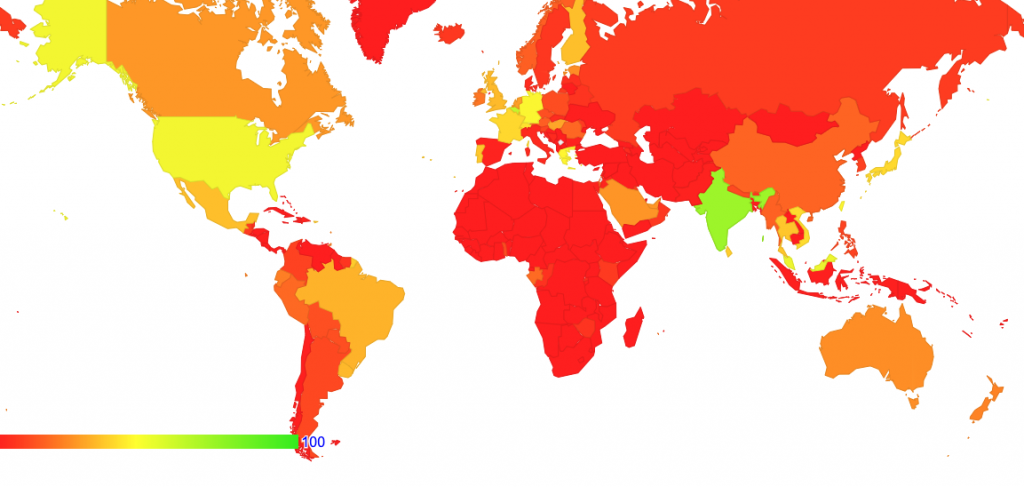
These days, there are now significant deployments of IPv6 in South Asia, complementing earlier deployment efforts in the Americas and Western Europe. There is still a low level of IPv6 use in Africa, the Middle East, Western Asia, and Eastern Europe.
We can measure the extent to which recent (the past 24 months) activity has made a visible impact in the use of IPv6 in various economies. Table 3 contains a list of the top 25 economies where the rate of IPv6 use has increased the most in the 24 months from the start of 2019 to the end of 2020, showing the 24-month rate of increase of IPv6 penetration in those economies as a percent of the total user population.
| Rank | Change (%) | CC | Name |
| 1 | 62.90% | YT | Mayotte |
| 2 | 42.20% | GF | French Guiana |
| 3 | 29.50% | LK | Sri Lanka |
| 4 | 29.00% | AE | United Arab Emirates |
| 5 | 28.60% | PR | Puerto Rico |
| 6 | 24.50% | MQ | Martinique |
| 7 | 24.00% | GP | Guadeloupe |
| 8 | 23.70% | PT | Portugal |
| 9 | 22.60% | FR | France |
| 10 | 21.30% | RE | Reunion |
| 11 | 20.80% | CH | Switzerland |
| 12 | 20.50% | MY | Malaysia |
| 13 | 20.00% | SA | Saudi Arabia |
| 14 | 19.40% | TW | Taiwan |
| 15 | 19.00% | IN | India |
| 16 | 18.80% | MM | Myanmar |
| 17 | 18.40% | NL | Netherlands |
| 18 | 17.90% | VN | Viet Nam |
| 19 | 17.20% | GA | Gabon |
| 20 | 17.10% | GR | Greece |
| 21 | 16.30% | LU | Luxembourg |
| 22 | 16.00% | MX | Mexico |
| 23 | 15.90% | TH | Thailand |
| 24 | 15.30% | AU | Australia |
| 25 | 14.80% | HU | Hungary |
Table 3 — Top 25 economies with 24-month IPv6 relative usage growth.
Table 3 shows the change within each economy, without regard to the number of users within that economy. This table indicates that while the overall net growth of users in this 24-month period was just 9% across the entire Internet, some ISPs in various economies undertook a much more concerted effort to extend IPv6 services to their user base, notwithstanding the larger picture of the impact of the pandemic response measures within those economies.
Read: Geoff Huston on Addressing 2020
Relative percentages can be misleading, however.
Obviously, the 19% growth in IPv6 use in India has involved many tens of millions of users (India has an estimated 600M Internet users), while the larger relative uptake levels in Mayotte (150,000 users in total) or Guadeloupe (220,000 users) involve a much smaller number of users. We can take these relative percentages of use and combine them with the ITU-T reports of the number of users in each economy to derive a report of the number of IPv6 users in each economy. The picture of change in the total number of IPv6 users within each economy over the past 24 months is shown in Table 4.
| Rank | Change (Users) | CC | Name |
| 1 | 161,568,317 | IN | India |
| 2 | 118,082,098 | CN | China |
| 3 | 21,193,448 | MX | Mexico |
| 4 | 17,745,200 | BR | Brazil |
| 5 | 15,836,329 | JP | Japan |
| 6 | 11,557,854 | FR | France |
| 7 | 10,430,694 | TH | Thailand |
| 8 | 10,146,466 | VN | Viet Nam |
| 9 | 9,159,114 | PH | Philippines |
| 10 | 8,357,617 | RU | Russian Federation |
| 11 | 8,276,402 | DE | Germany |
| 12 | 7,528,603 | MY | Malaysia |
| 13 | 7,437,879 | SA | Saudi Arabia |
| 14 | 7,038,298 | TW | Taiwan |
| 15 | 6,755,156 | GB | United Kingdom |
| 16 | 3,944,296 | MM | Myanmar |
| 17 | 3,827,137 | CO | Colombia |
| 18 | 3,535,571 | AU | Australia |
| 19 | 3,161,705 | CA | Canada |
| 20 | 3,042,160 | NL | Netherlands |
| 21 | 2,860,177 | AE | United Arab Emirates |
| 22 | 2,580,194 | LK | Sri Lanka |
| 23 | 2,569,302 | AR | Argentina |
| 24 | 2,069,825 | CH | Switzerland |
| 25 | 2,065,010 | PT | Portugal |
Table 4 — Top 25 economies with 24-month IPv6 user growth.
From this view, the role of India and China in IPv6 over the past 24 months stands out clearly. These two economies account for some 380M new IPv6 users, out of a total of 469M new IPv6 users for the Internet as a whole.
We are now getting closer to observing the impact of the pandemic on this activity over 2020. There were some 332M users added to the IPv6 Internet in 2019 and 137M in 2020. The breakdown of where the growth in IPv6 occurred in 2019 as compared to 2020 is shown in Table 5.
| 1 | 116,325,484 | IN | India | 1 | 45,242,832 | IN | India | |
| 2 | 86,940,479 | CN | China | 2 | 31,141,618 | CN | China | |
| 3 | 15,327,609 | MX | Mexico | 3 | 8,965,146 | JP | Japan | |
| 4 | 11,675,636 | BR | Brazil | 4 | 7,025,651 | PH | Philippines | |
| 5 | 8,639,833 | FR | France | 5 | 6,069,563 | BR | Brazil | |
| 6 | 7,886,964 | VN | Vietnam | 6 | 5,865,839 | MX | Mexico | |
| 7 | 6,871,182 | JP | Japan | 7 | 5,189,741 | SA | Saudi Arabia | |
| 8 | 6,194,110 | TH | Thailand | 8 | 4,236,583 | TH | Thailand | |
| 9 | 6,054,944 | DE | Germany | 9 | 3,364,356 | CO | Colombia | |
| 10 | 6,031,053 | RU | Russian Federation | 10 | 2,918,021 | FR | France | |
| 11 | 5,527,902 | MY | Malaysia | 11 | 2,326,564 | RU | Russian Federation | |
| 12 | 5,468,095 | TW | Taiwan | 12 | 2,259,501 | VN | Viet Nam | |
| 13 | 4,598,096 | EG | Egypt | 13 | 2,221,458 | DE | Germany | |
| 14 | 4,535,566 | GB | United Kingdom | 14 | 2,219,589 | GB | United Kingdom | |
| 15 | 3,702,037 | KR | South Korea | 15 | 2,000,701 | MY | Malaysia | |
| 16 | 2,983,059 | AU | Australia | 16 | 1,805,800 | EC | Ecuador | |
| 17 | 2,555,954 | AE | United Arab Emirates | 17 | 1,725,361 | MM | Myanmar | |
| 18 | 2,301,239 | CA | Canada | 18 | 1,570,202 | TW | Taiwan | |
| 19 | 2,248,138 | SA | Saudi Arabia | 19 | 1,527,311 | AR | Argentina | |
| 20 | 2,218,934 | MM | Myanmar | 20 | 1,282,057 | LK | Sri Lanka | |
| 332,426,386 | TOTAL | 137,997,495 | TOTAL |
Table 5 — Comparing 2019 growth to 2020 growth.
Within these two lists there are a small number of economies where IPv6 deployment in 2020 exceeded the 2019 levels. In most cases the deployment slowed down in 2020, with the exception of the Philippines, Saudi Arabia, Thailand, Colombia, Ecuador, Argentina and Sri Lanka in this list. We can further break this down into a month-by-month change across 2020, tracking the five largest national deployments, shown in Figure 10.
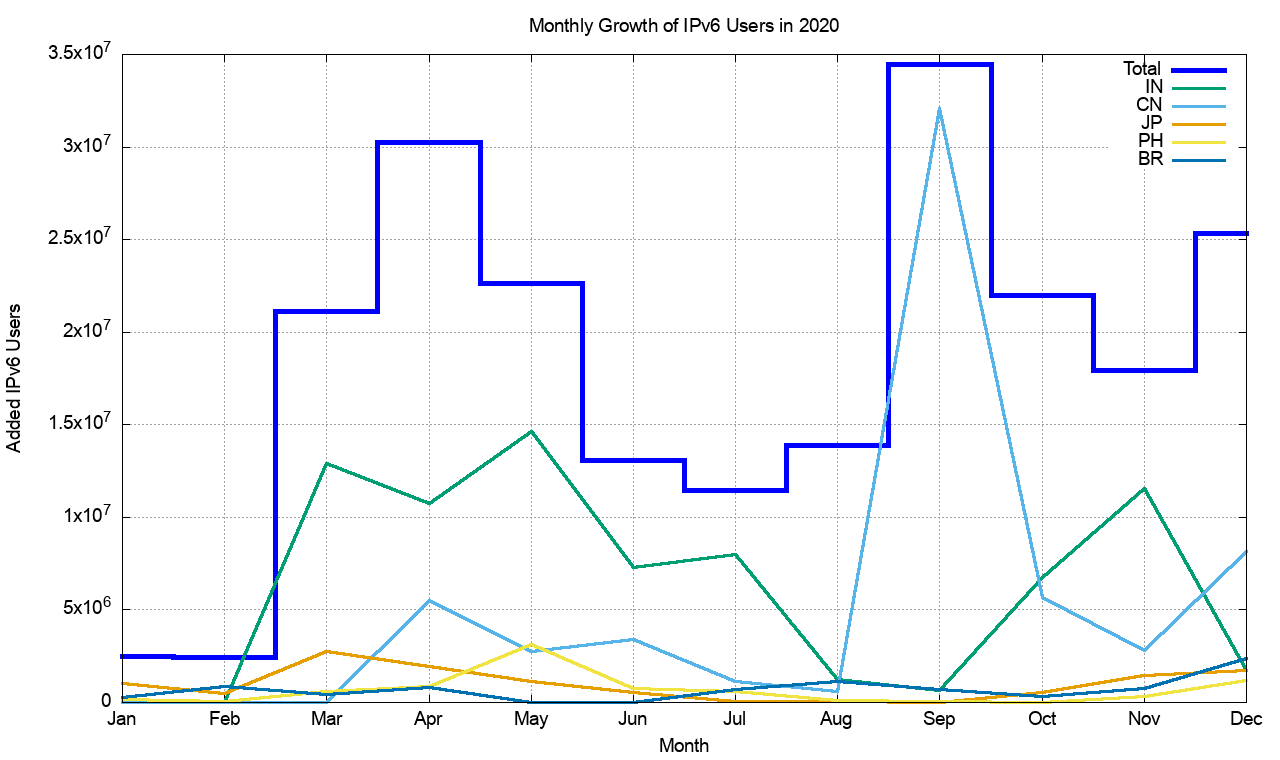
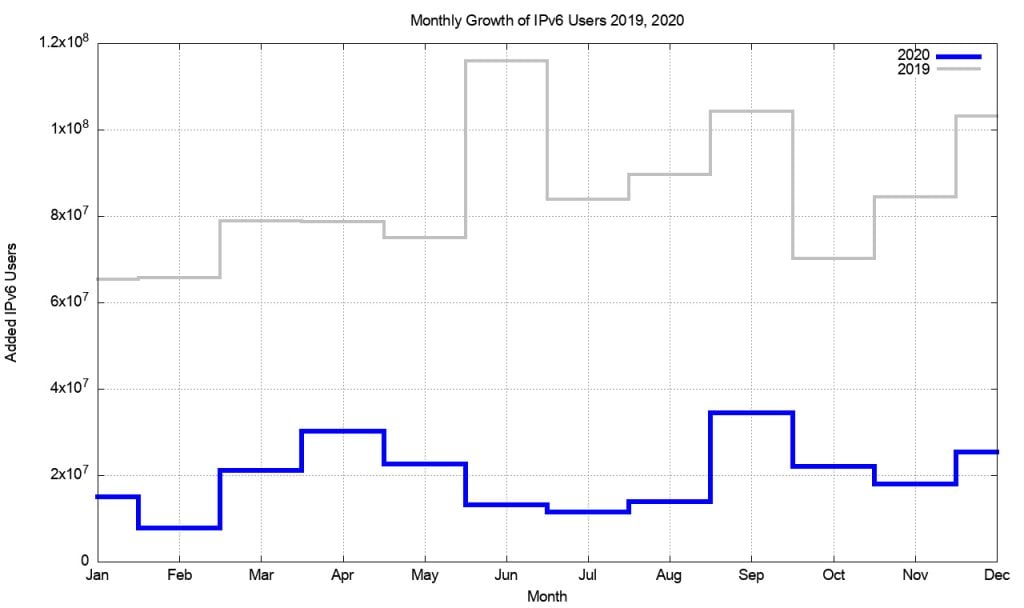
India’s growth occurred in the first half of the year, while China’s effort took place in the third quarter. Overall, the most active months were April and September according to the measurement data. This is a major change from 2019, where June 2019 saw the highest growth in the number of users, shown in Figure 11, and the monthly growth rates were consistently double or triple the monthly growth rates seen across 2020. It is evident that the pandemic had an impact across the entirety of 2020.
The bigger picture on IPv6 transition
At this point it probably makes sense to remind ourselves precisely what we are trying to achieve here. What we’ve been doing for the past two decades, namely building a dual-stack Internet, is not, in fact, the intended outcome.
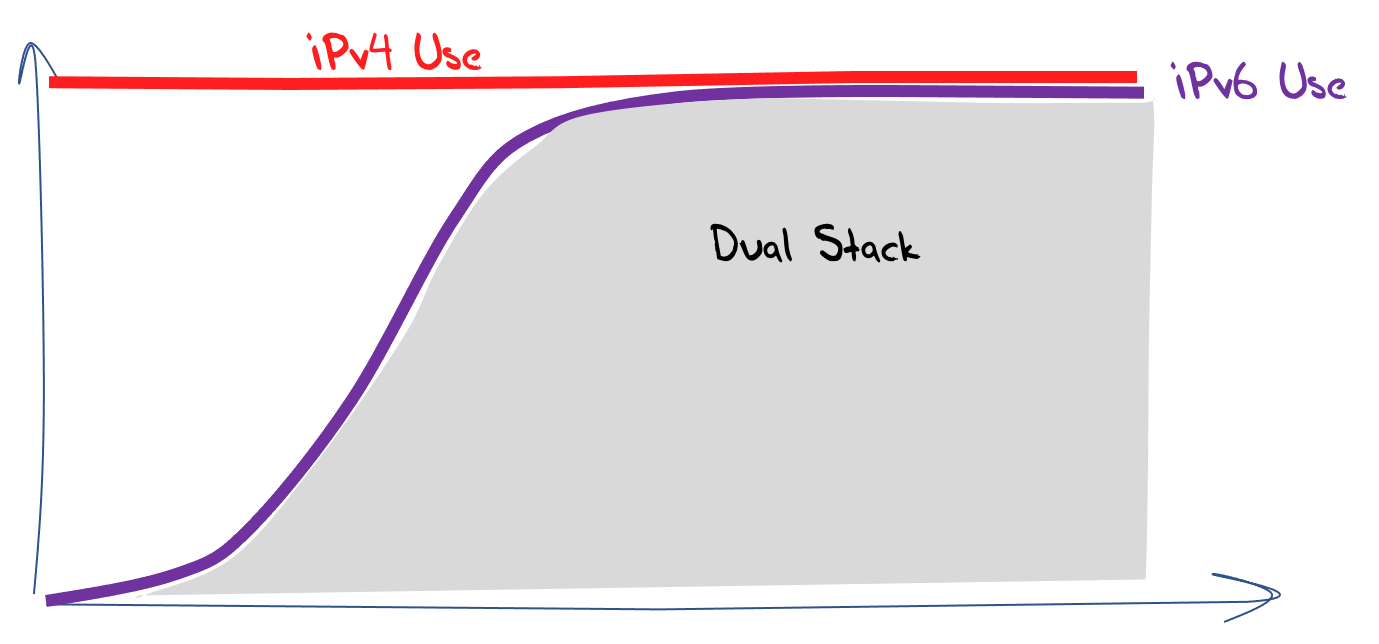
The objective, of course, is to get to the point where the decline in the use of IPv4 has passed its own tipping point. At that point what’s left is an IPv6 Internet.
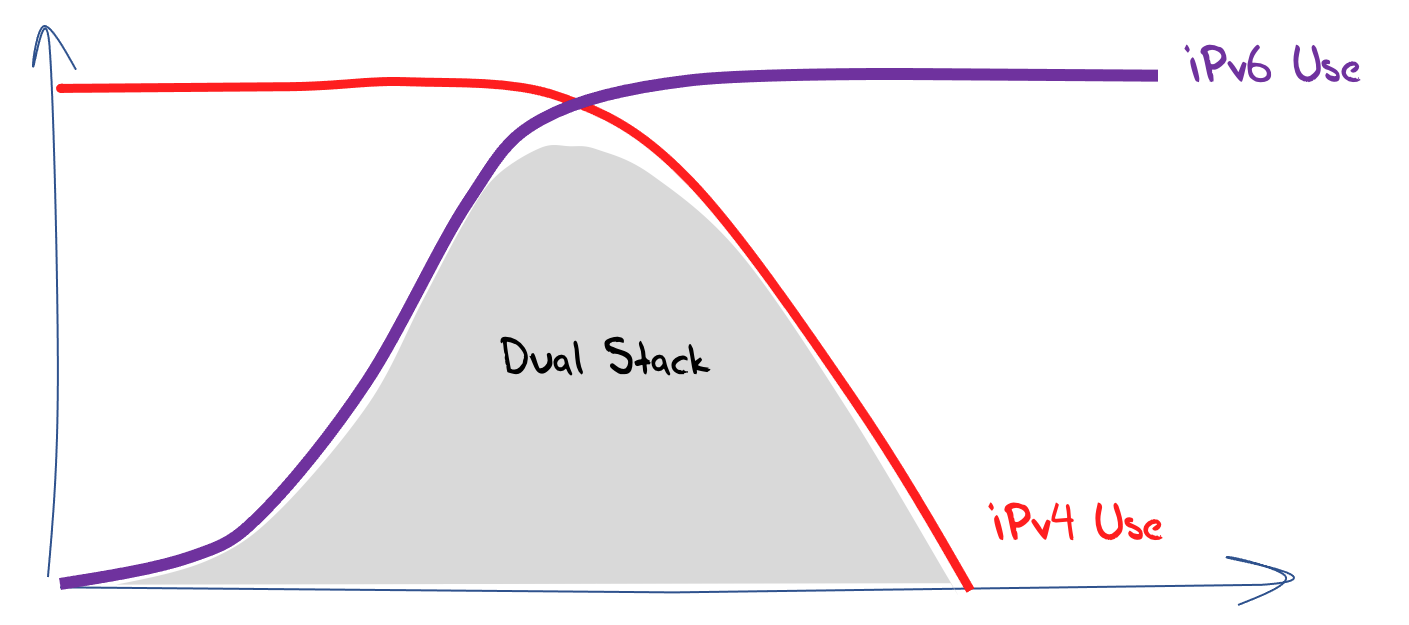
We can now superimpose the existing data relating to the progress of user adoption of IPv6 in the dual-stack environment.
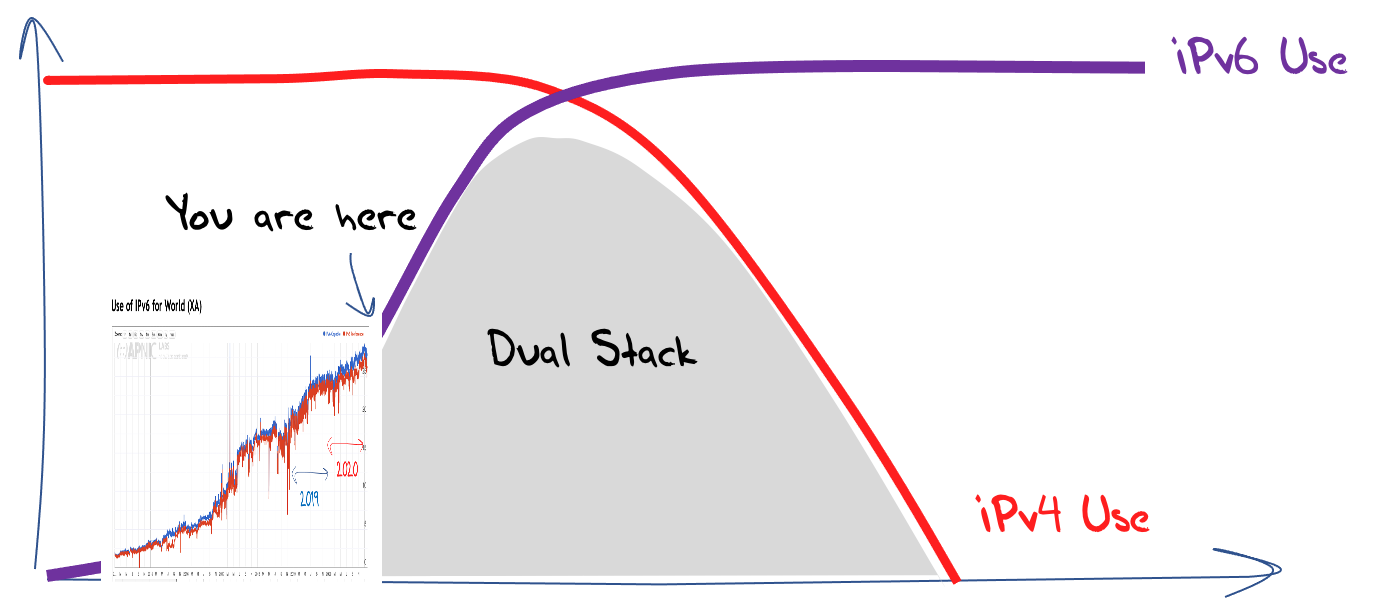
Is our trajectory to an IPv6 Internet an assured outcome now that the penetration level of IPv6 is approaching 30% of the Internet’s user base? Or are we yet to get to that tipping point?
Any new technology goes through several phases on the path to adoption. While the initial phase is driven by enthusiasts, subsequent expansion of the market requires investment and the second phase is often supported by the actions of entrepreneurs, who generally have a higher tolerance of risk than the mainstream market.
At this stage there is often an inflection point where the handover from the early adopters to mainstream may or may not succeed. The mainstream market typically needs to identify some opportunity in the technology; whether it’s cheaper, disruptive to incumbents, desired by consumer motivations or similar market incentives in order to drive the next wave of investment in adoption of this technology.
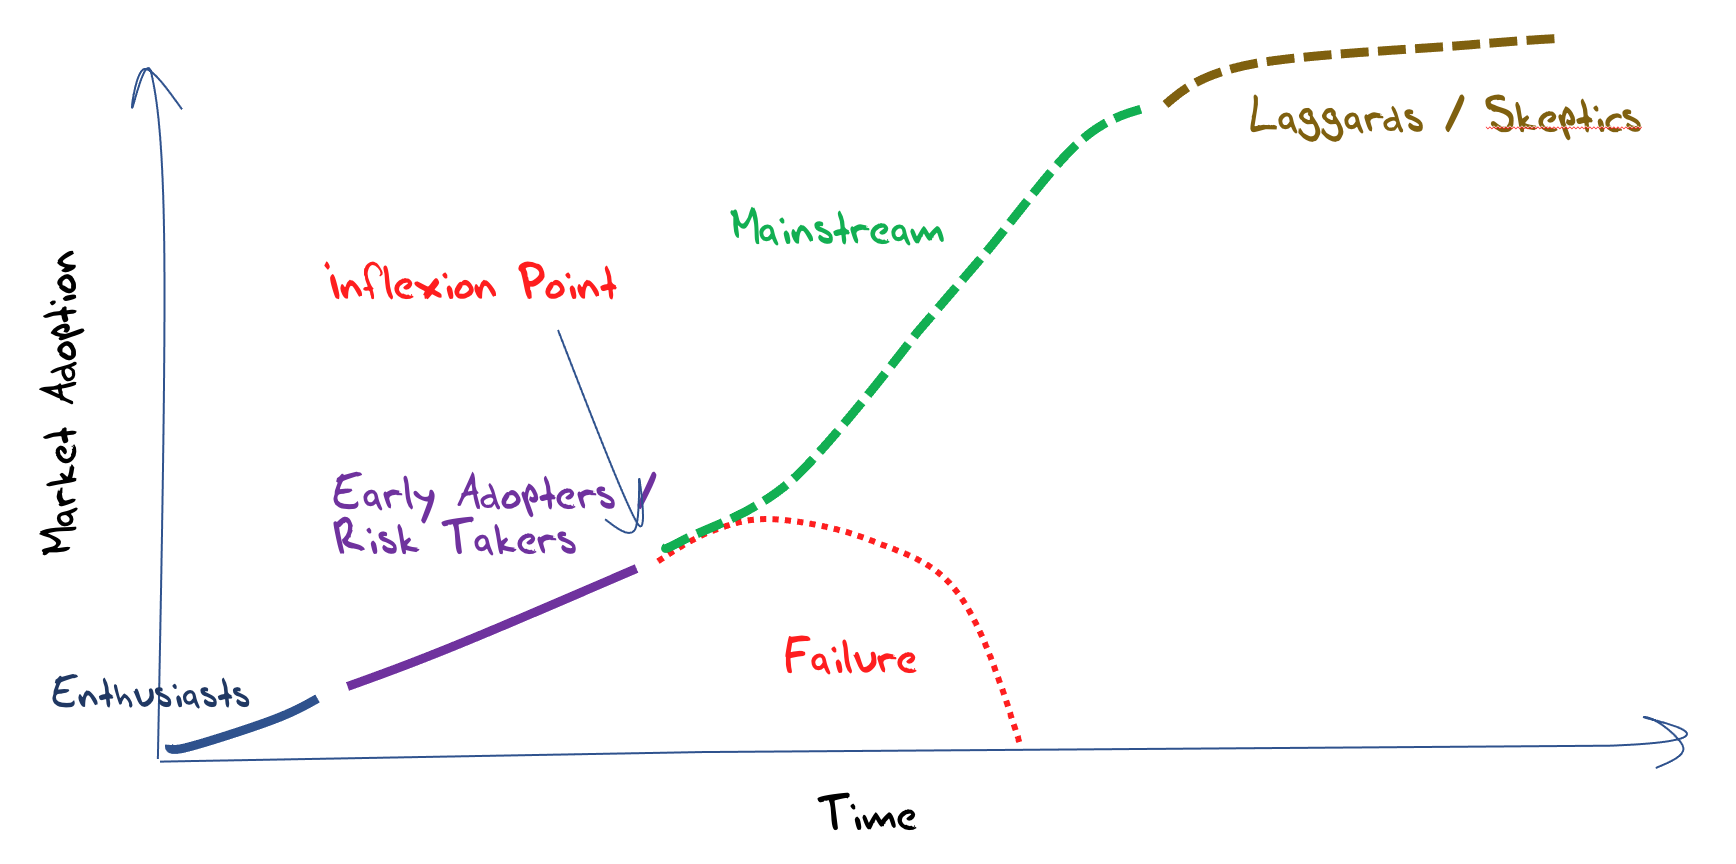
The underlying question here is where are we on this adoption path? It could be that the inflection point for IPv6 adoption came and went some years ago, and IPv6 is now on a mainstream technology adoption curve. Given that adoption now encompasses some 30% of the Internet’s user base, this seems like a very reasonable interpretation of the data so far.
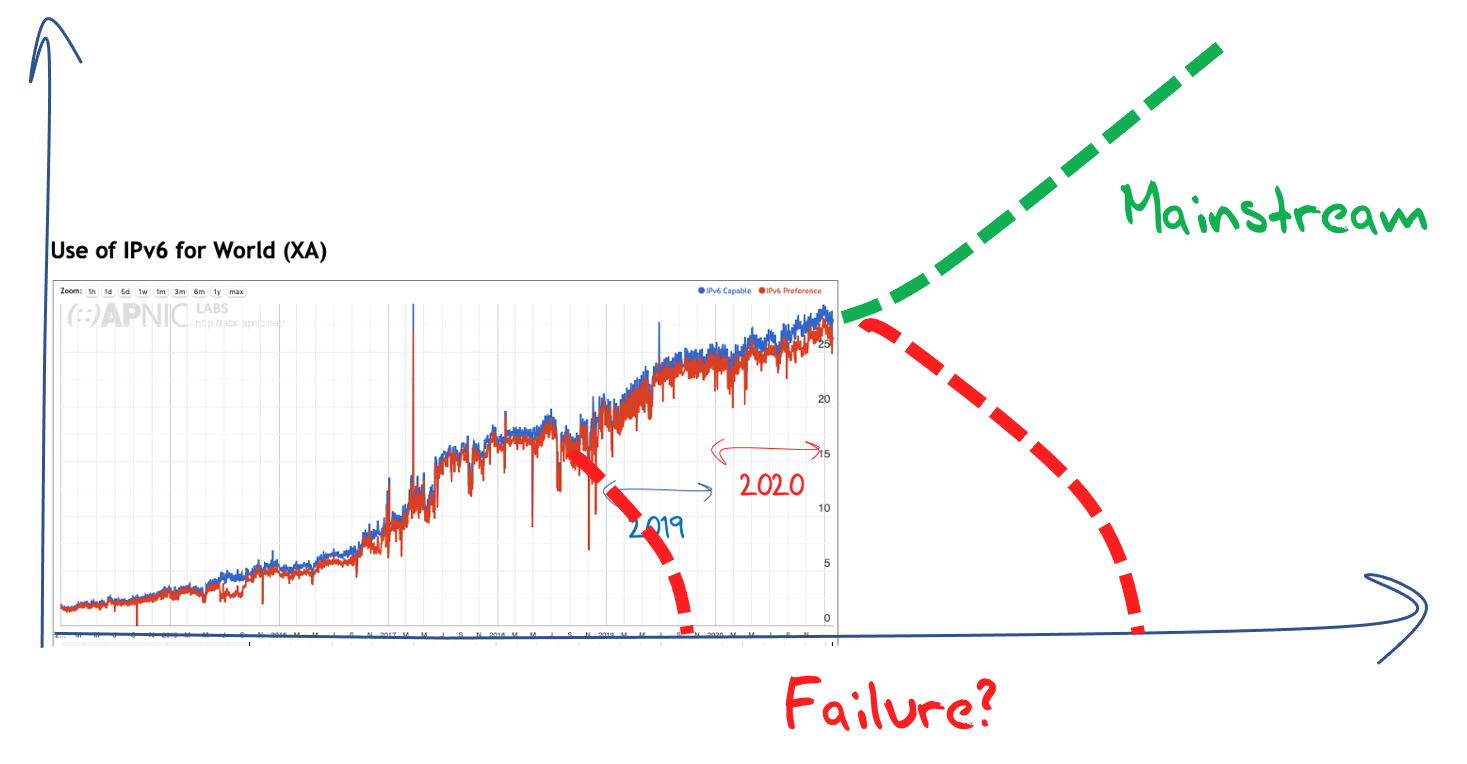
However, mainstream adoption often gathers momentum as it proceeds. If the decision to adopt makes sense for one mainstream provider, then the factors behind such a decision are similar for many, if not all, such providers. That would imply that a characteristic of mainstream adoption is some form of an exponential growth curve, where the momentum of adoption continues to increase in pace right up to the point of effective market saturation.
But that’s not what we see with IPv6 adoption. While there were the beginnings of strong growth in IPv6 adoption in what was visible in 2017, and again in 2019, in both cases the efforts failed to gather sustained momentum. That would imply that we have yet to reach an inflection point for IPv6 adoption and, despite the now solid adoption numbers, there is still some uncertainty as to the ultimate outcomes of this adoption effort.
This might seem to be a perverse interpretation of the data, but there are some factors that support such a conclusion.
IPv6 is an instance of a network protocol that supports a peer network service model. That may have been the case for the mainframe computer networks of the 1970’s and early 1980’s, but the migration to client/server service models has changed all of this. These days, clients talk to servers — not each other.
Furthermore, with anycast and related service and content duplication now the dominant service model, ‘the Internet’ is best seen as a collection of CDN service cones. The backend service networks that prime these CDNs are private, not public, so the Internet as a public communications substrate is simply a disjointed collection of networks that use a common network protocol. IPv4 and NATs can service the needs of such a network quite readily, so what we are seeing is the technology drivers for IPv6, related to IPv4 address exhaustion, lessening in their criticality and the service environments that continue to operate in an IPv4-only mode are not suffering an adverse reaction from the market.
It is an interesting topic of speculation to think about what form of network architecture would be adopted were we to start afresh in today’s world of massive replication of content and service.
Like the ‘clean slate’ discussions of over a decade ago, if we were to think about today’s world without inherent assumptions based on unicast models of networks largely derived from the telephony service model, and we were to think about the network architecture in massively replicated service terms more like the publication or retail worlds, we probably would not have come up with a design that had much, if anything, in common with IPv4. It would certainly not look like IPv6.
When I look at the extensive current efforts to add an overlay of service selection functionality into the DNS, my suspicion is that a similar network design exercise to the one that resulted in the specification of IPv6 some thirty years ago would likely take an entirely different direction.
My view is that we would start such a design exercise with the functions that are currently embedded in the DNS. The implication is that if the inflection point for IPv6 adoption still lies in the future, then the alternate path for the market to follow is not necessarily just remaining with IPv4, but one that heads into a technology architecture based around access to replicated service and content delivery points.
The inflection point we might be looking at in the future for IPv6 adoption is not necessarily one between versions of the IP architecture, but between this IP network-level service and one that concentrates the efficient delivery of massively replicated services and content.
It appears the tension between these two approaches is between a conventional model of destination endpoint address-based networking and networking based on service and content identities. Maybe the alternate future of the Internet will be based on some form of what we’ve come to call name-based networking.
The views expressed by the authors of this blog are their own and do not necessarily reflect the views of APNIC. Please note a Code of Conduct applies to this blog.
Very interesting article. Good questions raised. I really appreciate the guidance on how certain statistics can be misleading.
P.S. I think the labels for the line colors (2019 & 2020) are reversed in figure 11.
Thanks for the heads up Scott. It’s now fixed.
Is there any 2020 data available for the handshake failure rate of TCP? Does TCP still have a large inferior reliability over v6 relative to v4?
I’d also be curious to know about the growth of v6 on the content provider side, and how that impacts overall deployment. I took a quick look at the top 50 websites on Alexa, and found 18 of them (36%) had quad-A records. Most of the ones that didn’t were Chinese sites, but there were a few surprises. Twitter, Reddit, and Amazon don’t have any quad-A records. Yahoo has them in America but not in Japan.
I think there won’t be any strong incentive for more v4-only networks to deploy v6 and get it working reliably until there is a good amount of desirable content that is unreachable on v4. Maybe if some large content providers like YouTube and Netflix were to announce a v4 switch-off date that isn’t too far in the future, it might incite the panic needed to get the stubborn holdouts to deploy v6.
Yes Rich, and thanks for your question and comment.
There is continuous reporting of IPv6 connection failure at https://stats.labs.apnic.net/v6perf/XA?c=XA&x=1&r=1&s=0&g=0&t=1&s=1&f=1&w=30&d=now&t=1. The data shows that it was worse in 2020 over 2019, but it has improved in the early months of 2021.
There is a tension between content and clients. As long as clients can use IPv4 to access all content then the incentives for client networks to adopt IPv6 are not as high as it would be if there was client-desired content only on IPv6. So client networks feel little user level demand to head to dual stack, let alone IPv6 only. But the same holds for content. While all clients can access content over IPv4 the incentives for content to move to IPv6 in their service platforms are not that high. But content will always lag clients, as content cares about client access to their service (its revenue) and the address demands for content are not all that high. So (imho) content will not jump first. Client networks feel the more acute pangs of network exhaustion, but frankly IPv6 doesn’t help unless there is a lot of content on IPv6 already, so that client access using IPv6 will relieve pressure on NAT capacity. All well and good but how can a client access network signal to a content distribution network that it has an economic interest in seeing the content network adopt IP6? In markets such as this where cost and benefit are misaligned we get poor outcomes., such as is the case in this protracted IPv6 transition.
My prediction is IPv4 with NAT444 will continue for another 10 years+. And 80% of chance I still use IPv4 till I die.
In my view, IPv6 ecosystem has it issues. It is very unfriendly to normal users.
IPv4 has an addressing space of 4B. If 8-bit is steal from UDP/TCP by NAPT, the address space becomes 1000B. That would be enough for 7.9B population worldwide. You just need 1 TCP or UDP session to watch youtube video.
The use of IPinIP (VPN), anycast CDN, IOT gateway would address the IP shortage issue.
20 years ago, some one said IPv6 was a must for mobile. However, still IPv4 survives with NAT44 in mobile space.