
In 2020, the Internet was a lifeline for many people across the world as COVID-19 shifted schools and businesses online. It was only logical then that we would see an increase in Internet usage across the globe. As Fastly highlighted in this blog post, the global rise in Internet demand was indeed dramatic.
| Economy | Traffic change | Download speed change |
| France | ↑ 38.4% | ↓ 13.9% |
| Italy | ↑ 109.3% | ↓ 35.4% |
| Japan | ↑ 31.5% | ↑ 9.7% |
| Spain | ↑ 39.4% | ↓ 8% |
| United Kingdom | ↑ 78.6% | ↓ 30.3% |
| USA – California | ↑ 46.5% | ↑ 1.2% |
| USA – Michigan | ↑ 37.9% | ↓ 16.1% |
| USA – New York and New Jersey | ↑ 44.6% | ↓ 5.5% |
Table 1 — Growth in Internet traffic and download speeds, by economy (data via Fastly).
Routing table growth
Was there also rapid growth in the Internet routing table? Every year, Geoff Huston, Chief Scientist at APNIC, summarizes the behaviour of the Border Gateway Protocol (BGP) over the past year and makes fascinating observations. Here are some statistics from the IPv4 BGP network in the last three years from his BGP 2020 report:
| Jan-18 | Jan-19 | Jan-20 | Jan-21 | 2018 | 2019 | 2020 | |
| Prefix Count | 699,000 | 760,000 | 814,000 | 860,000 | 9% | 7% | 6% |
| AS Count | 59,700 | 63,100 | 66,800 | 70,400 | 6% | 6% | 5% |
Table 2 — IPv4 routes data.
While the number of IPv4 routes (prefix count) increased annually by up to 9% in the past three years, the rate of growth actually dropped slightly to 6% in 2020 — was it because of COVID-19 limiting business growth, or something else? Likewise, there was 5% growth reported in the IPv4 Autonomous System (AS) count, or number of networks, also slightly lower than previous years.
| Jan-18 | Jan-19 | Jan-20 | Jan-21 | 2018 | 2019 | 2020 | |
| Prefix Count | 47,700 | 62,400 | 79,400 | 109,130 | 23% | 22% | 28% |
| AS Count | 14,500 | 16,470 | 18,600 | 21,600 | 14% | 14% | 14% |
Table 3 — IPv6 routes data.
In the IPv6 prefix count, there was a nearly 30% growth rate, the highest in several years, while the AS count growth rate stayed flat at 14%.
Ultimately, it appears the pandemic did not lead to a significant change in terms of the overall number of routes and networks, but there was a rise in IPv6 routes.
Also of note: we are about to hit one million routes (IPv4 and IPv6 combined), which means some routers will not be able to accept the full routing table soon. The CIDR-Report maintains the BGP growth table and the AS growth table.
BGP security in 2020
BGP provides the flexibility and scalability to accommodate Internet growth with very few problems. But, because it is based on trust, without built-in security mechanisms, problems do arise. Every now and then, some network engineer makes a small mistake, or a bad actor intentionally redirects traffic, generating incorrect routing information that BGP blindly accepts and relays across the Internet. These ‘routing incidents’ include route leaks, route hijacks, and IP address spoofing and each type has the potential to slow down Internet speeds or make parts of the Internet unreachable. Packets can also get diverted through malicious networks, providing an opportunity for surveillance.
Using data from Cisco’s BGPStream.com, a public service platform providing information about suspicious routing events and a data source of the MANRS Observatory, let’s examine some notable routing incidents of 2020.
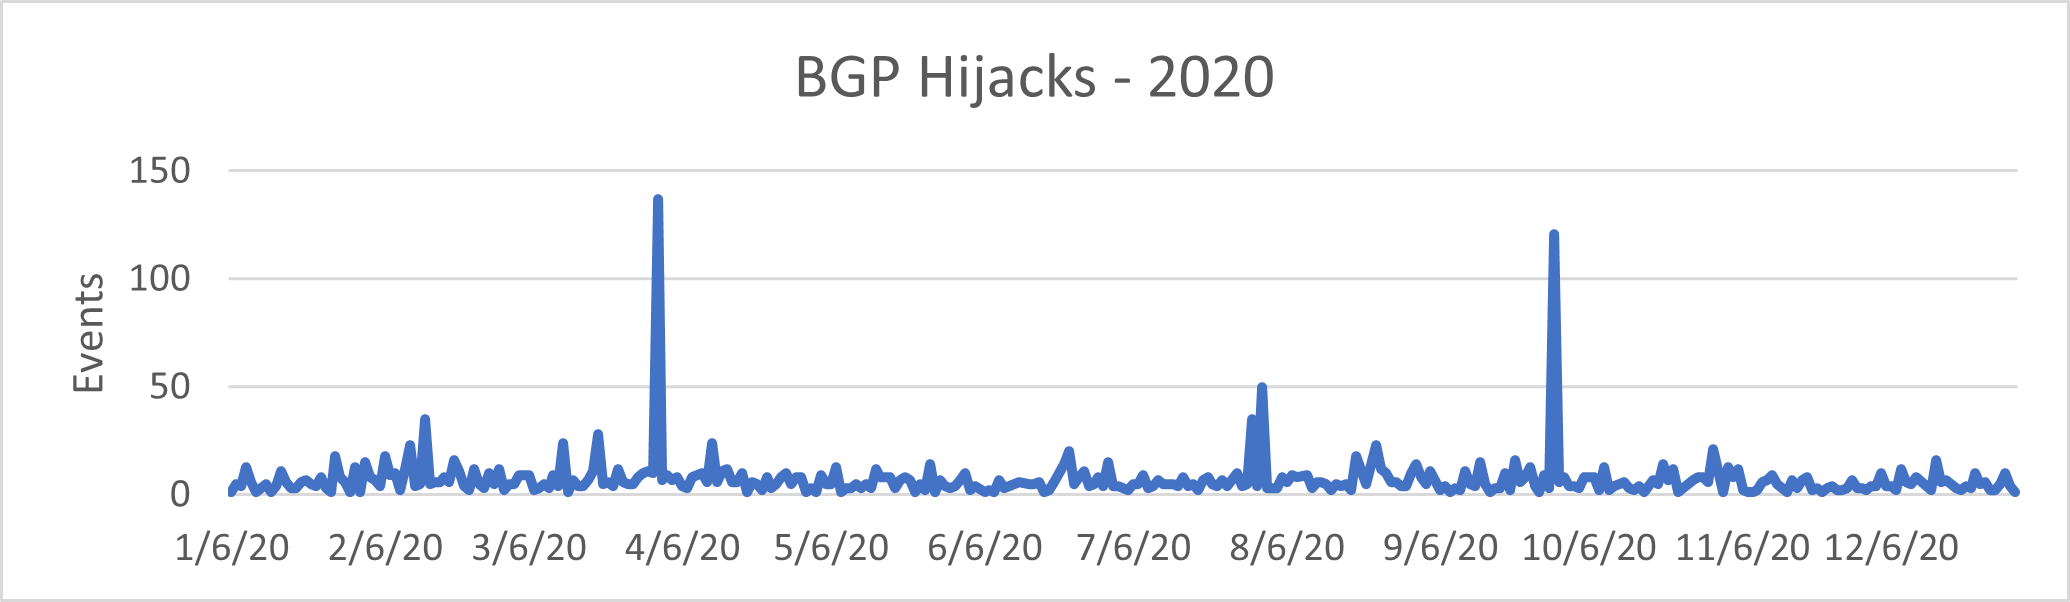
BGP hijacks
In 2020, BGPStream collectors identified 2,477 BGP hijack events, including three major incidents:
- April — Rostelecom (AS12389) hijack
- July — ATLDC – Tulix Systems, Inc (AS10990) hijack
- September — Telstra (AS1221) hijack
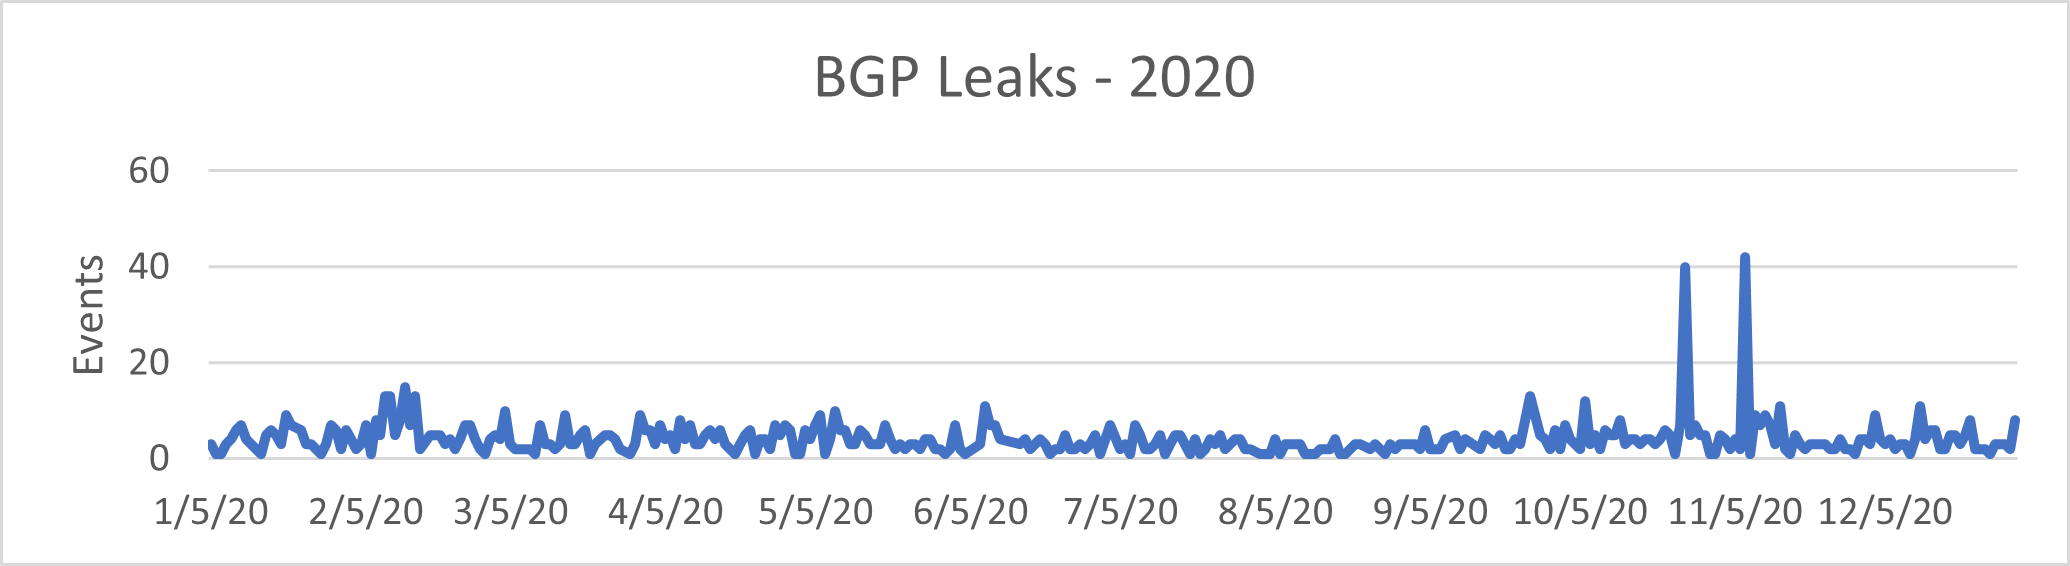
BGP leaks
Another category of events is BGP leaks. In 2020, there were 1,396 events identified as leaks, including two major incidents:
- CONVERGE-AS17639 Converge ICT Solutions (PH) leaking prefixes from Korea
- CONVERGE-AS17639 Converge ICT Solutions (PH) leaking prefixes from Korea, India, and Brazil.
Was 2020 better or worse than 2019?
In comparison, there were 1,782 BGP hijack events and 2,420 BGP leak events recorded by Cisco BGPStream in 2019. The following table is a summary:
BGP hijacks
| Description | 2019 | 2020 |
| Total events | 1,782 | 2,477 |
| Impacted ASNs | 1,147 | 1,509 |
| Possible culprit ASNs | 864 | 997 |
| Impacted prefixes | 1,685 | 2,357 |
| IPv6 prefixes | 79 | 132 |
| IPv4 prefixes | 1,606 | 2,225 |
Table 4 — BGP hijacks in 2019 and 2020.
BGP leaks
| Description | 2019 | 2020 |
| Total events | 2,420 | 1,396 |
| Impacted ASNs | 1,957 | 885 |
| Possible culprit ASNs | 629 | 337 |
| Impacted prefixes | 2,638 | 1,081 |
| IPv6 prefixes | 0 | 0 |
| IPv4 prefixes | 2,638 | 1,081 |
Table 5 — BGP leaks in 2019 and 2020.
We have combined both types of events (hijacks and leaks) to produce the following graphs, which show a much clearer picture of the year-on-year comparison.
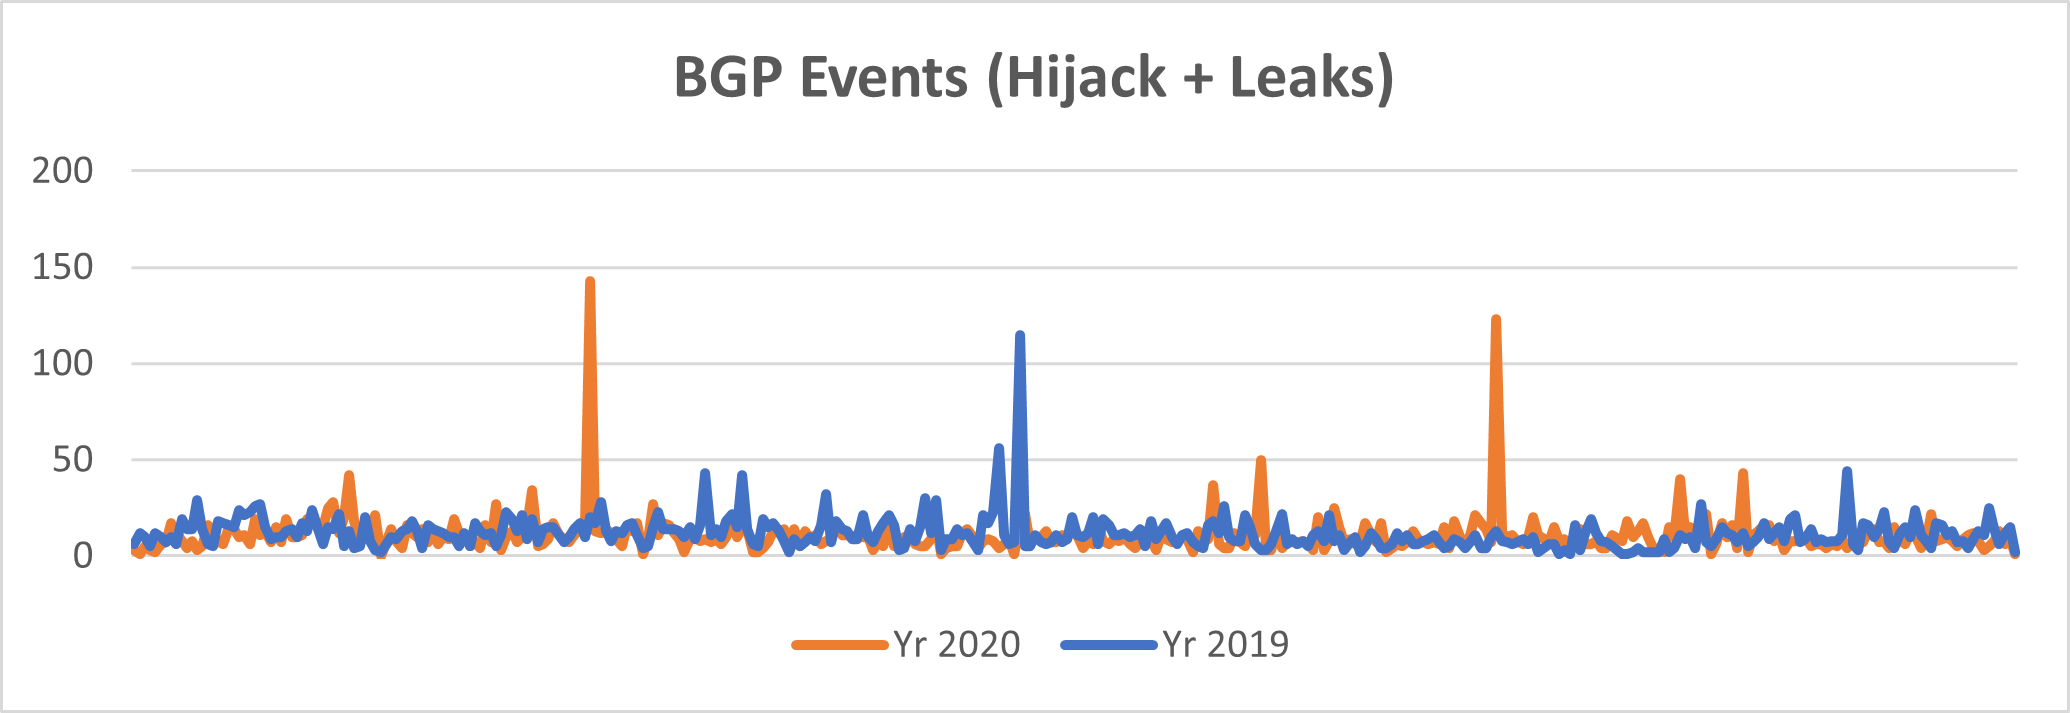
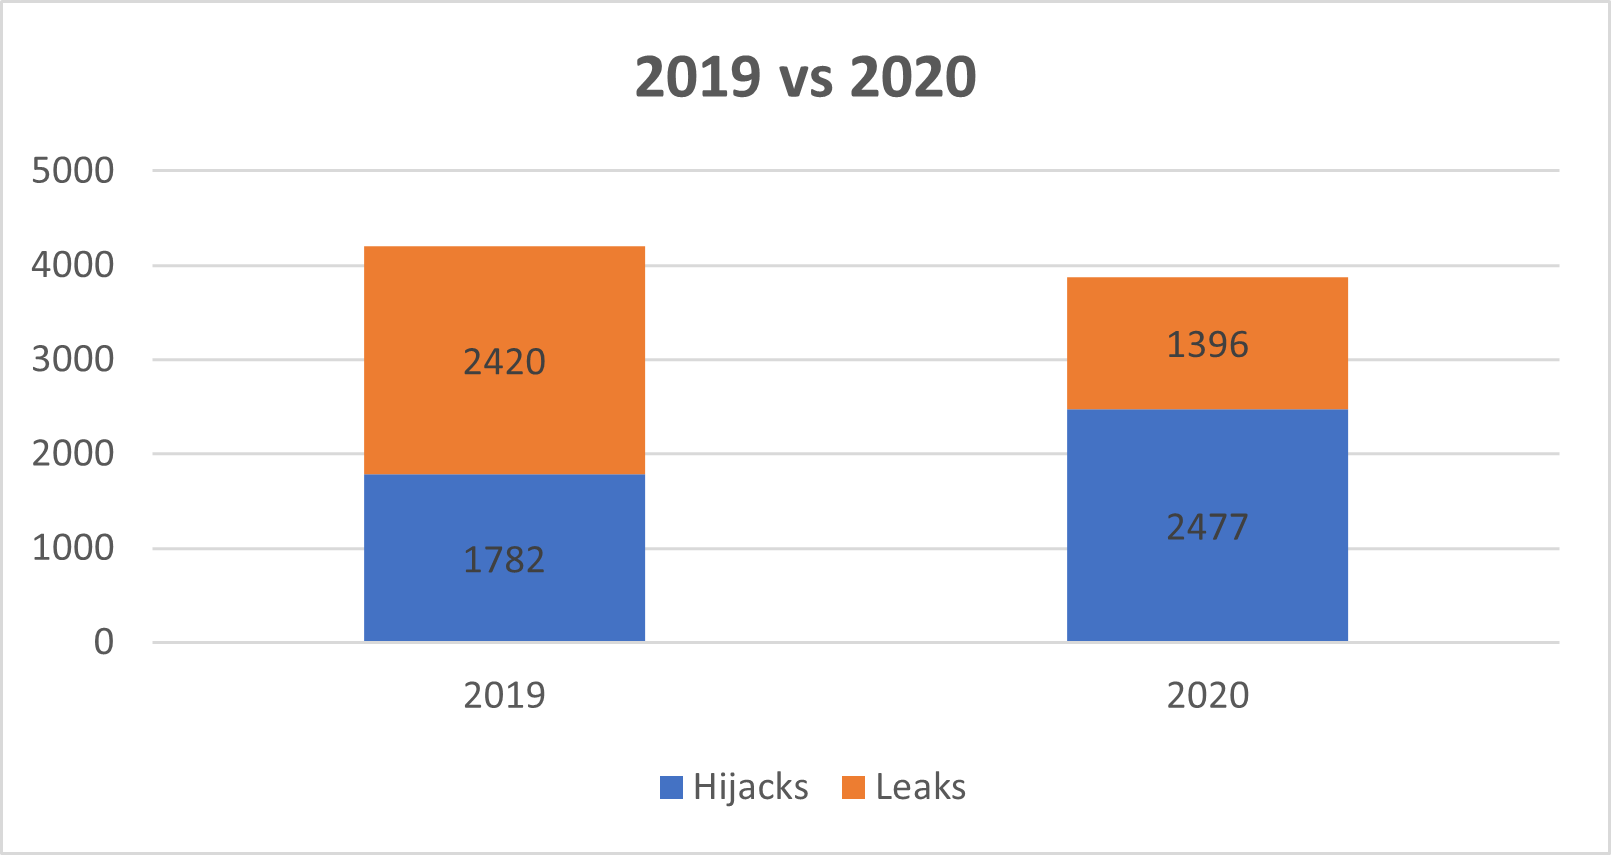
There was a slight increase in the number of hijack incidents in 2020 compared to 2019, but the good news is the significant drop in BGP leaks, bringing down the total number of incidents by 8% in 2020.
2020 was a year of reckoning, when many network operators took routing security seriously and started taking action to protect the global routing table. Specifically, a growing number of operators proactively put in place route filtering, created Route Origin Authorizations (ROAs) and started doing Route Origin Validation (ROV). As we’ll detail below, the increase in MANRS’ participants in 2020 also clearly shows this shift in the community towards greater routing security.
Limiting the spread of hijacks
The 8% decrease in the total number of incidents is a good sign, but the rise in hijack incidents is a concern — let’s delve into the hijack events a bit further. The BGPStream data includes the item “Detected by number of BGPMon peers”, showing there are more than 170 BGP peers sending full (most likely) BGP feeds to its route collector. To gauge how much the leak or hijack events propagated over the Internet, we can analyse how many peers were announced to the collector. The higher the peer count, the bigger the impact.
This table shows the comparison between 2019 and 2020 hijack events detected by the number of peers.
| No of peers | 2019 | 2020 |
| 1 – 5 | 377 (21.2%) | 560 (22.5%) |
| 6 – 10 | 123 (7%) | 212 (8.5%) |
| 11 – 20 | 151 (8.5%) | 226 (9%) |
| 21 – 30 | 85 (4.8%) | 177 (7.2%) |
| 31 – 168 | 1,047 (58.9%) | 1,302 (52.8%) |
| Total | 1,782 | 2,477 |
Table 6 — 2019 and 2020 hijack events by number of peers.
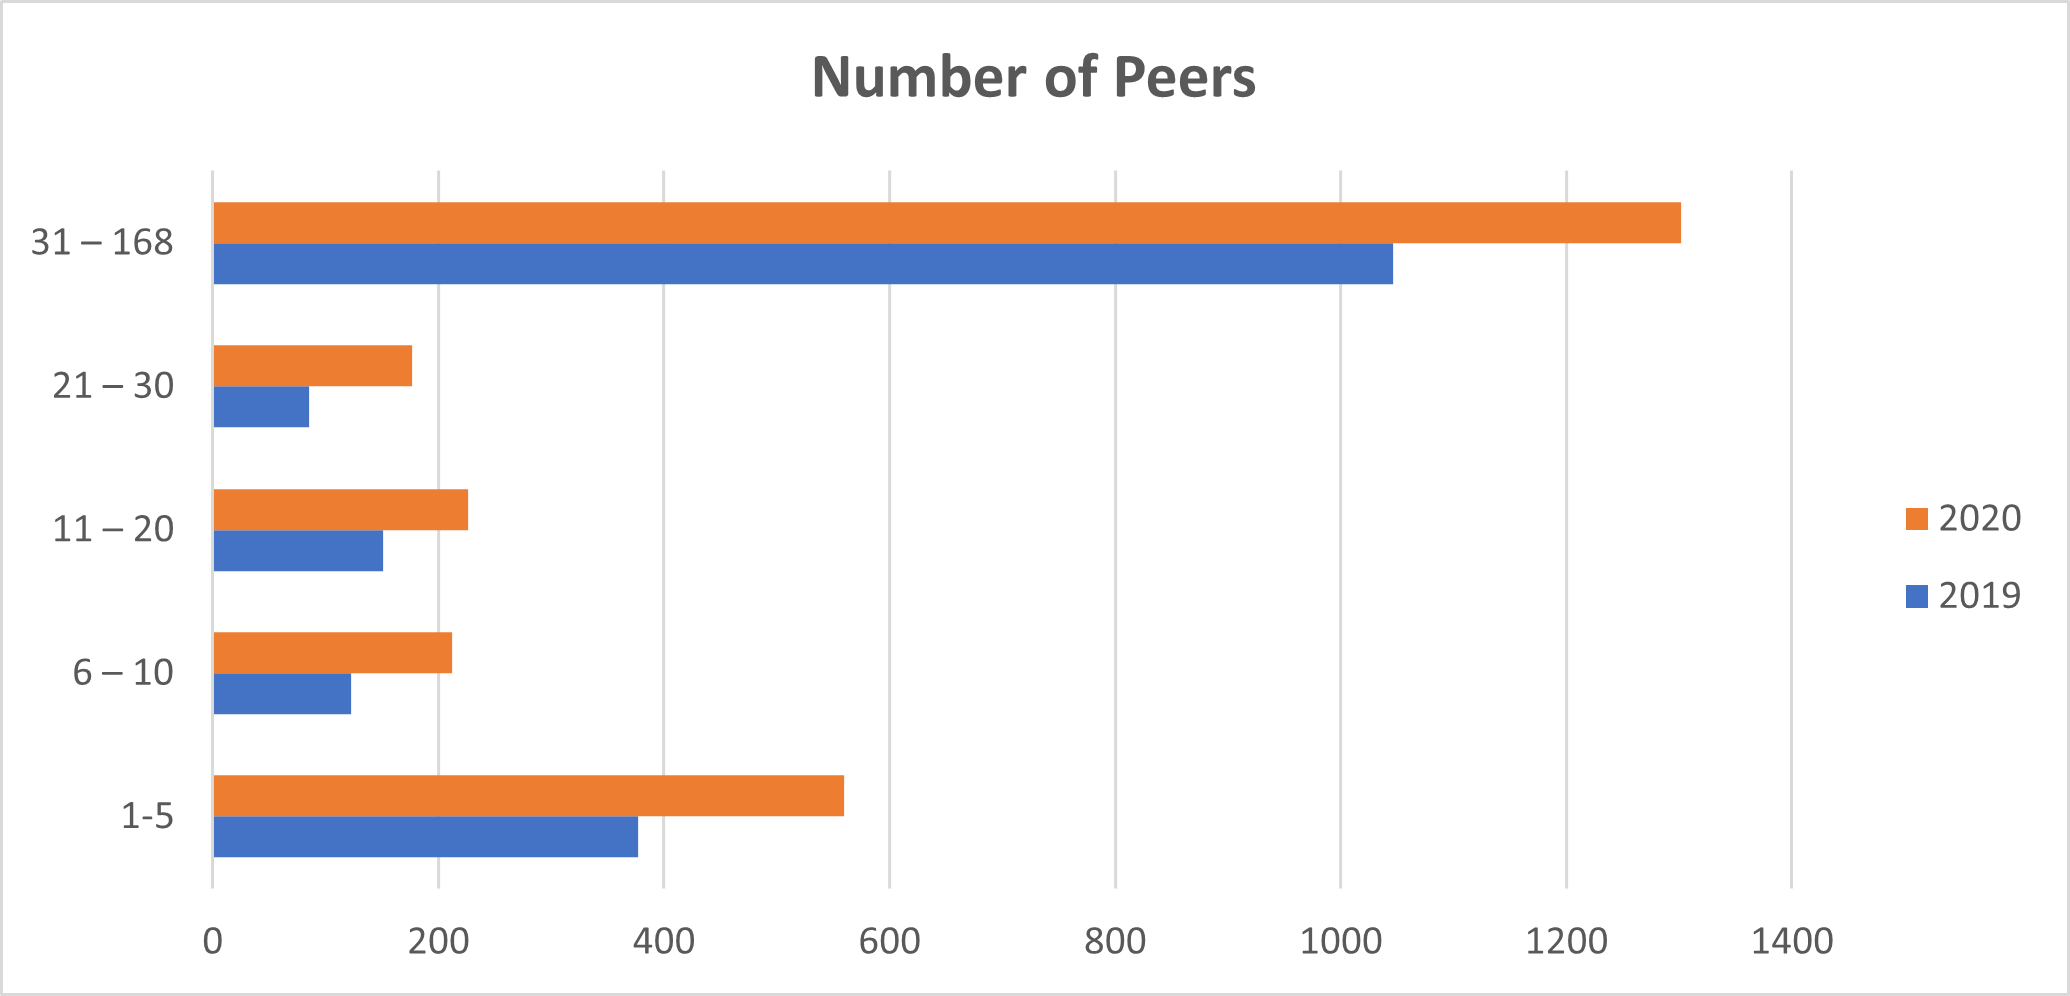
Takeaway: Even though there were more hijack events in 2020, they tended to affect fewer networks.
More than 47% of the total incidents were detected by fewer than 30 peers, and more than 22% of incidents were only detected by one to five peers. It’s a good sign that when an incident occurred the impact was minimized because the networks in the middle took proper action to mitigate damage.
RPKI in 2020
As mentioned above, 2020 was marked by heightened awareness of routing security. There were many discussions, presentations, and tutorials focusing on the topic, and invariably the most important point raised was Resource Public Key Infrastructure (RPKI) and encouraging network operators to create ROAs and start doing ROV.
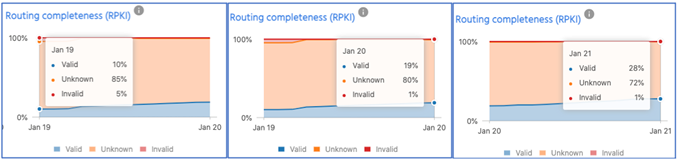
The above screenshots from the MANRS Observatory show the upward trend in ROA creation and reduction in ROA invalids. In January 2019, there were only 10% of valid ROAs, 85% were unknown (not found), and 5% were invalid. Today, we have around 28% of valid ROAs (about 180,000 IPv4 and 31,000 IPv6) in the global routing table and only 1% invalid.
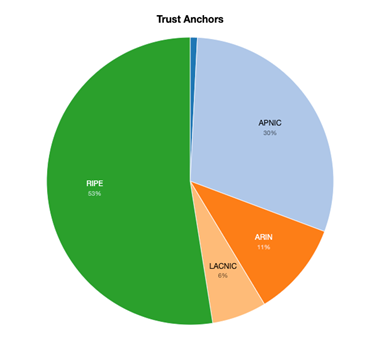
Here is the ROA status per Regional Internet Registry (RIR). The RIPE region takes the lead, with APNIC and the rest of the RIRs catching up fast.
MANRS in 2020 and beyond
Convincing people to implement basic routing security measures is challenging. Technology is rarely the problem; the mindset is. It’s easy to assume if your network’s not broken you don’t have anything to fix — but, in fact, routing still has major problems that aren’t always visible on the surface, and it is every operator’s responsibility to contribute to the solution. Taking action requires behavioural change, which comes from acknowledging the consequences of not putting in responsible routing security measures.
MANRS was created in 2014 to improve the security and stability of Internet routing by developing a credible mark of technical excellence, underpinned by a security baseline, defined by ‘Actions’, a vibrant operators’ community, and a sustainable governance model.
2020 saw impressive growth in MANRS participation, meaning more people are now aware of the problems insecure routing can create if not addressed properly. Through the hundreds of community engagement and capacity-building initiatives, MANRS helped inspire many people to adopt RPKI and other technologies that can strengthen overall routing security, one network at a time.
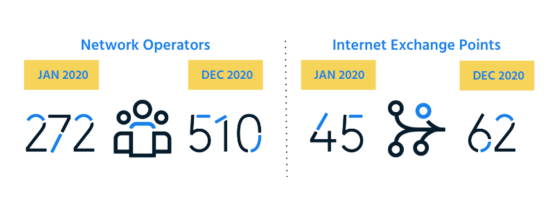
Here is a snapshot of what we achieved last year, thanks to the tremendous support from all of you.

The MANRS community is driving this behavioural change towards more secure routing. We now have more than 588 strong participants who believe in implementing basic routing security measures and are committed to convincing others to do the same.
There’s still a long way to go, but the strong growth across all three MANRS programs (network operators, IXPs, and CDN/Cloud providers) is a clear sign that MANRS is moving in the right direction.
Join us to make 2021 an even better year!
Aftab Siddiqui is MANRS Project Lead & Senior Manager, Internet Technology at the Internet Society.
The views expressed by the authors of this blog are their own and do not necessarily reflect the views of APNIC. Please note a Code of Conduct applies to this blog.