

At the start of each year, I reported on the behaviour of the inter-domain routing system over the past 12 months, looking in detail at some metrics from the routing system that can show the essential shape and behaviour of the underlying interconnection fabric of the Internet.
One reason why we are interested in the behaviour of the routing system is that at its heart, the routing system has no natural limitation.
Our collective unease about routing relates to a potential scenario where every network decides to deaggregate their prefixes and announce only the most specific prefixes, or where every network applies routing configurations that are inherently unstable, and the routing system rapidly reverts into oscillating states that generate an overwhelming stream of routing updates into BGP.
In such scenarios, the routing protocol we use, the Border Gateway Protocol, or BGP, will not help us by attempting to damp down the anomalies. Indeed, there is a very real prospect that in such scenarios the protocol behaviour of BGP could well amplify the behaviour!
What is BGP?
The basic approach of this algorithm is very simple: each BGP speaker tells all its other neighbours about what it has learned if the new learned information alters the local view of the network. This is a lot like a social rumour network where every individual who hears a new rumour immediately informs all their friends.
BGP works in a very similar fashion: each time a neighbour informs a BGP speaker about reachability to an IP address prefix, the BGP speaker compares this new reachability information against its stored knowledge that was gained from previous announcements from other neighbours. If this new information provides a better path to the prefix, then the local speaker moves this prefix and associated next-hop forwarding decision to the local forwarding table and informs all its immediate neighbours of a new path to a prefix, implicitly citing itself as the next hop.
In addition, there is a withdrawal mechanism, where a BGP speaker determines that it no longer has a viable path to a given prefix, in which case it announces a ‘withdrawal’ to all its neighbours. When a BGP speaker receives a withdrawal, it stores the withdrawal against this neighbour. If the withdrawn neighbour happened to be the currently preferred next hop for this prefix, then the BGP speaker will examine its per-neighbour data sets to determine which stored announcement represents the best path from those that are still extant. If it can find such an alternative path, it will copy this into its local forwarding table and announce this new preferred path to all its BGP neighbours. If there is no such alternative path, it will announce a withdrawal to its neighbours, indicating that it no longer can reach this prefix.
And that’s the short summary of BGP.
What could possibly go wrong?
The first metric of interest is the size of the routing tables. Each router needs to store a local database of all prefixes announced by each routing peer. In addition, conventional routing design places a complete set of ‘best’ paths into each line card and performs a lookup into this forwarding data structure for each packet.
This may not sound all that challenging until you do some basic calculations and work out that at 100Gbps (which is increasingly common these days) that means that a single such ‘wire’ could present one valid 64 octet IP packet every 5 nanoseconds. Performing a lookup into a data structure of around one million entries for an imprecise match of a 32-bit value within 5 nanoseconds represents an extremely challenging silicon design problem. Even with an optimally balanced binary search structure that’s a minimum of 10 comparison operations. And, as they are sequential, the individual comparisons need to be performed within half a nanosecond. The larger the routing search space, the more challenging the problem!
Secondly, there is the overall stability of the system. Processing a routing update requires several lookups into local data structures as well as local processing steps. Each router has a finite capacity to process updates and once the update rate exceeds this local processing capability then the router will start to queue up unprocessed updates.
In the worst case, the router will start to lag in real time, so that the information a BGP speaker is propagating reflects a past local topology, not necessarily the current local topology. If this lag continues then unprocessed updates may be dropped from the queue. BGP has no inherent periodic refresh capability so when information is dropped by the router its neighbours fall out of sync with the network topology.
At its most benign, the router will advertise ‘ghost’ routes where the prefix is no longer reachable, yet the out-of-sync router will continue to advertise reachability.
At its worst, the router will set up a loop condition and as traffic enters the loop it will continue to circulate through the loop until the packet’s TTL expires. This may cause saturation of the underlying transmission system and trigger further outages which, in turn, may add to the routing load.
The critical metrics we are interested in are the size of the routing space and its level of updates, or ‘churn’.
Read: BGP in 2019 — BGP Churn
The BGP Measurement Environment
When trying to analyse long baseline data series the ideal approach is to keep as much of the local data gathering environment as stable as possible. This way, the changes that occur in the collected data reflect changes in the larger environment, as distinct from changes in the local configuration of the data collection equipment.
The measurement point being used is a BGP speaker configured within AS131072. This AS generates no traffic and originates no routes in BGP. It’s a passive measurement point that has been logging all received BGP updates since 2007. The router is fed with a default-free eBGP feed from AS4608, which is the APNIC network located in Australia, and AS4777, which is the APNIC network located in Japan, for both IPv4 and IPv6 routes.
There is also no iBGP component in this measurement setup. While it has been asserted at various times that iBGP is a major contributor to BGP scalability concerns in BGP, the consideration here in trying to objectively measure this assertion is that there is no ‘standard’ iBGP configuration, and each network has its own rather unique configuration of Route Reflectors and iBGP peers. This makes it hard to generate a ‘typical’ iBGP load profile, let alone analyse the general trends in iBGP update loads over time.
Read: AS prepending in BGP
In this study, the scope of attention is limited to a simple eBGP configuration that is likely to be found as a ‘stub’ AS at the edge of the Internet. This AS is not an upstream for any third party, it has no transit role, and does not have a large set of BGP peers. It’s a simple view of the routing world that I see when I sit at an edge of the Internet. Like all BGP views, it’s unique to this network, and every other network will see a slightly different Internet with different metrics. However, the behaviour seen by this stub network at the edge of the Internet is probably similar to most other stub networks at the edge of the Internet. While the fine details may differ, the overall picture is probably much the same.
History of the IPv4 routing table
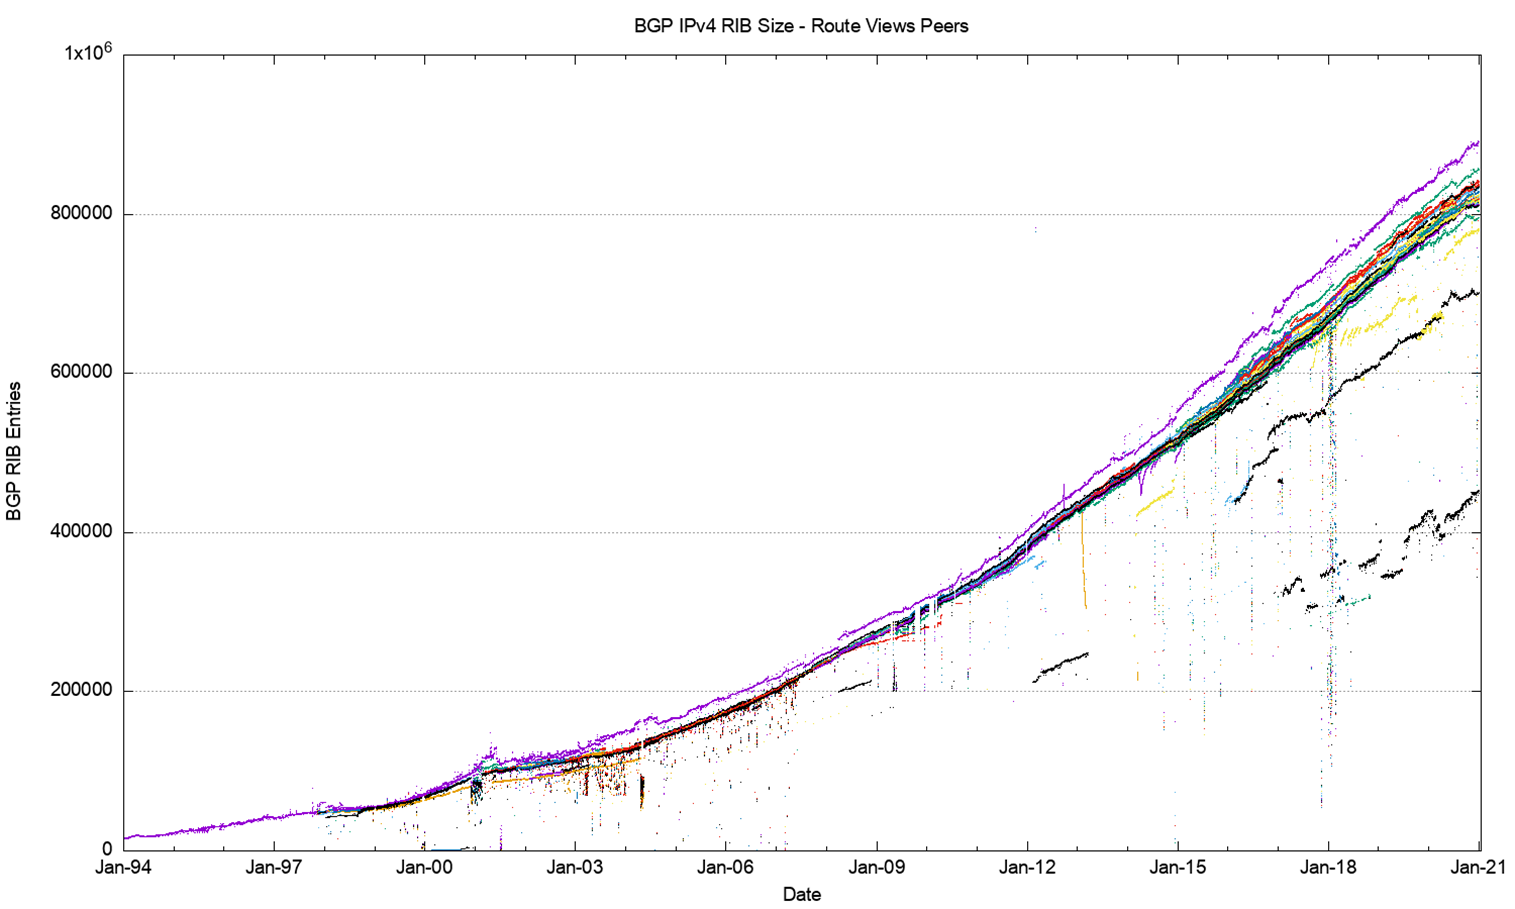
Measurements of the size of the routing table have been taken on a regular basis since the start of 1988, although highly detailed snapshots of the routing system only date back to early 1994. Figure 1 shows a rather unique picture of the size of the routing table, as seen by all the peers of the Route Views route collector on an hourly basis.
What makes Route Views so unique is that it archives these routing tables every two hours and has done so for more than two decades. It also archives every BGP update message. This vast collection of data is a valuable research data set and here we are just taking a tiny slice of this data set to look at longer term growth trends.
The folk at the Route Views Project, with the support from the University of Oregon and the US National Science Foundation, should be commended for their efforts here. This is a very unique data set if you are interested in the evolution of the Internet over the years.
Several broader events are visible in the history of the routing table, such as the bursting of the Internet bubble in 2001, and if one looks closely, the effects of the global financial crisis in 2009. What is perhaps surprising is an ongoing event that is not visible in this plot: since 2011 the supply of IPv4 addresses has been progressively constrained as the free address pools of the various Regional Internet Registries have been exhausted. Yet there is no visible impact on the rate of growth of the number of announced prefixes in the global routing system since 2011. In terms of the size of the routing table, it’s as if the exhaustion of IPv4 addresses has not happened at all.
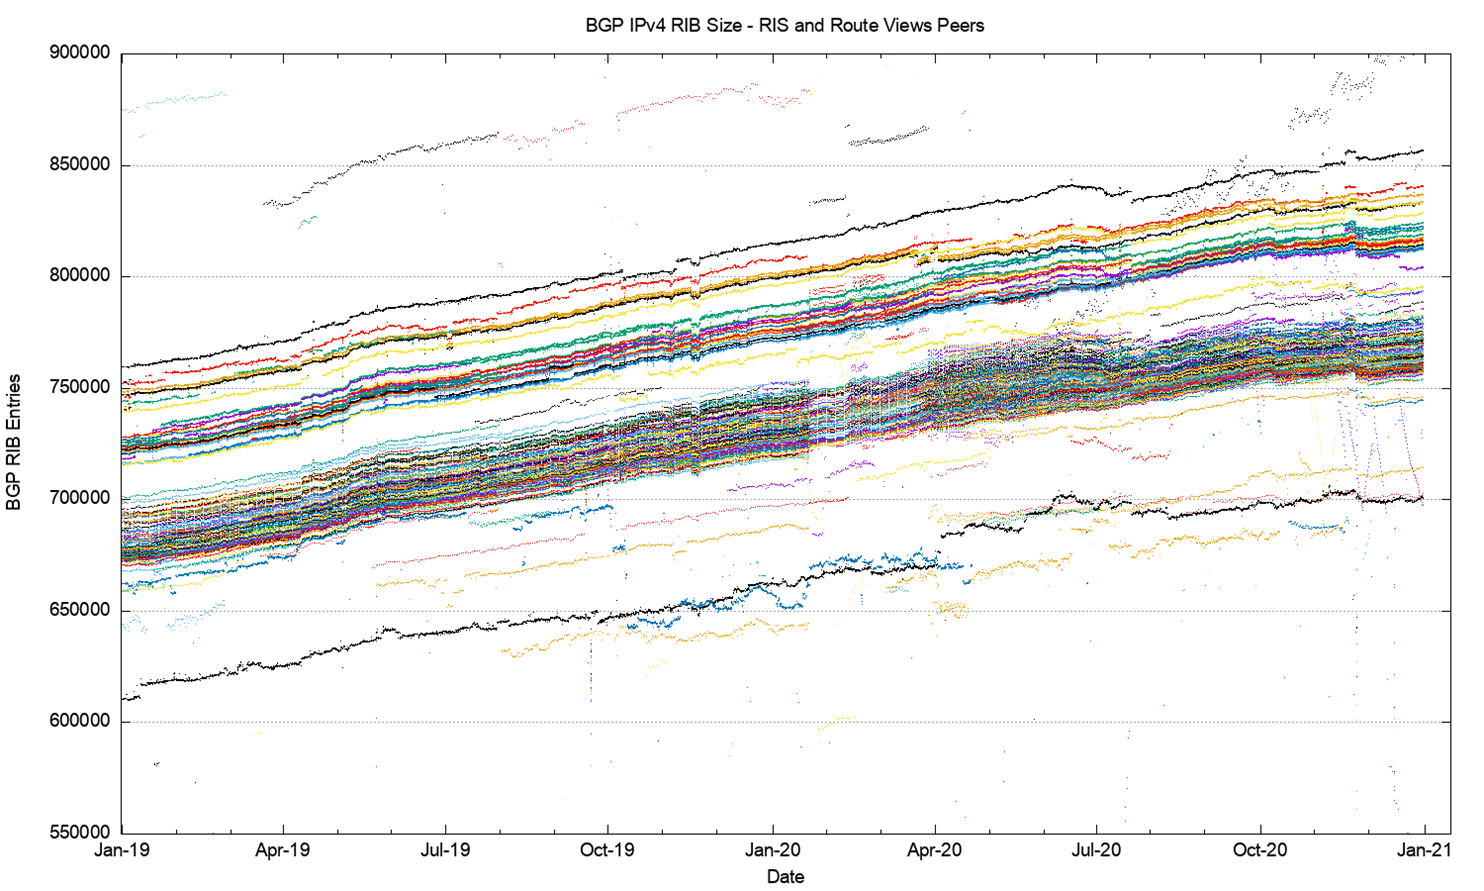
BGP is not just a reachability protocol. Network operators can manipulate traffic paths using selective advertisement of more specific addresses, allowing BGP to be used as a traffic engineering tool. These more specific advertisements often have a restricted propagation. This is evident in Figure 2, where the BGP routing table counts from both the Route Views peers and the peers of RIPE NCC’s Routing Information Service (RIS) are combined.
There are two distinct bands in this plot, the upper band is the Route Views peers, and the lower band is generated by the RIS peers. The RIS peers, which are predominately located in Europe, appear to have 50,000 fewer prefixes, and cluster more tightly around their mean as compared to the set of Route Views peers.
The other interesting point is that at the start of 2017 the reporting systems have a divergence of some 50,000 route entries, yet by the end of 2019 this divergence has increased to some 100,000 routing entries.
This illustrates an important principle in BGP: there is no single authoritative view of the Internet’s inter-domain routing table — all views are in fact relative to the perspective of each BGP speaker.
It also illustrates that, at times, the cause of changes in routing is not necessarily a change at the point of origination of the route which would be visible to all BGP speakers across the entire Internet, but it may well be a change in transit arrangements within the interior of the network that may expose, or hide, collections of routes.
To quote the Wikipedia article on this topic “In absence of enlightened self-interest, some form of authority or federation is needed to solve the collective action problem.”
This appears to be the case in the behaviour of the routing system, where there is an extensive reliance on enlightened self-interest to be conservative in one’s own announcements.
The next collection of plots (Figures 3 through 12) show some of the vital statistics for IPv4 in BGP since the start of 2012 to the end of 2020.
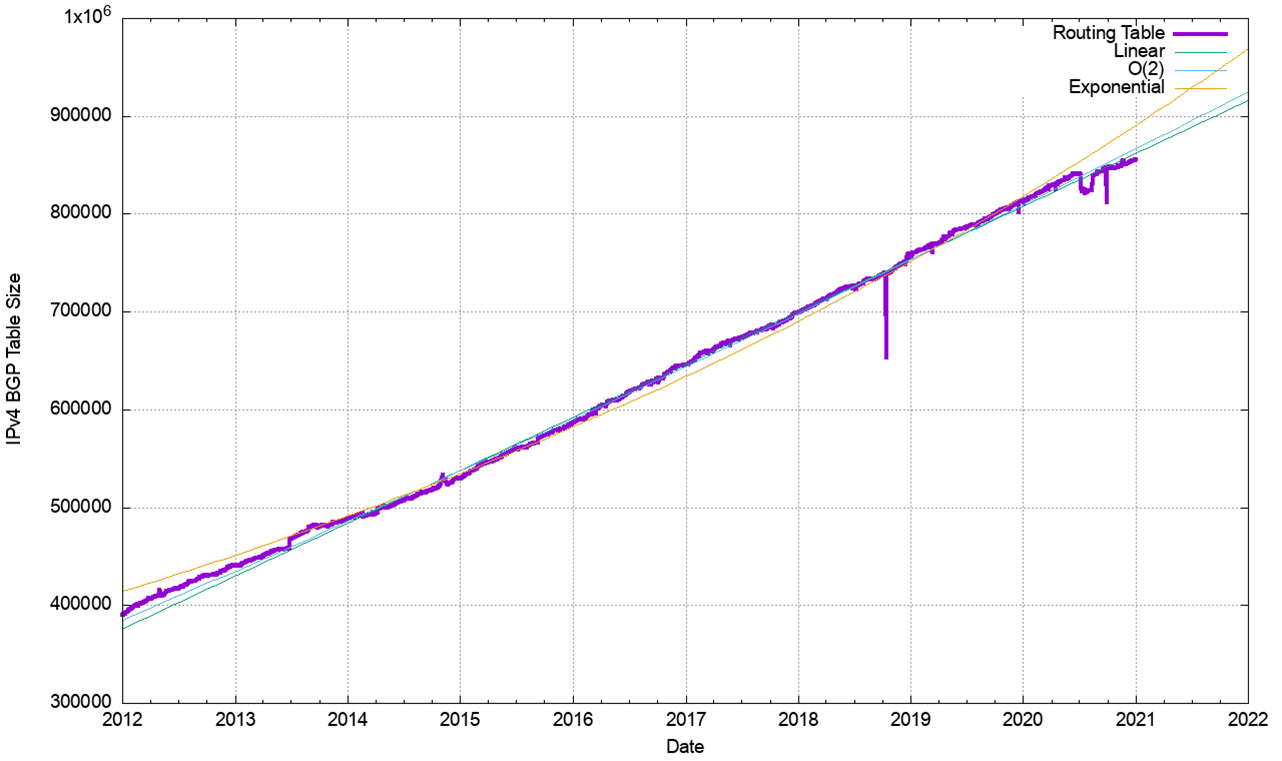
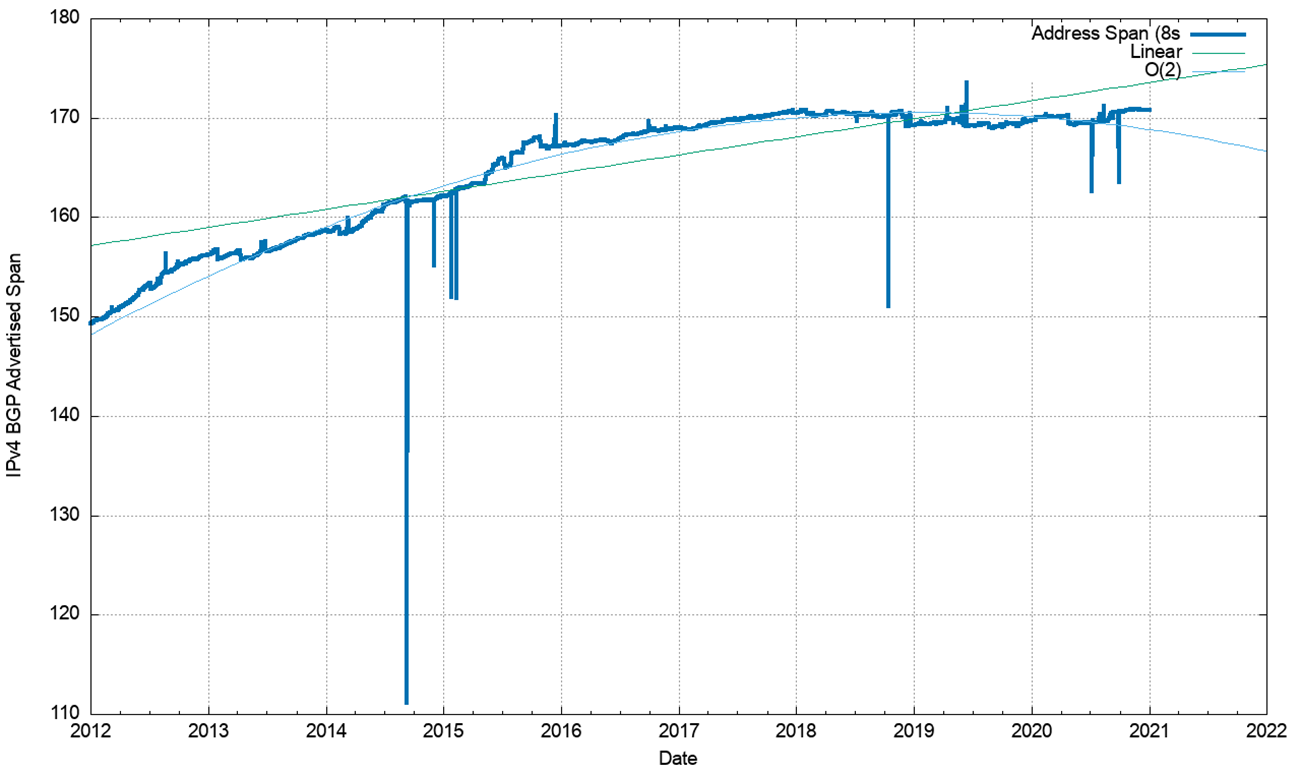
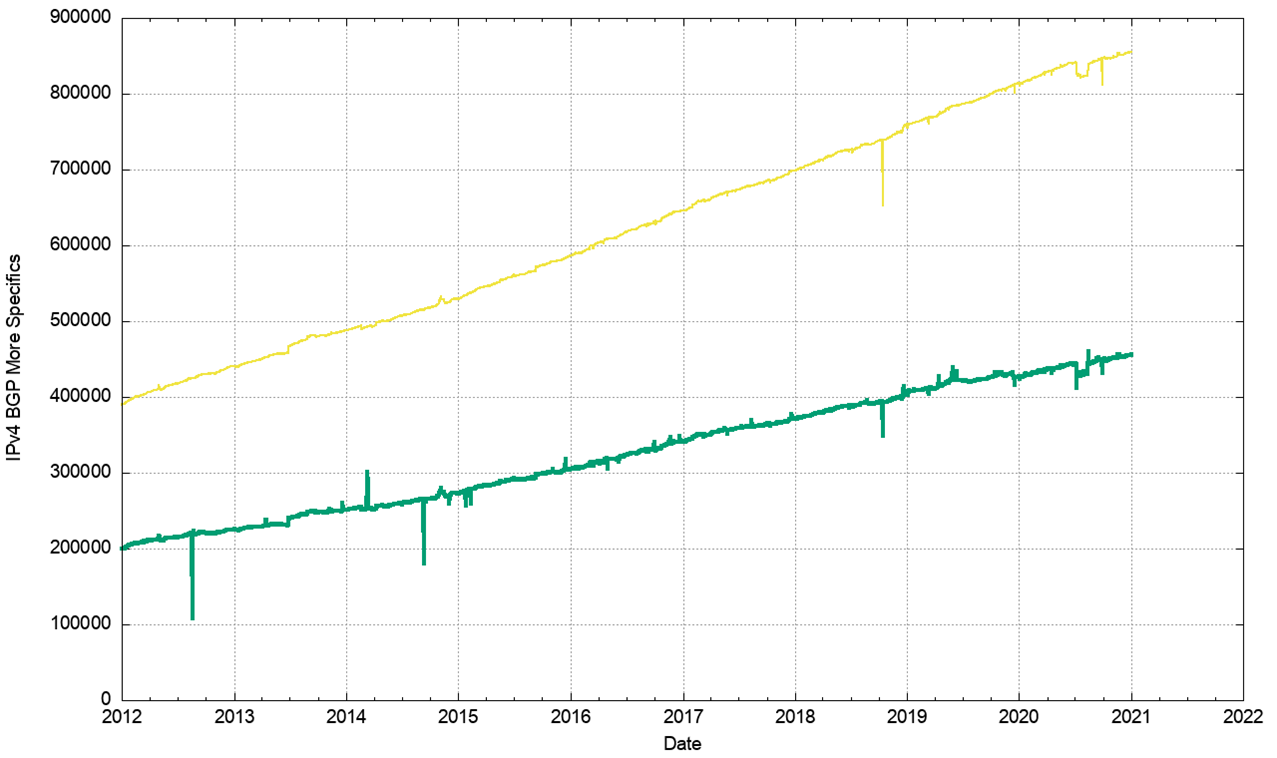
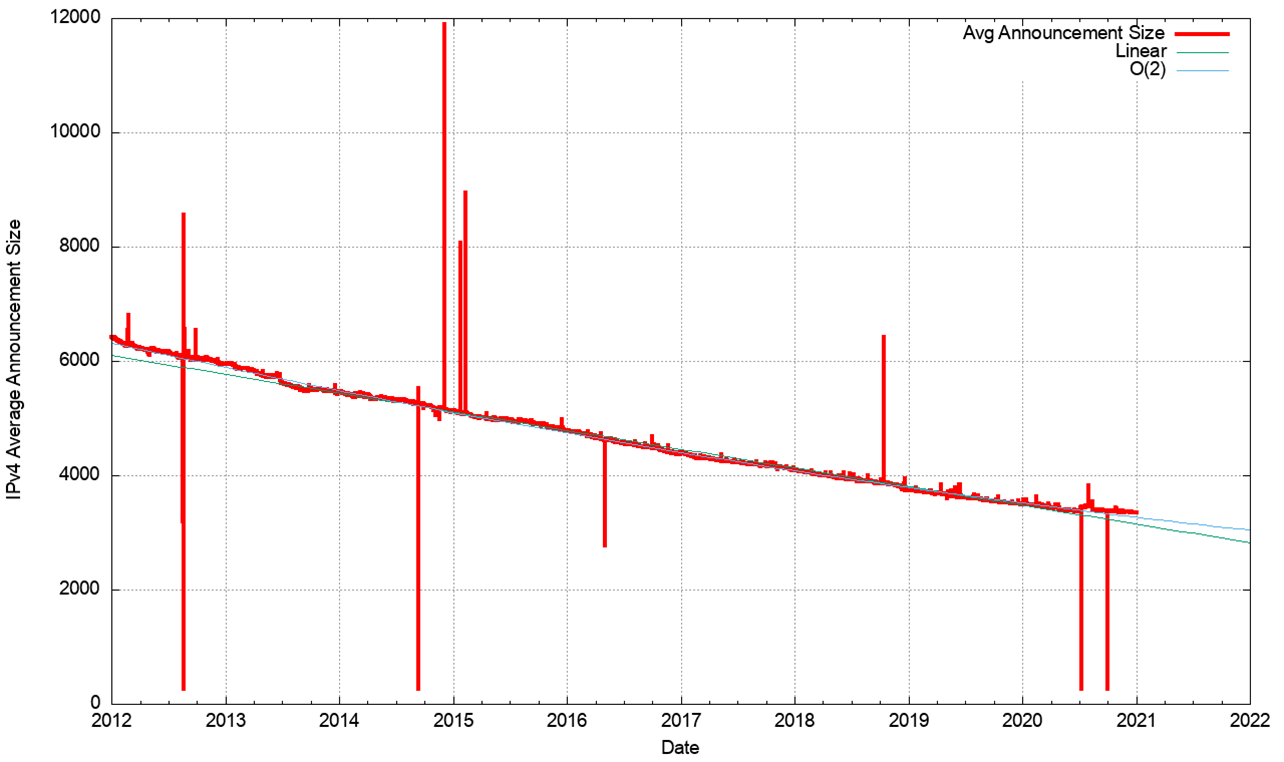
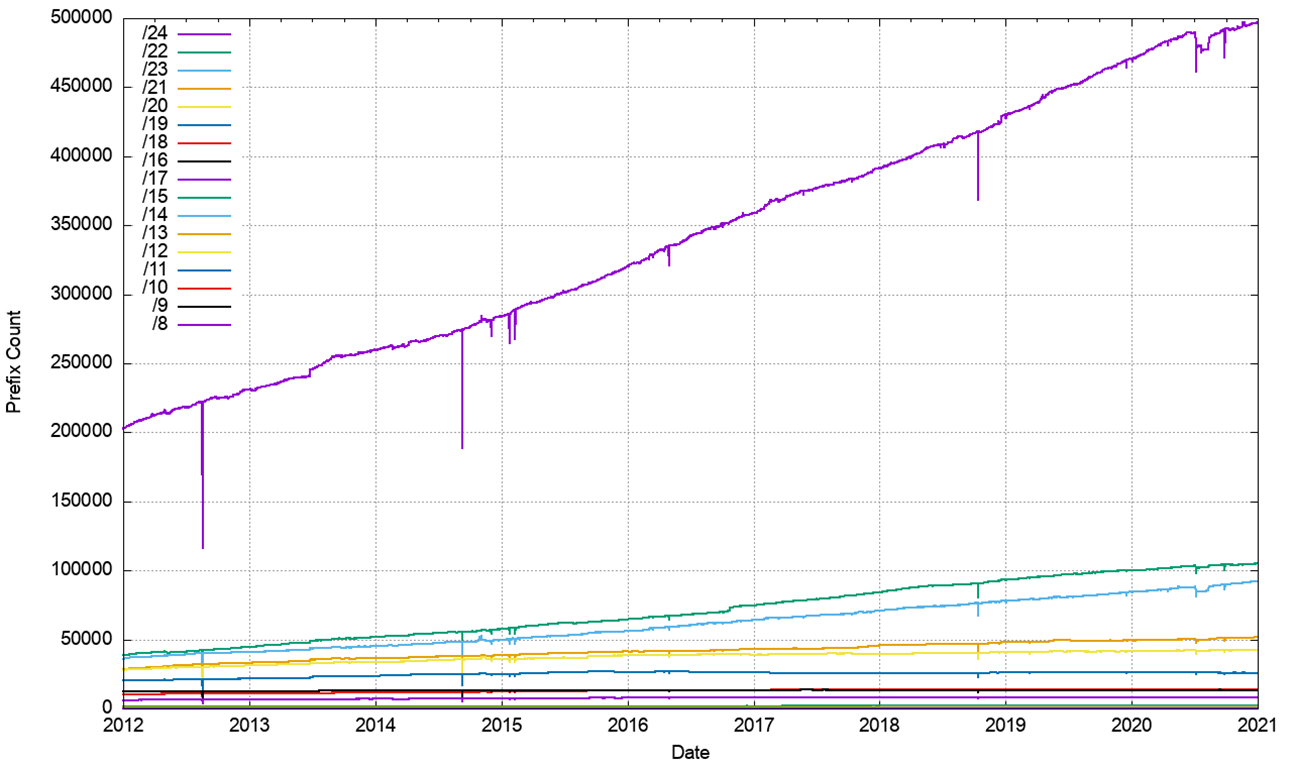
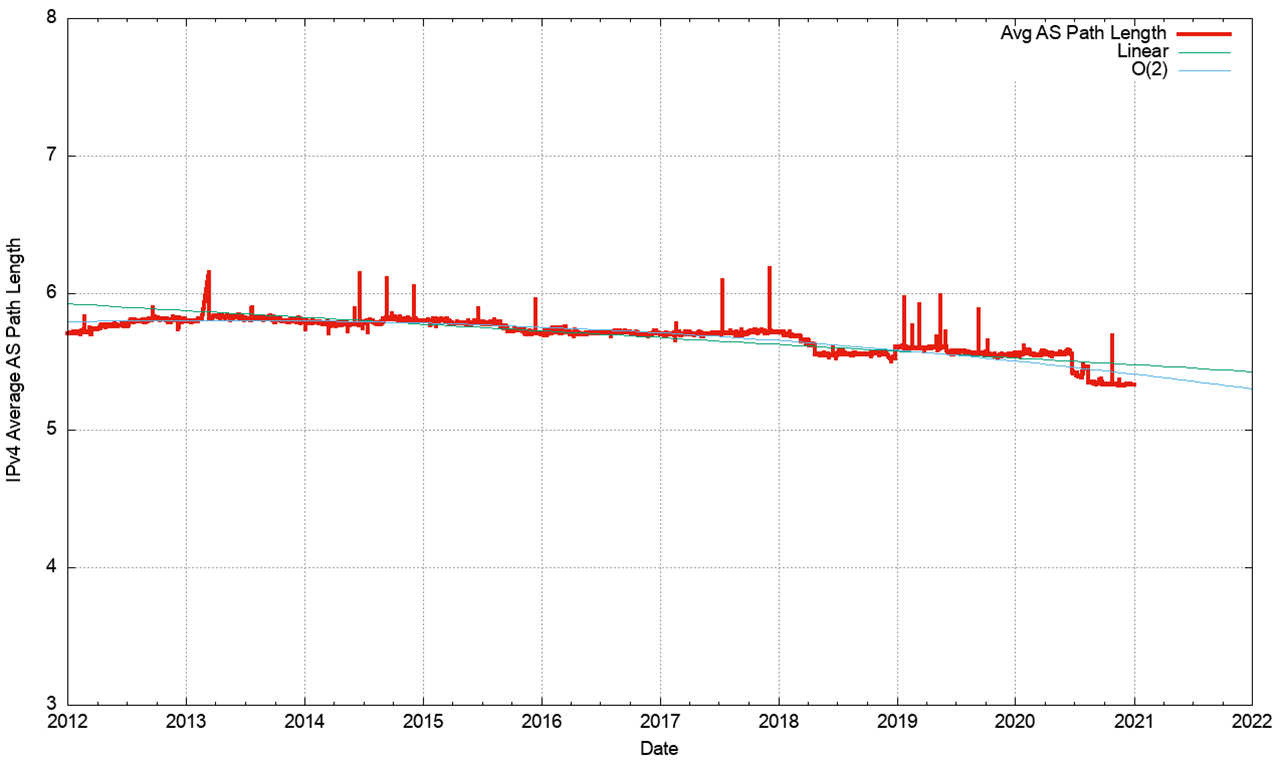
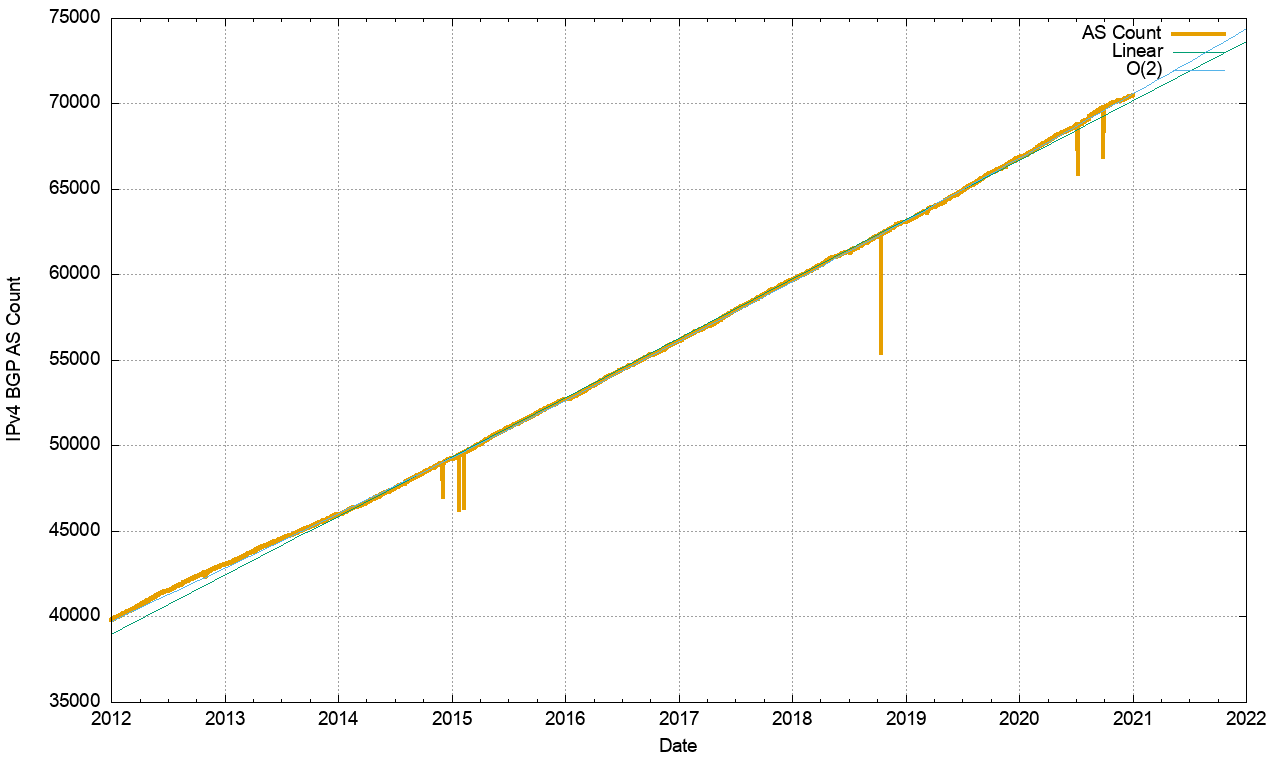

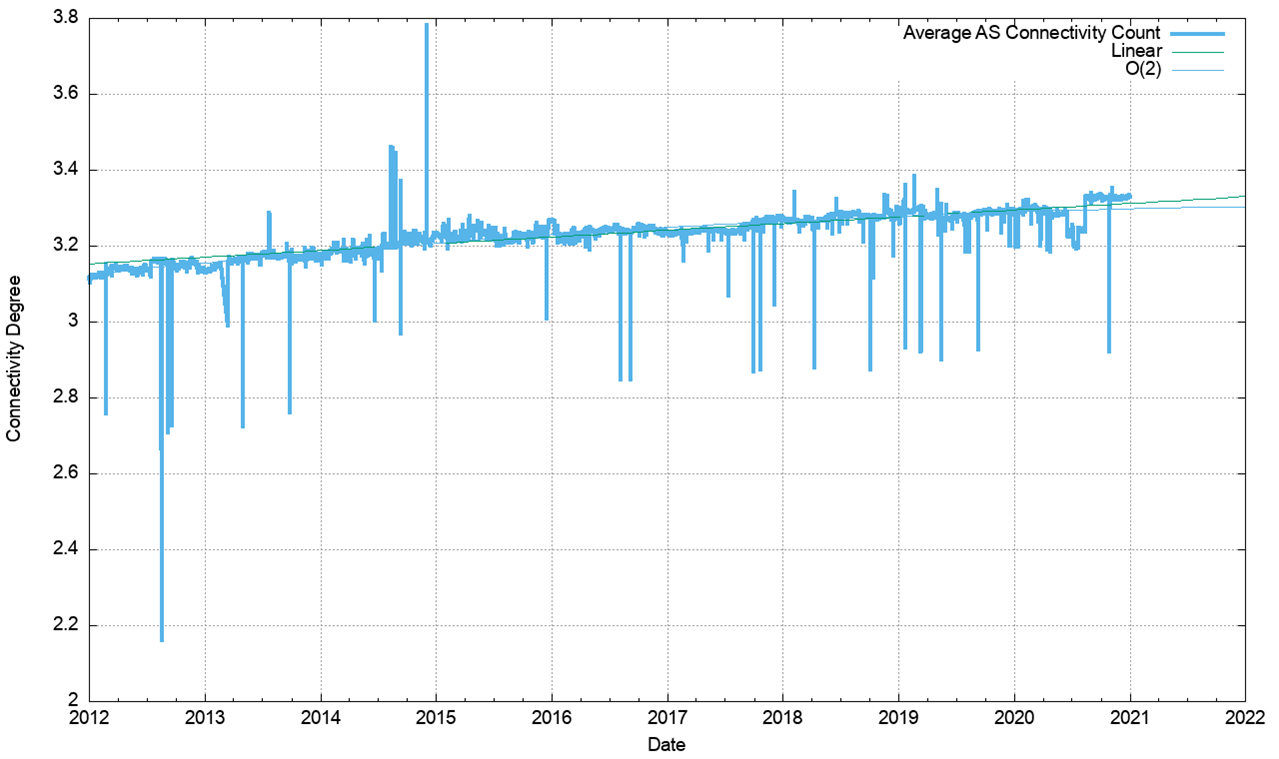
Figure 3 shows the total number of routes in the routing table over this period. This is a classic ‘up and to the right’ Internet trajectory, but it should be noted that growth trends in the Internet today are strongly aligned to a quite modest linear growth model.
The nine-year period since the start of 2012 has seen the span of addresses advertised in the routing system slowing down (Figure 4). However, at the same time there has been a consistent level of growth in the number of entries in the routing table.
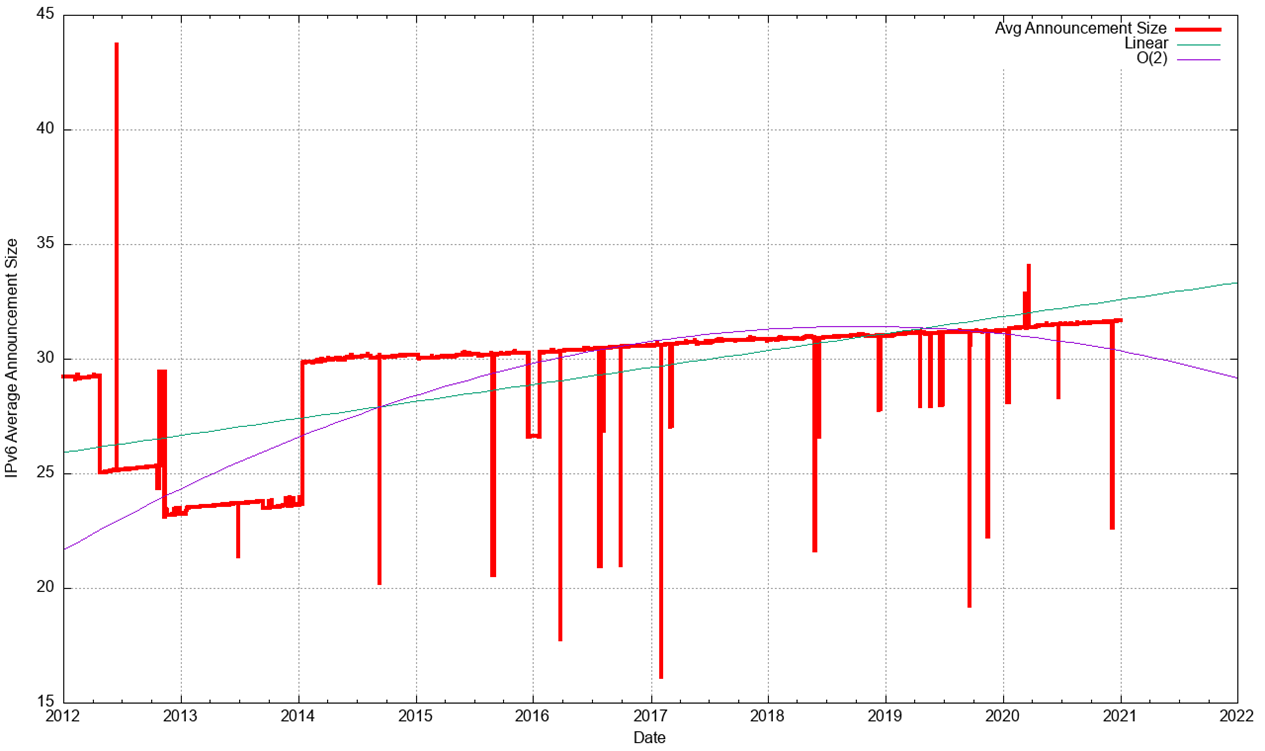
The result of these two factors is that the average announcement in the IPv4 routing table is spanning fewer addresses, or, to put it another way, the granularity of the IPv4 routing space is getting finer. As Figure 7 shows, the average BGP announcement size has dropped from 7,000 host addresses at the start of 2012 to 3,500 addresses at the end of 2020. These days some 90% of all announced prefixes are of size /20 or smaller.
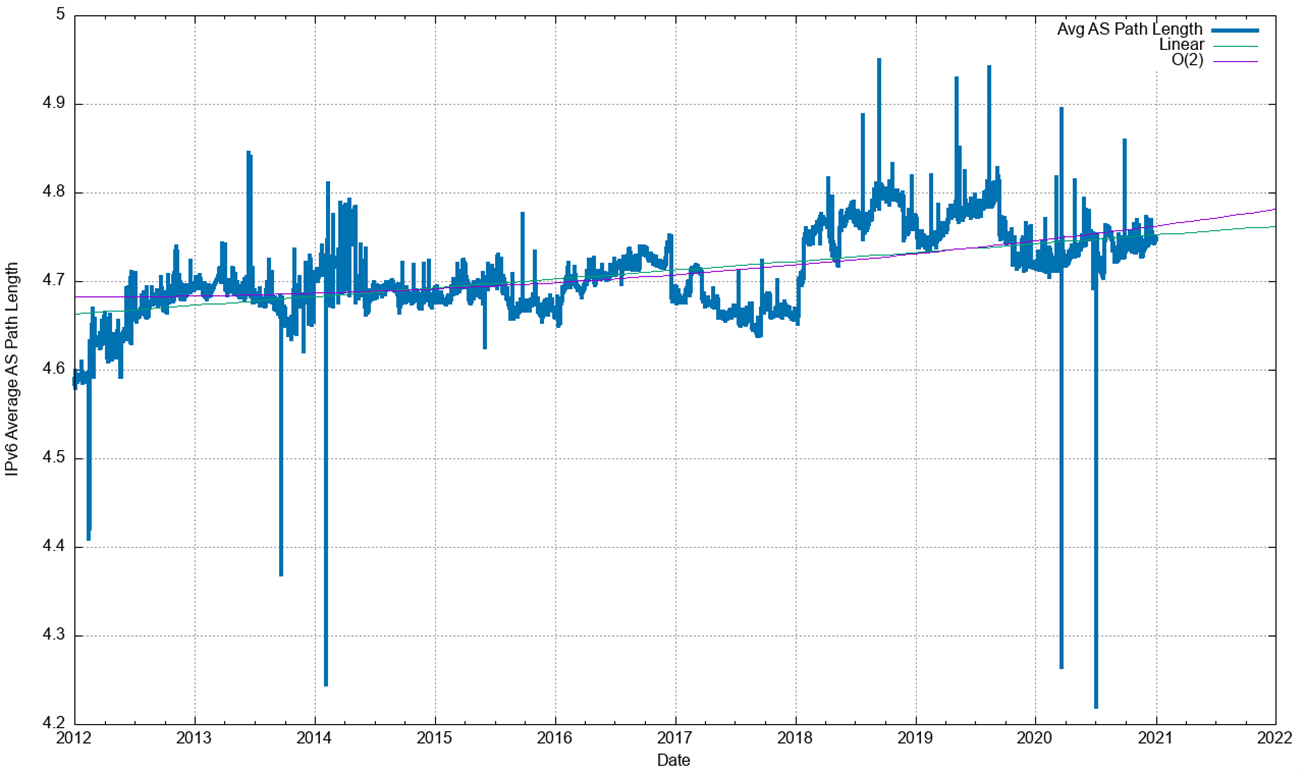
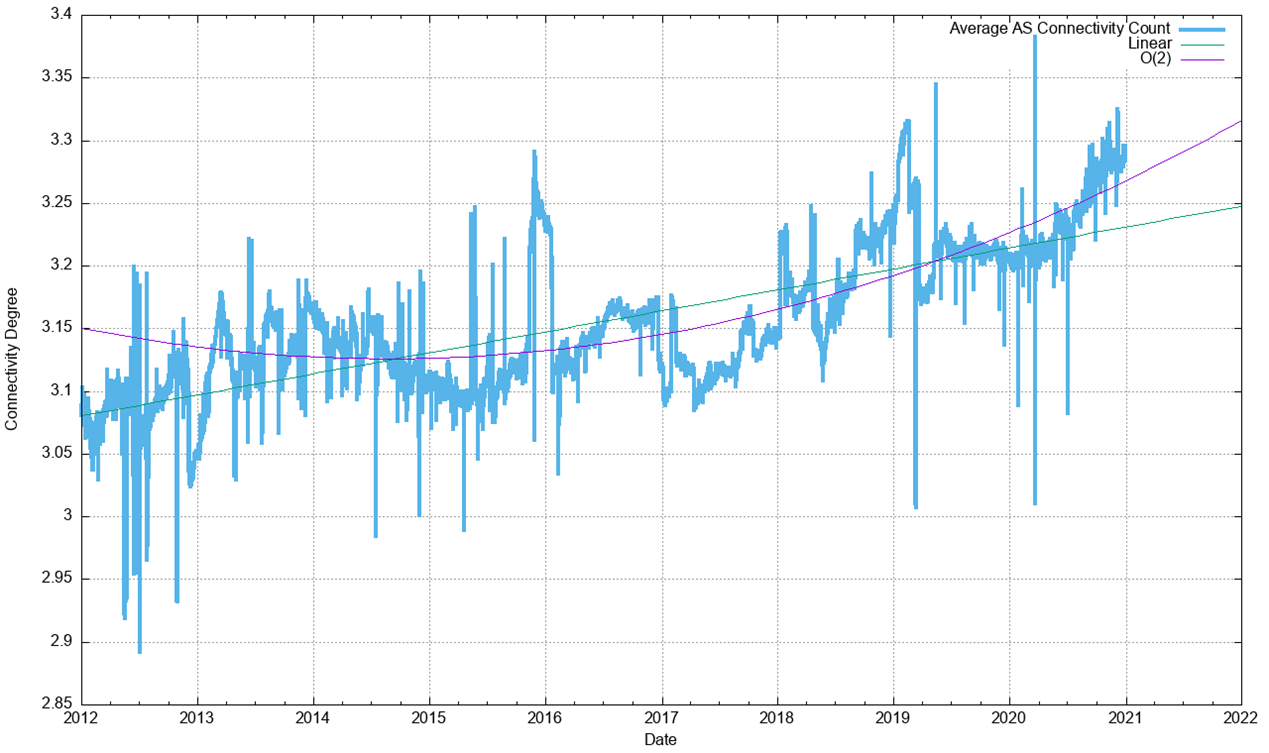
The topology of the network has remained relatively consistent with the growth of the Internet being seen as increasing density of interconnectivity rather than through extending transit paths, so the average AS path length has declined slightly for this period for this observation, as shown in Figure 9.
The year-by-year summary of the IPv4 BGP network over the 2017-2020 period is shown in Table 1.
| Routing Table | Growth | ||||||
| Jan-18 | Jan-19 | Jan-20 | Jan-21 | 2018 | 2019 | 2020 | |
| Prefix Count | 699,000 | 760,000 | 814,000 | 860,000 | 9% | 7% | 6% |
| Root Prefixes | 328,000 | 353,000 | 387,000 | 400,000 | 8% | 10% | 3% |
| More Specs | 371,000 | 407,000 | 427,000 | 460,000 | 10% | 5% | 8% |
| Address Span (/8s) | 169 | 169.3 | 169.8 | 171.4 | -1% | 0% | 1% |
| AS Count | 59,700 | 63,100 | 66,800 | 70,400 | 6% | 6% | 5% |
| Transit AS | 8,500 | 9,000 | 9,600 | 10,200 | 6% | 7% | 6% |
| Stub AS | 51,200 | 54,100 | 57,200 | 60,200 | 6% | 6% | 5% |
Table 1 — IPv4 BGP table growth profile
In terms of advertised prefixes, the size of the routing table continues to grow, but the 6% recorded through 2020 is slightly lower than the numbers seen for the previous two years. This observation supports a linear growth model of the routing table size, with a growth rate of, on average, 148 net increased prefixes per day for the year. The effect of increasing scarcity of IPv4 addresses is evident, with the span of advertised network increasing by a net of some 8 million end addresses through the year. The number of routed Stub AS numbers (new edge networks) grew by 5% in 2020, which is much the same as the prior two years.
It appears that the drivers for growth in the IPv4 BGP network in 2020 are now quite modest. It’s likely that we are seeing a number of factors at play:
- The first is the saturation of many Internet markets, so that the amount of ‘green field’ expansion is far lower than, say, a decade ago.
- Secondly, we are seeing considerable concentration on the service market, where the level of utilization of addresses is vastly greater by both content and service publishers and by end clients. The service and client numbers may be growing, but that does not necessarily imply the use of more addresses or more routing table entries.
- Thirdly this concentration in the service market has been accompanied by further consolidation in the access market, particularly in mobile access networks. This consolidation of client access networks creates greater efficiencies in shared address solutions.
- Finally, the continued deployment of IPv6 cannot be ignored. Within
the 10 economies with the largest span of advertised addresses (collectively,
these 10 economies advertise 96% of the span of advertised IPv4 addresses), six
of these are also in the 10 economies with the largest span of advertised IPv6
addresses (collectively, these 10 economies advertise 72% of the span of
advertised IPv6 addresses).
Looking at just these six economies, namely the United States, China, Japan, Germany, Brazil and the United Kingdom, they advertise 62% of the entire advertised IPv6 address span and 69% of the advertised IPv4 address span. The level of IPv6 use in these six economies have a greater leverage in the overall picture of IPv6 deployment than the global deployment level of 26% of end users systems would suggest.
Static growth?
As IPv4 addresses are being placed under increasingly higher scarcity pressure, the compensatory move is that the advertised address space being divided up into smaller units, and presumably this routing change is accompanied by the increasing use of IPv4 Network Address Translation (NAT) to accommodate the underlying network’s growth pressures.
The overall conclusion from this collection of observations is that the IPv4 network continues to grow, but as the supply of new addresses is slowing down, what is now becoming evident is more efficient use of addresses, which results in the granularity of the IPv4 inter-domain routing system becoming finer.
The density of inter-AS interconnection continues to increase. The growth of the Internet is not ‘outward growth from the edge’ as the network is not getting any larger in terms of average AS path change. Instead, the growth is happening by increasing the density of the network by attaching new networks into the existing transit structure and peering at established exchange points.
This makes for a network whose diameter — measured in AS hops — is essentially static, yet whose density — measured in terms of prefix count, AS interconnectivity and AS Path diversity — continues to increase. This denser mesh of interconnectivity could be potentially problematical in terms of convergence times if the BGP routing system used a dense mesh of peer connectivity, but the topology of the network continues along a clustered hub and spoke model, where a small number of transit ASs directly service a large number of stub edge networks. This implies that the performance of BGP in terms of time and updates required to reach convergence continues to be relatively static.
The IPv6 BGP Table Data
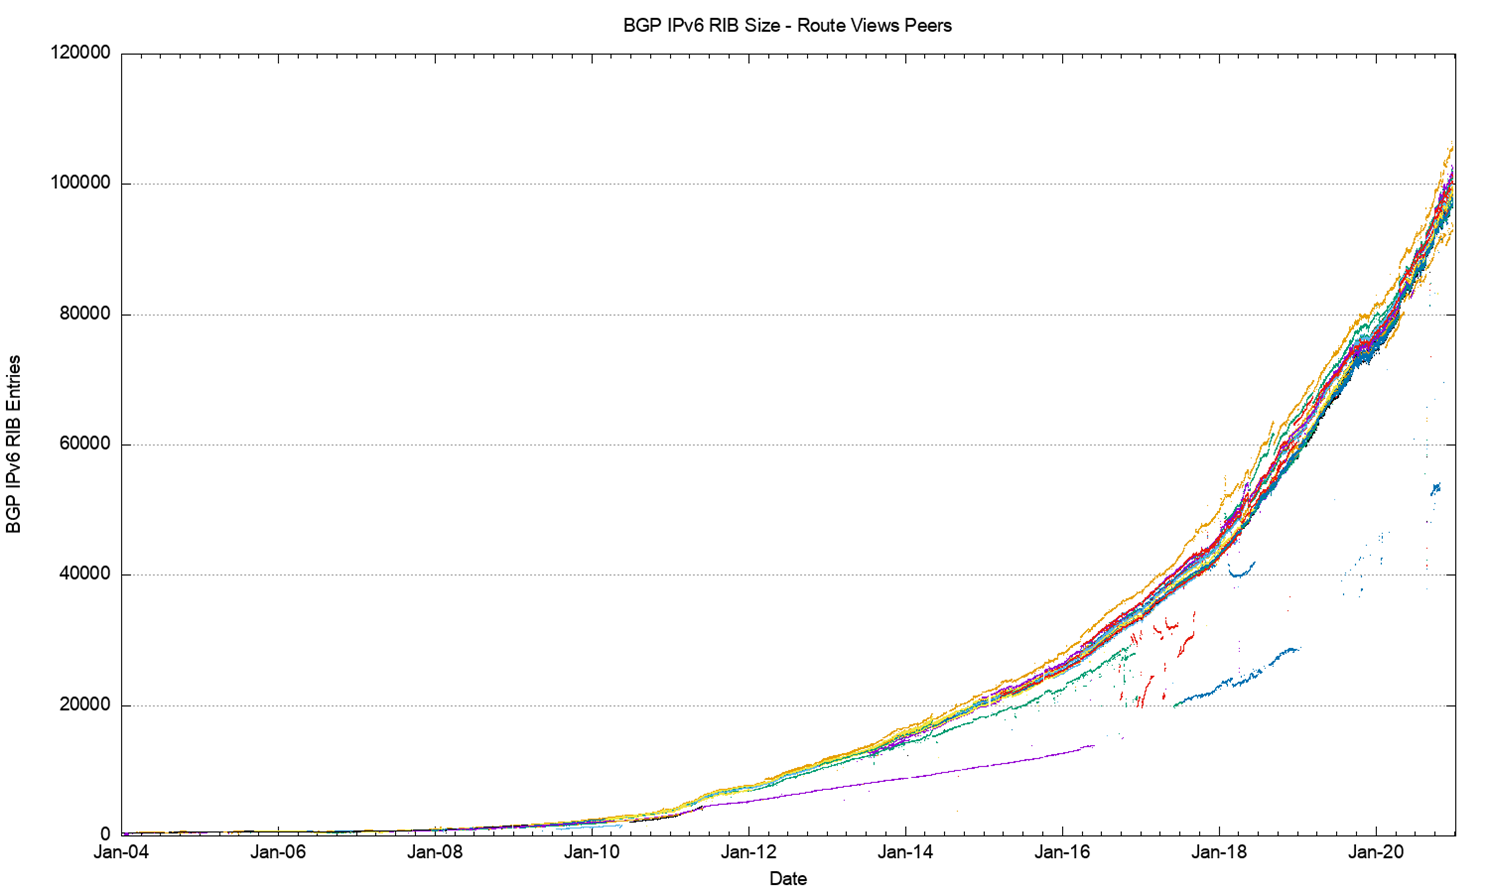
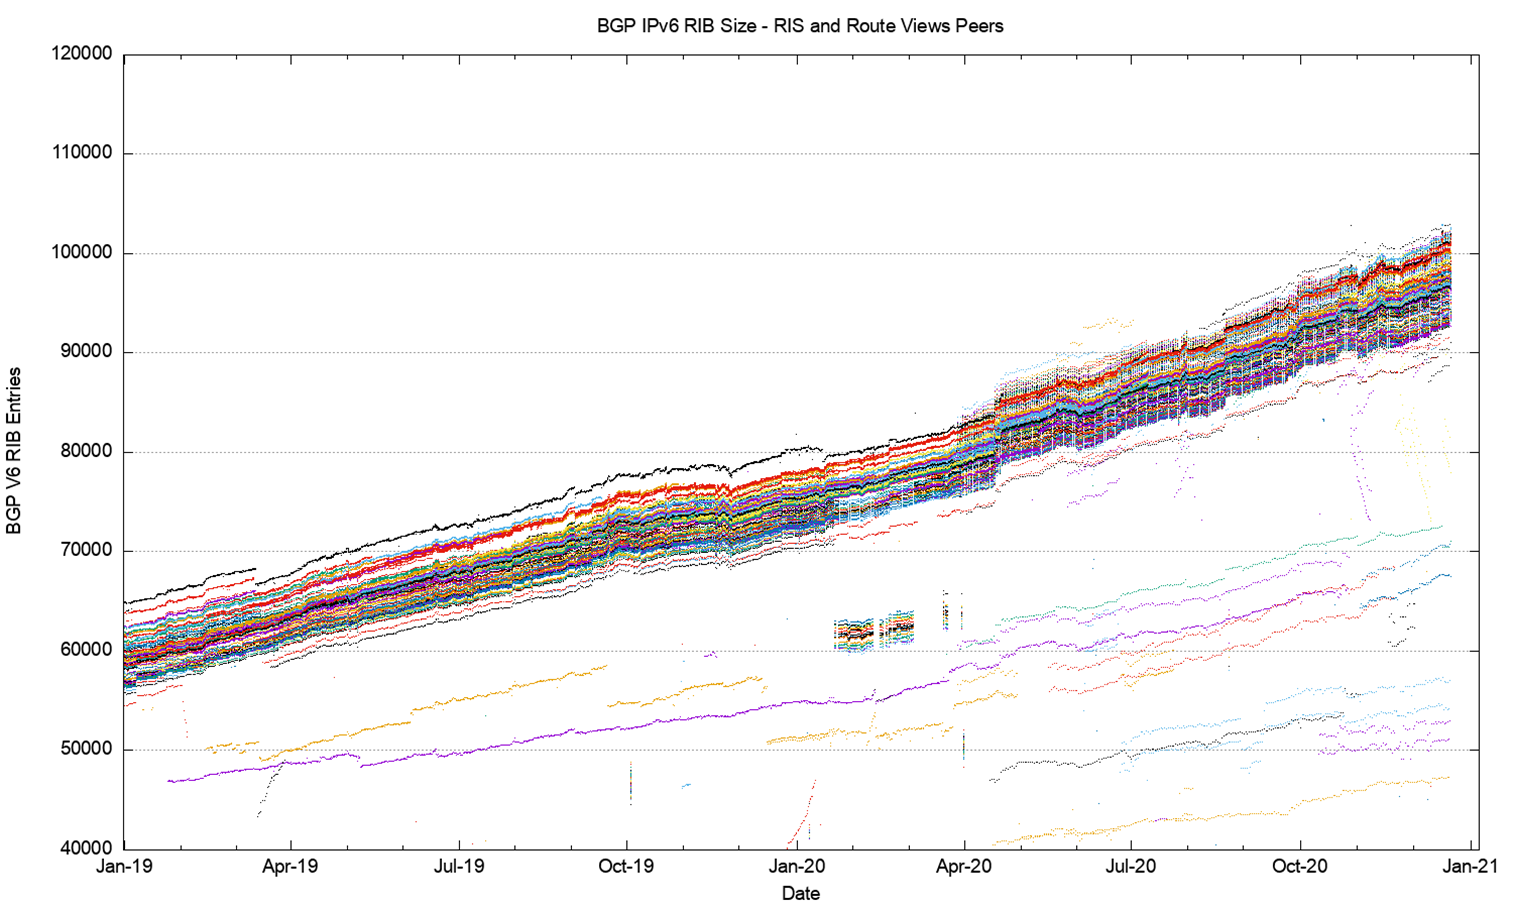
A similar exercise has been undertaken for IPv6 routing data. There is considerable diversity in the number of routes seen at various vantage points in the Internet, as shown when looking at the prefix counts advertised by all the peers of Route Views (Figure 13).
A more detailed look at 2019 and 2020 incorporating both Route Views and RIS (Figure 14) shows that in IPv6 there is no visible disparity in the route sets announced by RIS peers as compared to Route Views peers. It is also evident that there increasing diversity between various BGP views as to what constitutes the ‘complete’ IPv6 route set, and the variance at the end of 2020 now spans some 10,000 prefix advertisements.
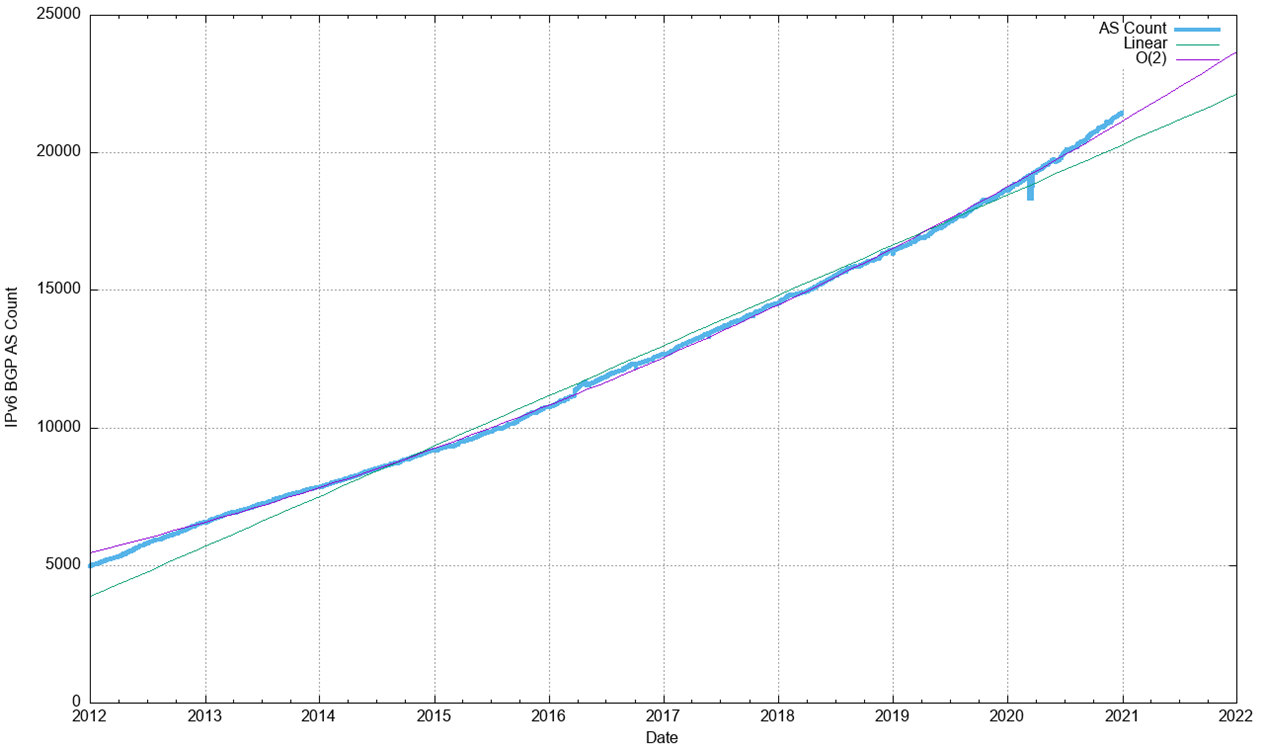
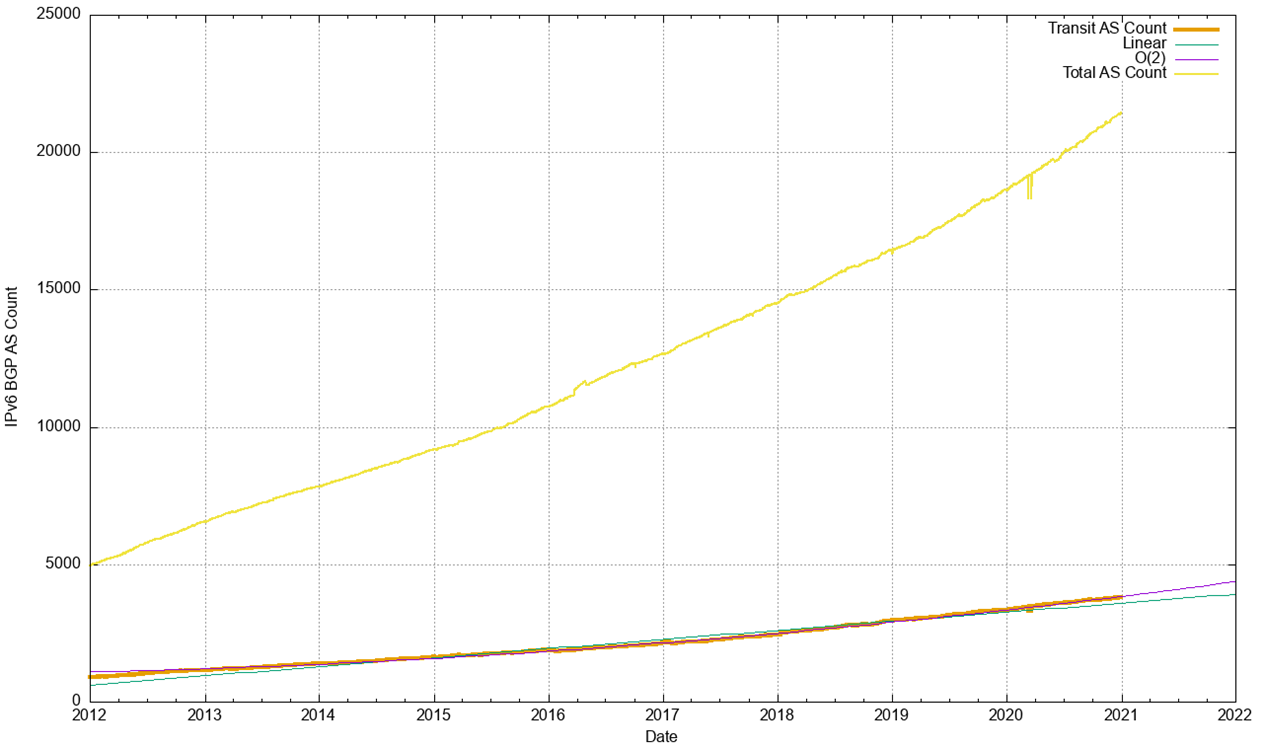
The comparable profile figures for the IPv6 Internet are shown in Figures 15 through 24.


Routing advertisements of /48s are the most prevalent prefix size in the IPv6 routing table (some 48% of all prefixes), and 75% of the table entries are composed of /48, /32, /44, and /40 prefixes.
RIR allocations of IPv6 addresses show a different pattern, with 75% of address allocations are either a /32 (52%) or a /29 (23%). Some 18% of allocations are a /48.
It’s evident that there is no clear correlation between an address allocation size and the advertised address prefix size, and many address holders do not advertise their entire allocated IPv6 address prefix in a single routing advertisement.
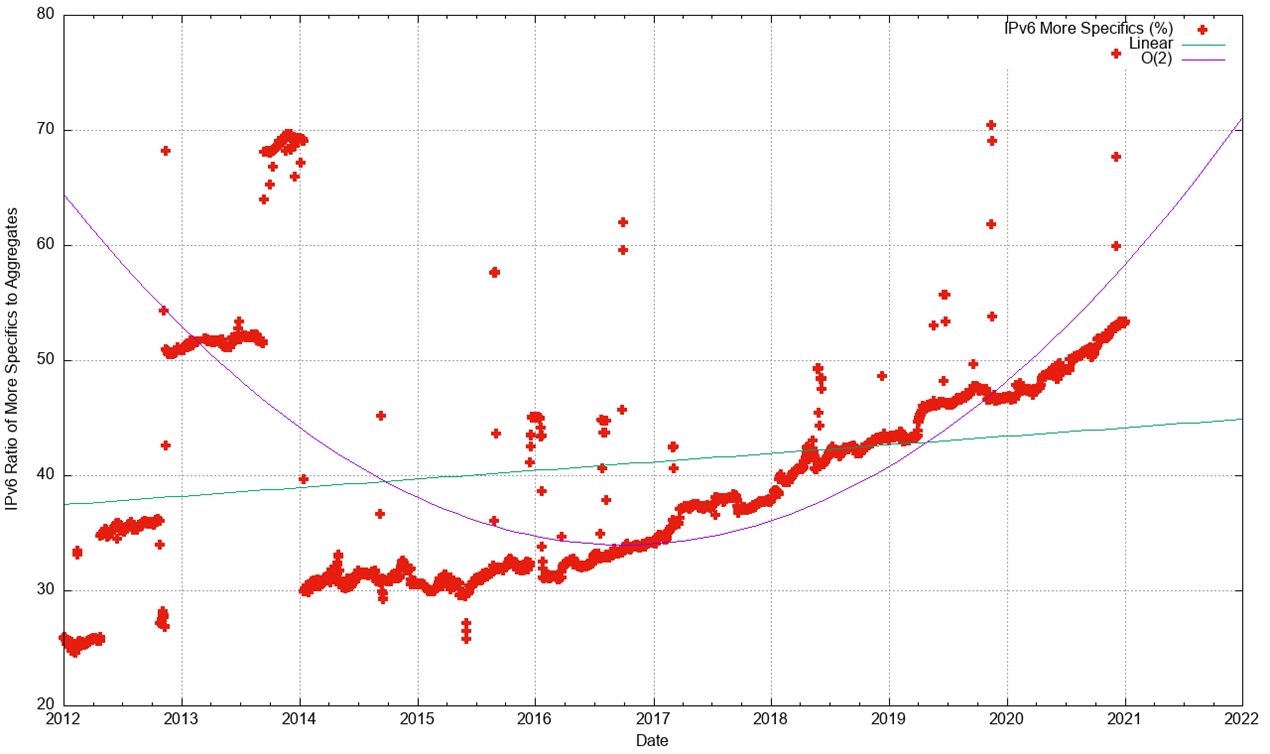
Why is the IPv6 routing table being fragmented so extensively?
The conventional response is that this is due to the use of more specific route entries to perform traffic engineering. However, given that IPv6 traffic volumes still tend to be far lower than IPv4 volumes for most networks, this rationale probably does not apply in all cases. Another possible reason is the use of more specifics to counter efforts of route hijacking.
This also has issues, given that it appears that most networks appear to accept a /64 prefix, and the deaggregated prefix is typically a /48, so as a countermeasure for more specific route hijacks it may not be all that effective.
Minimum accepted route object size
This brings up the related topic of the minimum accepted route object size. The common convention in IPv4 is that a /24 prefix advertisement is the smallest address block will propagate across the entire IPv4 default-free zone. More complex minimum size rules have largely fallen into disuse as address trading appears to be slicing up many of the larger address blocks into smaller sizes.
If a /24 is the minimum accepted route prefix size in IPv4, what is the comparable size in IPv6?
There appears to be no common consensus position here, and the default is to use no minimum size filter. In theory that would imply that a /128 would be accepted across the entire IPv6 default-free zone, but a more pragmatic observation is that a /32 would be assuredly accepted by all networks, and it appears that many network operators believe that a /48 is also generally accepted.
Given that a /48 is the most common prefix size in today’s IPv6 network, this belief appears to be the case. However, we also see prefixes smaller in size than a /48 in the routing table with /49, /52, /56 and /64 prefixes present in the IPv6 eBGP routing table.
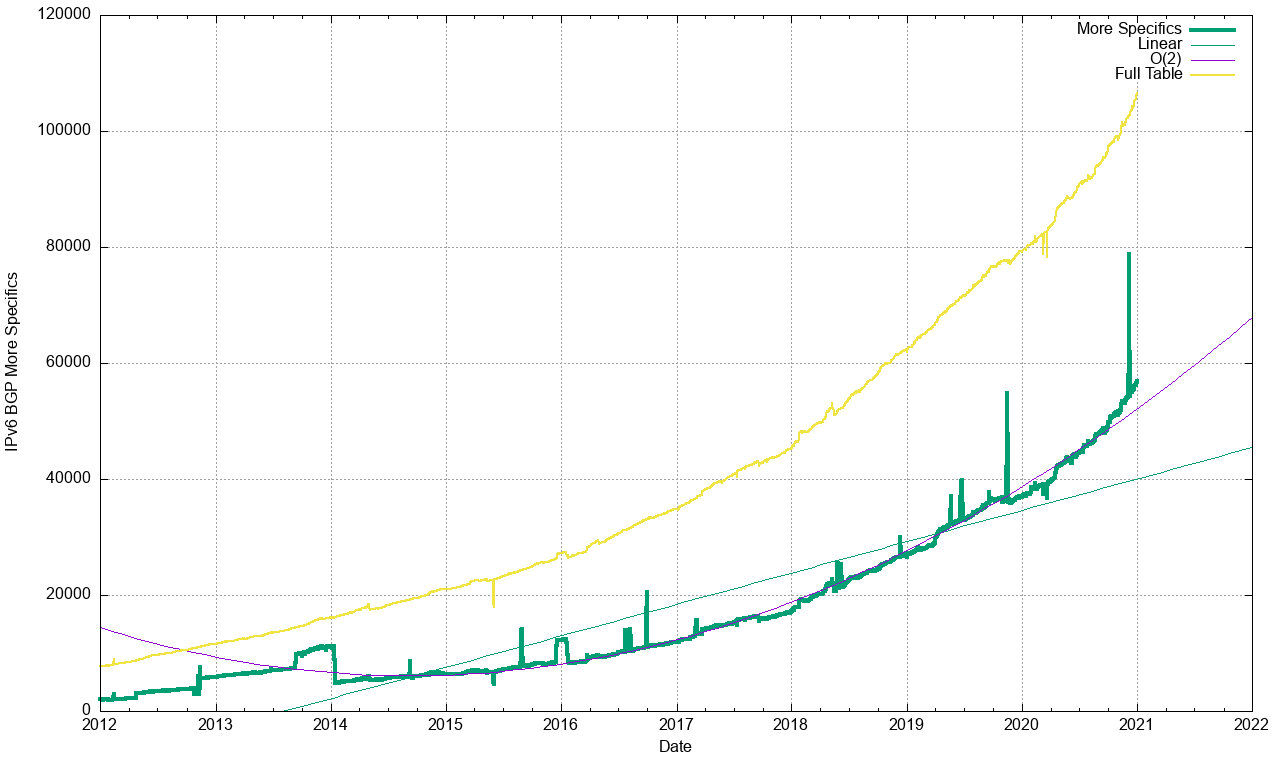
The summary of the IPv6 BGP profile for the period 2017 through to the start of 2021 is shown in Table 2. While the routing table grew significantly over 2020, the majority of that growth was in the announcement of more specifics rather than in announcing root address prefixes.
| Routing Table | Growth | ||||||
| Jan-18 | Jan-19 | Jan-20 | Jan-21 | 2018 | 2019 | 2020 | |
| Prefix Count | 45,700 | 62,400 | 79,400 | 105,500 | 37% | 27% | 33% |
| Root Prefixes | 28,200 | 35,400 | 42,300 | 49,200 | 26% | 19% | 16% |
| More Specifics | 17,500 | 27,000 | 37,100 | 56,300 | 54% | 37% | 52% |
| Address Span (/32s) | 102,700 | 124,900 | 133,800 | 132,000 | 22% | 7% | -1% |
| AS Count | 14,500 | 16,470 | 18,650 | 21,400 | 14% | 13% | 15% |
| Transit AS Count | 2,600 | 3,190 | 3,590 | 4,100 | 23% | 13% | 14% |
| Stub AS Count | 11,900 | 13,280 | 15,600 | 17,300 | 12% | 13% | 15% |
Table 2 — IPv6 BGP table growth profile
Predicting the future of BGP table size
What can this data from 2020 tell us in terms of projections of the future of BGP in terms of BGP table size?
Forecasting the IPv4 BGP Table
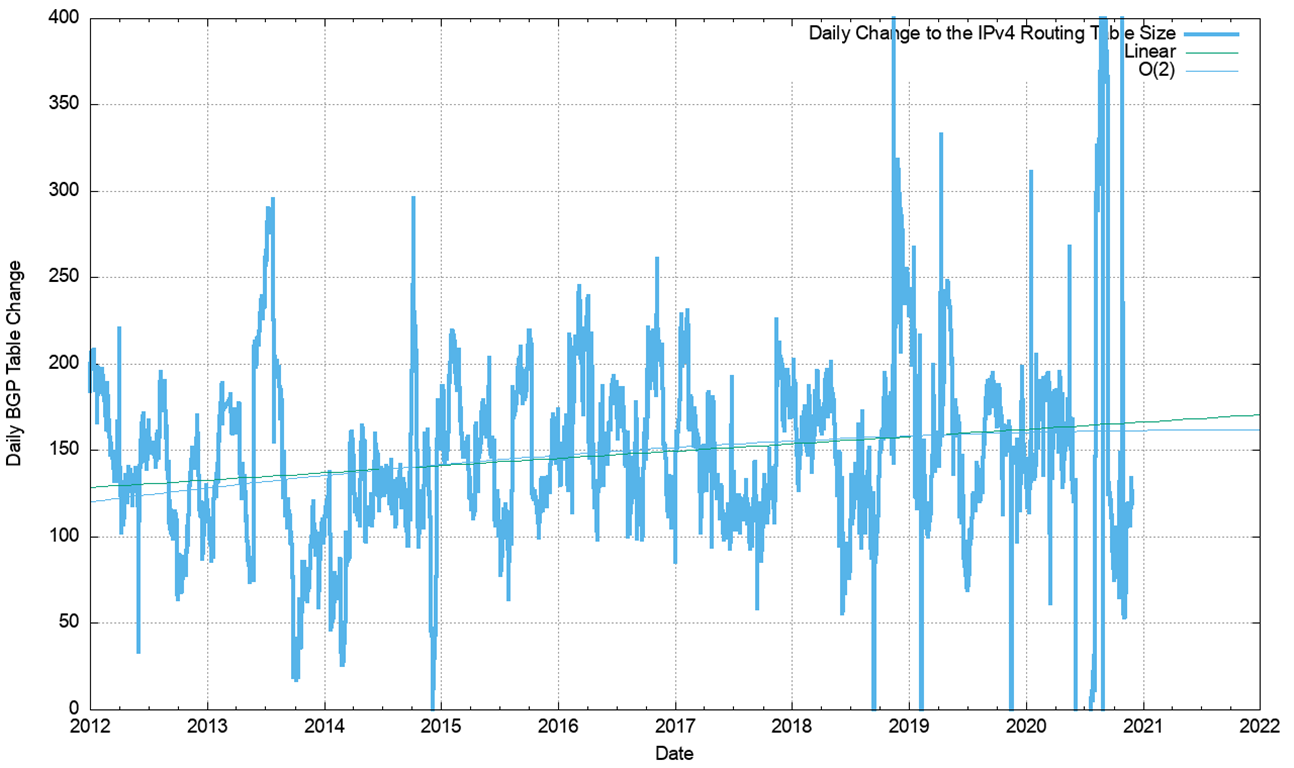
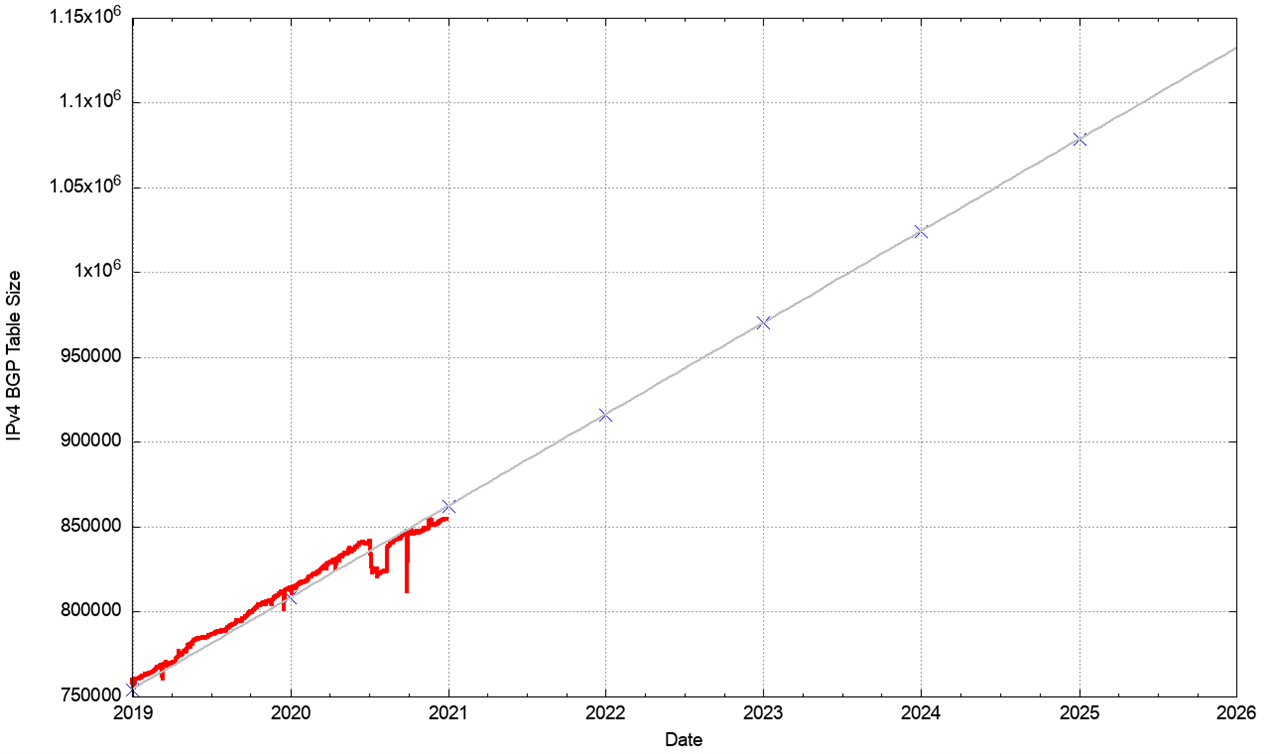
Figure 25 shows the data set for BGP from January 2012 until January 2021. This plot also shows the fit of these most recent four years of data to various growth models. The first order differential, or the rate of growth, of the BGP routing table is shown in Figure 26. The seven-year average rate of growth of the routing table appears to be rising slowly from 140 to 160 additional entries per day. This data suggests that a reasonable prediction of IPv4 BGP table size can be generated using a linear growth model of approximately 150 additional routing entries per day (Figure 27).
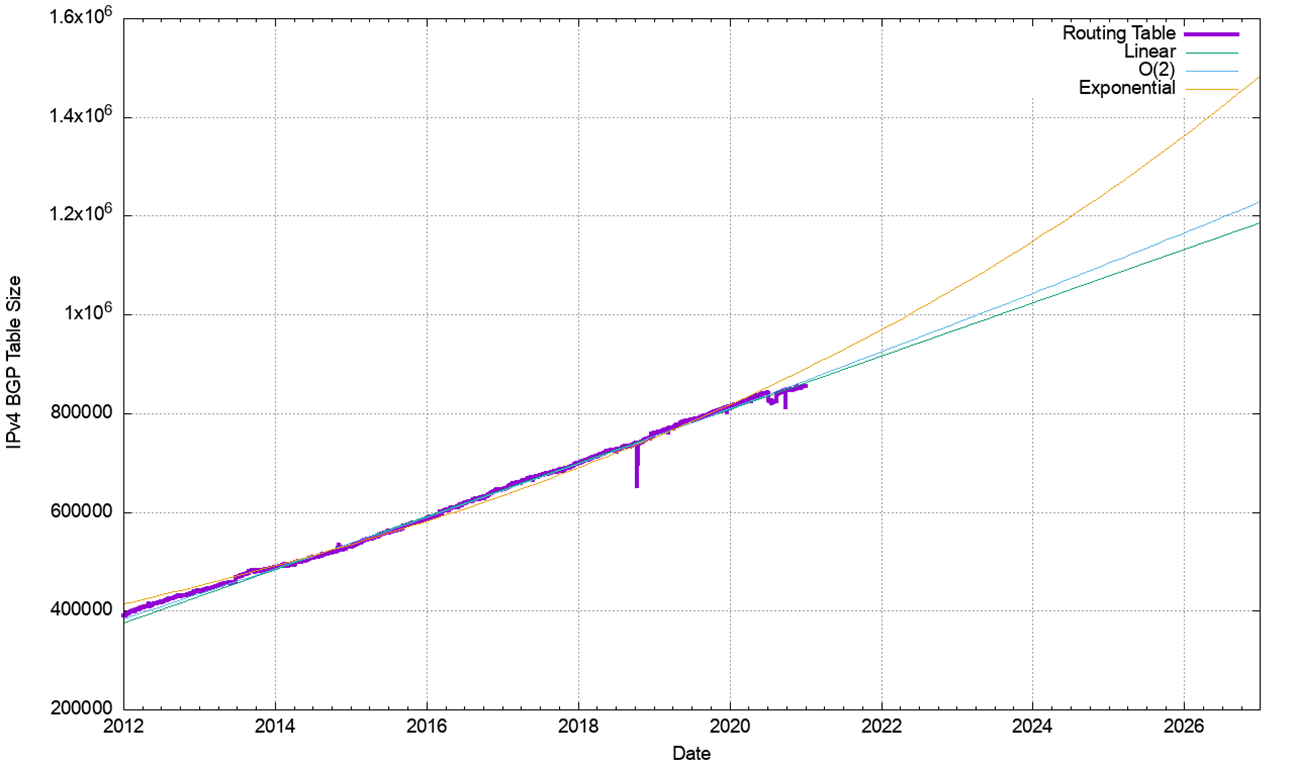
With the caveat that this prediction assumes tomorrow will be a lot like today and the influences that shape tomorrow have already shaped today, then it’s reasonable to predict that the IPv4 routing table five years from now, at the start of 2026, will contain an additional 250,000 entries, making a total for IPv4 of some 1,133,000 entries in the BGP IPv4 routing table at that time.
| IPv4 Table | Prediction | |
| Jan-15 | 530,000 | |
| Jan-16 | 587,000 | |
| Jan-17 | 646,000 | |
| Jan-18 | 699,000 | |
| Jan-19 | 760,000 | |
| Jan-20 | 814,000 | |
| Jan-21 | 866,000 | 862,000 |
| Jan-22 | 916,000 | |
| Jan-23 | 970,000 | |
| Jan-24 | 1,024,000 | |
| Jan-25 | 1,078,000 | |
| Jan-26 | 1,132,000 |
Table — IPv4 BGP table size prediction
It’s difficult to portray this prediction as reasonable under the current circumstances. Given that that last ‘normal’ year of supply of available IPv4 address to fuel continued growth in the IPv4 Internet was now over a decade ago in 2010, why has the growth of the IPv4 routing table persisted with such regularity?
It should be remembered that a dual stack Internet is not the objective in this time of transitioning the Internet to IPv6. The ultimate objective of the entire transition process is to support an IPv6-only network. An important part of the process is the protocol negotiation strategy used by dual stack applications, where IPv6 is the preferred protocol wherever reasonably possible. In a world of ubiquitous dual stack deployment all applications will prefer to use IPv6, and the expectation is that in such a world the use of IPv4 would rapidly plummet. The challenge for the past decade or more has been in attempting to predict when in time that tipping point that causes demand for IPv4 to plummet may occur. The assumption behind these predictions, predictions that have been made over the past twenty years, is that such a tipping point is at least five more years in the future from the time of the prediction. This may not be a reasonable assumption, but it’s been our informal working mode of operation through this period.
Forecasting the IPv6 BGP Table
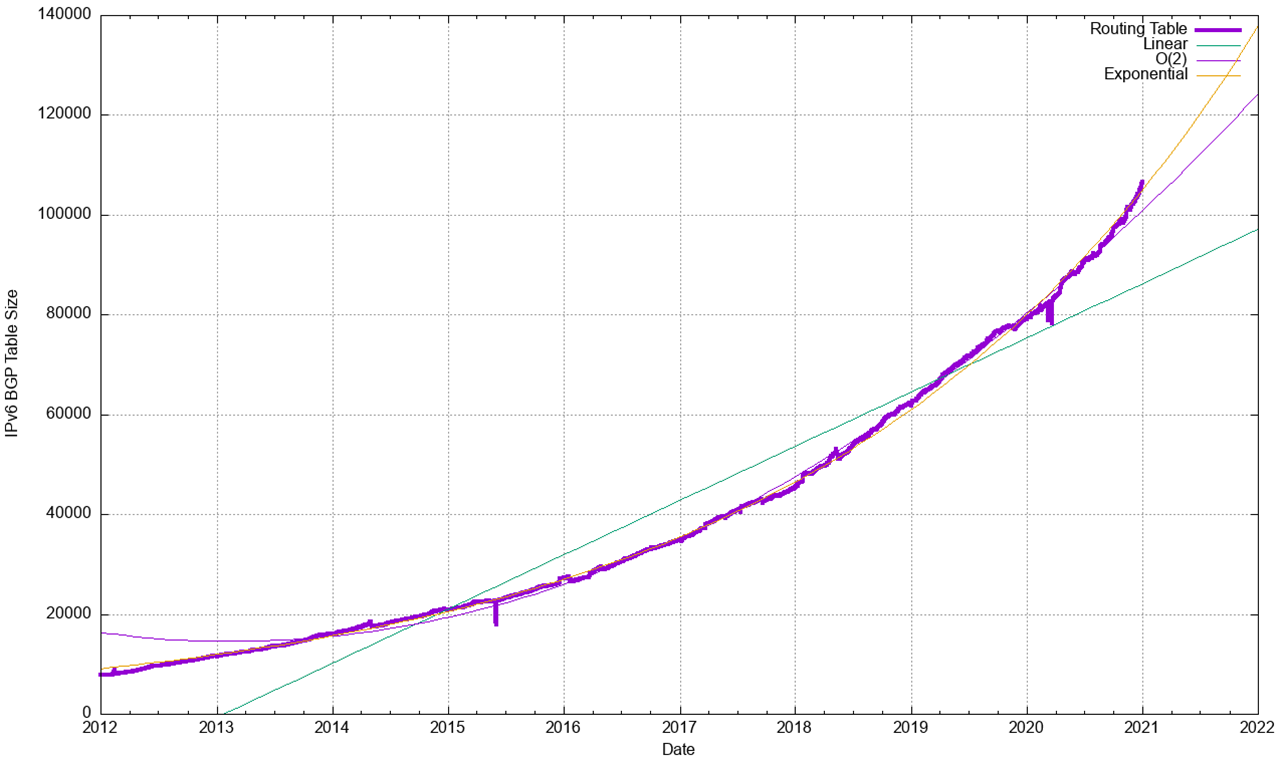
The same technique can be used for the IPv6 routing table. Figure 28 shows the data set for BGP from January 2010 until December 2020.
The first order differential, or the rate of growth of the IPv6 BGP routing table is shown in Figure 29. The number of additional routing entries has grown from 10 new entries per day at the start of 2012 to a peak of over 120 new entries per day at the end of 2020. Obviously, this is still lower than the equivalent figure in the IPv4 domain, which is growing by some 150 new entries per day, but it does show a consistent level of increasing growth.
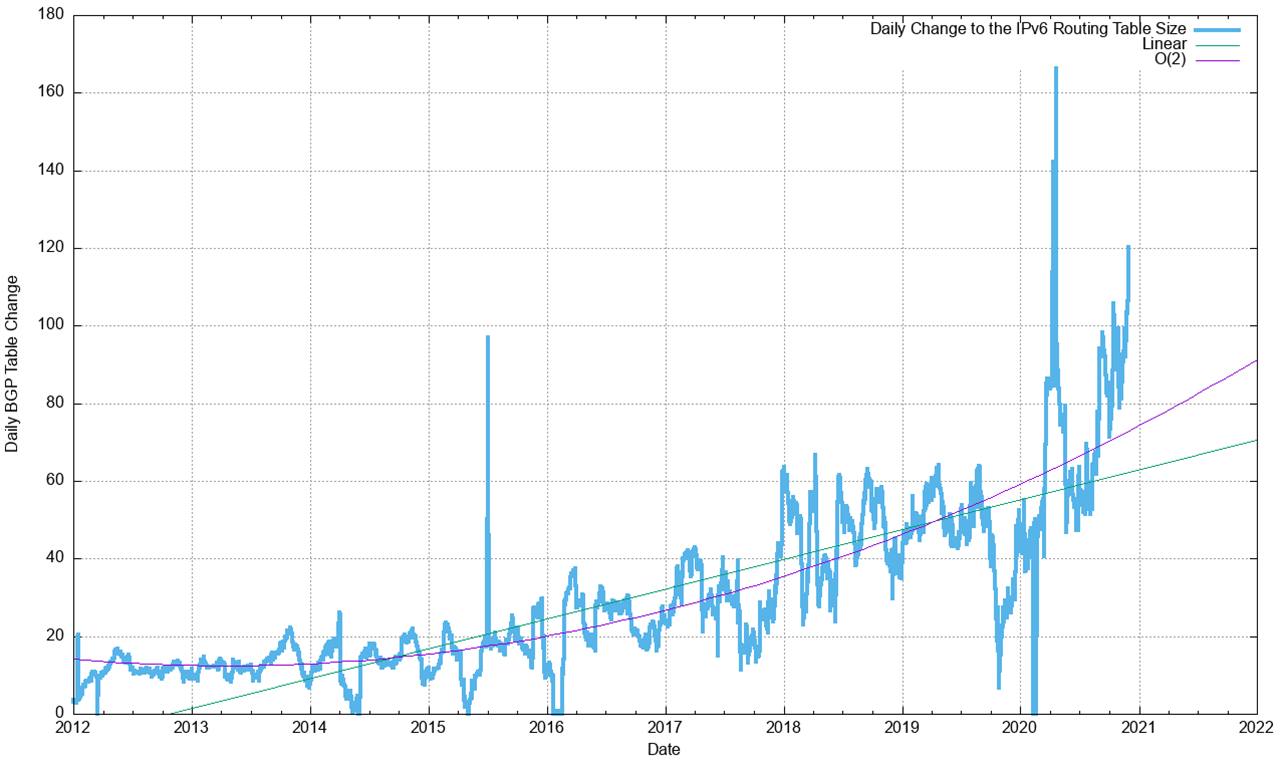
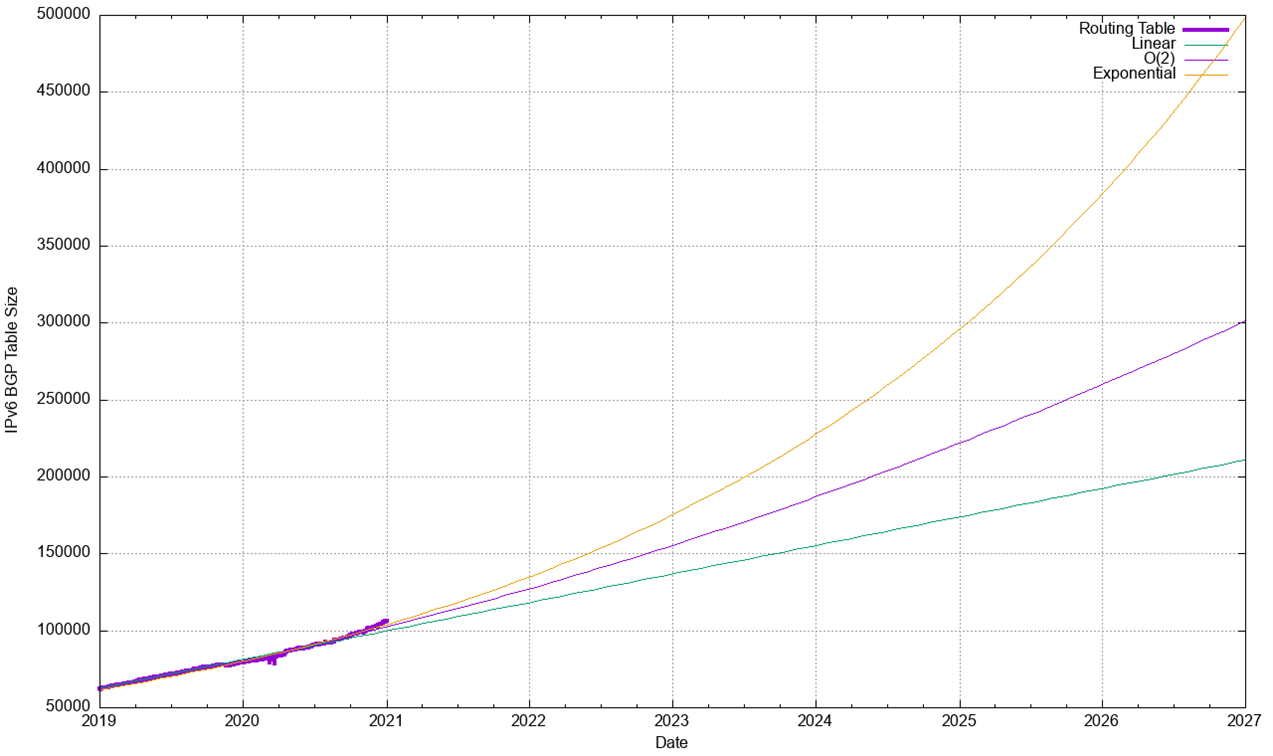
This implies that a linear growth model is inappropriate for modelling growth in IPv6. A better fit to the data is a compound growth model, with a doubling factor of some 24 months. It is possible to fit a linear model to the first order differential of the data, which can be used to derive an O(2) polynomial fit to the original data. The fit of a linear, O(2) polynomial and an exponential model of projected IPv6 table size is also shown in Figure 30.
The projections for the IPv6 table size are shown in Table 4.
| IPv6 Table | IPv6 Prediction | ||
| Linear | Exponential | ||
| Jan 2015 | 21,000 | ||
| Jan 2016 | 27,000 | ||
| Jan 2017 | 37,000 | ||
| Jan 2018 | 45,000 | ||
| Jan 2019 | 62,000 | ||
| Jan 2020 | 79,000 | ||
| Jan 2021 | 104,000 | 104,000 | 104,000 |
| Jan 2022 | 118,000 | 135,000 | |
| Jan 2023 | 136,000 | 175,000 | |
| Jan 2024 | 155,000 | 228,000 | |
| Jan 2025 | 174,000 | 296,000 | |
| Jan 2026 | 192,000 | 384,000 | |
Table 4 — IPv6 BGP table size prediction
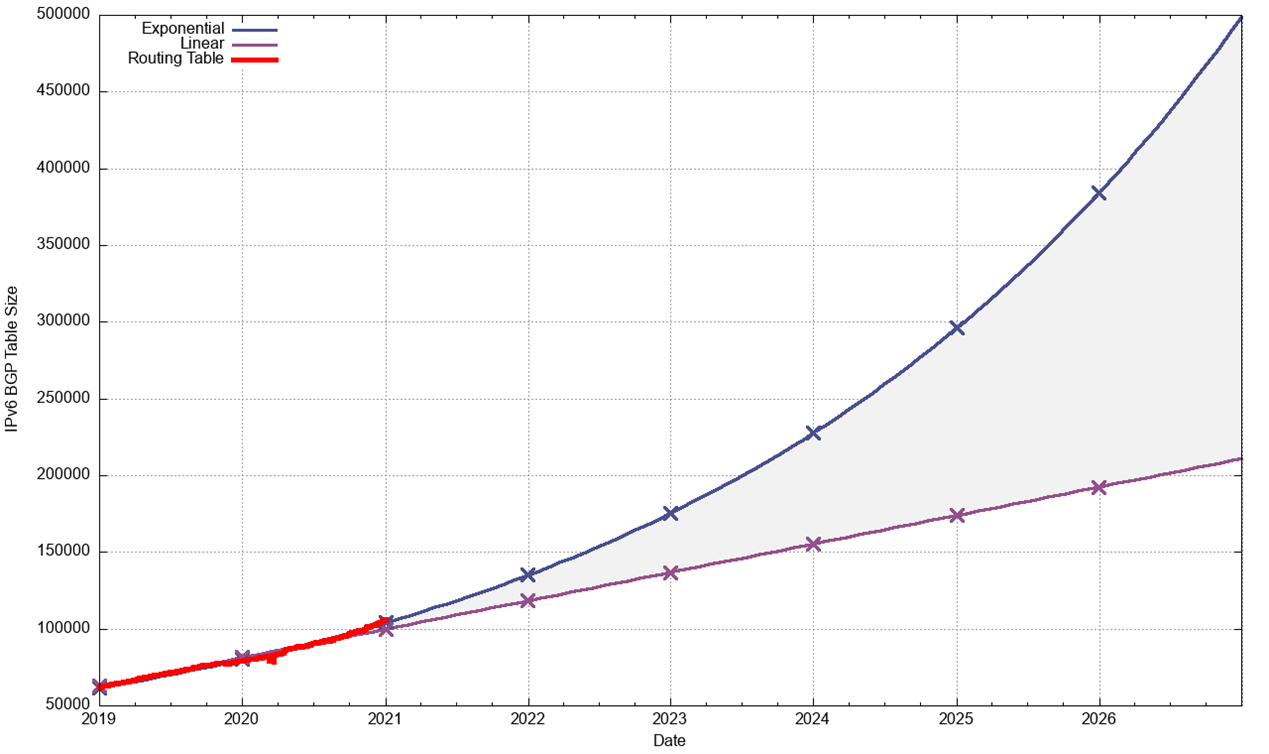
The linear and exponential projections in Table 4 provide a reasonable estimate of the low and high bounds of the growth of the IPv6 BGP routing table in the coming years.
If IPv6 continues to grow exponentially over the next five years, the size of the IPv6 routing table will be a little over a third of a million entries. In hardware terms, an IPv6 address prefix entry takes four times the memory of an IPv4 prefix, so the memory demands of the IPv6 forwarding table will exceed that used by the IPv4 forwarding table at this time.
Conclusions
These predictions for the routing system are highly uncertain. The correlation between network deployments and routing advertisements has been disrupted by the hiatus in the supply of IPv4 addresses, causing more recent deployments to make extensive use of various forms of address sharing technologies.
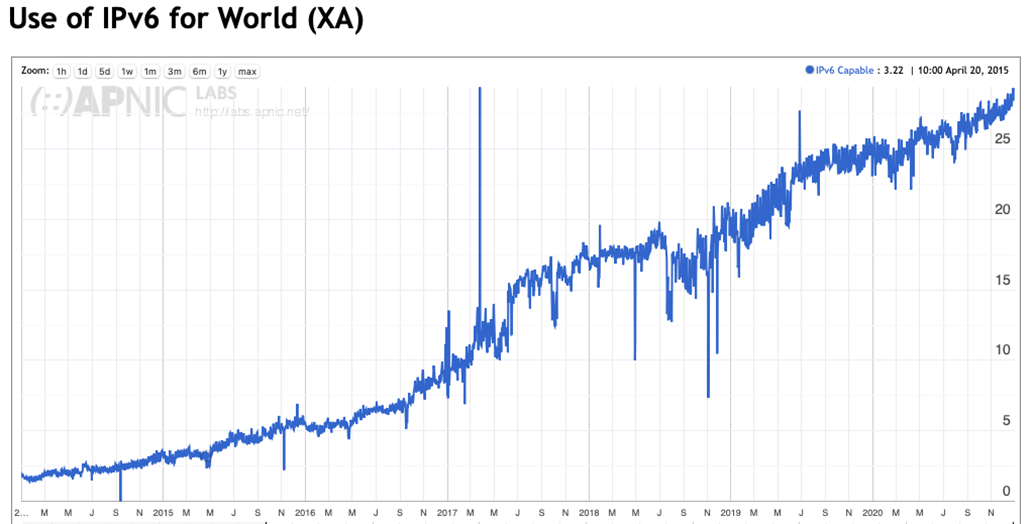
While a number of providers have made significant progress in public IPv6 deployments for their respective customer base, the majority of the Internet user base (some three quarters of the visible user base) is still exclusively using IPv4 as of the end of 2020 (Figure 31).
The views expressed by the authors of this blog are their own and do not necessarily reflect the views of APNIC. Please note a Code of Conduct applies to this blog.
Great
excellent insight. thanks for sharing.