

Time for another annual roundup from the world of IP addresses. Let’s see what has changed in the past 12 months in addressing the Internet and look at how IP address allocation information can inform us of the changing nature of the network itself.
Around 1992, the IETF gazed into their crystal ball and tried to understand how the Internet was going to evolve and what demands that would place on the addressing system as part of the ‘IP Next Generation’ study.
The staggeringly large numbers of connected devices that we see today were certainly within the range predicted by that exercise. Doubtless, these device numbers will continue to grow. We continue to increase silicon production volumes and at the same time continue to refine the production process.
Back then, we also predicted that the only way we could make the Internet work across such a massive pool of connected devices was to deploy a new IP protocol that came with a massively larger address space — from that reasoning, IPv6 was designed. This world of abundant silicon was the issue that IPv6 was primarily intended to solve. The copious volumes of address space were intended to allow us to uniquely assign a public IPv6 address to every such device, no matter how small, or in whatever volume they might be deployed.
Rate of deployment
But while the Internet has grown at such amazing rates, the deployment of IPv6 continues at a more measured pace. There is still no common sense of urgency about the deployment of this protocol, and still there is no common agreement that the continued reliance on IPv4 is failing us.
Much of the reason for this apparent contradiction between the designed population of the IPv4 Internet and the actual device count, which is of course many times larger, is that the Internet is now a client/server network.
Clients can initiate network transactions with servers but are incapable of initiating transactions with other clients. Network Address Translators (NATs) are a natural fit to this client/server model, where pools of clients share a smaller pool of public addresses, and only required the use of an address while they have an active session with a remote server. NATs are the reason why in excess of 20 billion connected devices can be squeezed into some 2 billion active IPv4 addresses. Applications that cannot work behind NATs are no longer useful and no longer used.
However, the pressures of this inexorable growth in the number of deployed devices in the Internet means that the even NATs cannot absorb these growth pressures forever. NATs can extend the effective addressable space by up to 32 ‘extra’ bits, and they can enable the time-based sharing of addresses. Both of these are effective measures in stretching the address space to encompass a larger device pool, but they do not transform the address space into an infinitely elastic resource.
The inevitable outcome of this process is that either we will see the fragmenting of the IPv4 Internet into several disconnected parts, so that the entire concept of a globally unique and coherent address pool layered over a single coherent packet transmission realm will be foregone, or we will see these growth pressures motivate the further deployment of IPv6, and the emergence of IPv6-only elements of the Internet, as it tries to maintain a cohesive and connected whole.
There are commercial pressures pulling the network in both of these directions, so it’s entirely unclear what path the Internet will follow in the coming years, but my (admittedly cynical and perhaps jaded) personal opinion lies in a future of a highly fragmented network.
Can address allocation data help us to shed some light on what is happening in the larger Internet? Let’s look at what happened in 2020.
IPv4 in 2020
It appears that the process of exhausting the remaining pools of unallocated IPv4 addresses is proving to be similarly protracted as the process of the transition to IPv6, although by the end of 2020 the end of the old registry allocation model was in sight, with the depletion of the residual pools of unallocated addresses in each of the RIRs.
It is increasingly difficult to talk about ‘allocations’ in today’s Internet. There are still a set of transactions where addresses are drawn from the residual pools of RIR-managed available address space and allocated or assigned to network operators. At the same time, there are also a set of transactions where addresses are traded between networks in what is essentially a sale. These address transfers necessarily entail a change of registration details, so the registry records the outcome of a transfer, or sale, in a manner that is similar to an allocation or assignment.
If we want to look at the larger picture of the amount of IPv4 address space that is used or usable by Internet network operators, then perhaps the best metric to use is the total span of allocated and assigned addresses, and the consequent indication of annual change in the change in this total address span.
What is the difference between ‘allocated’ and ‘assigned’?
When a network operator or sub-registry has received an allocation, it can further delegate that IP address space to customers, along with using it for their own internal infrastructure. When a network operator has received an assignment, this can only be used for their own internal infrastructure.
Read: Using address space – FAQs
I personally find the distinction between these two terms somewhat of an artifice these days, so from here on I’ll use the term ‘allocation’ to describe both allocations and assignments
The total IPv4 allocated address pool expanded by some 2.2 million addresses in 2020, on top of a base of 3.682 billion addresses that were already allocated at the start of the year. This represents a growth rate of 0.1% for the total allocated IPv4 public address pool. This is less that one tenth of the growth rate in 2010 (the last full year before the onset of the depletion of the unallocated IPv4 address pool).
| 2020 | 2019 | 2018 | 2017 | 2016 | 2015 | 2014 | 2013 | 2012 | 2011 | 2010 | 2009 | |
| Address Span (Billions) | 3.684 | 3.682 | 3.657 | 3.657 | 3.643 | 3.624 | 3.593 | 3.537 | 3.483 | 3.395 | 3.227 | 2.985 |
| Annual Change (Millions) | 2.2 | 24.9 | 0.6 | 13.2 | 19.4 | 30.6 | 55.9 | 53.9 | 88.4 | 168.0 | 241.7 | 189.4 |
| Relative Growth | 0.1% | 0.7% | 0.0% | 0.4% | 0.5% | 0.9% | 1.6% | 1.5% | 2.6% | 5.2% | 8.1% | 7.9% |
Table 1 — IPv4 allocated addresses by year
The record of annual change in allocations, per RIR, over the same period is shown in Table 2. There are some years when the per-RIR pool of allocated addresses shrunk is size. This was generally due to inter-RIR movement of addresses, due to administrative changes in some instances and inter-RIR address transfers in others.
| 2020 | 2019 | 2018 | 2017 | 2016 | 2015 | 2014 | 2013 | 2012 | 2011 | 2010 | 2009 | |
| APNIC | 1.7 | 10.5 | 0.4 | 3.2 | 6.7 | 7.4 | 4.6 | 1.2 | 0.6 | 101.0 | 119.5 | 86.9 |
| RIPE NCC | 0.4 | 12.0 | 0.3 | 3.7 | 4.1 | 4.7 | 33.8 | 1.0 | 37.8 | 40.5 | 52.3 | 43.4 |
| ARIN | -0.9 | -10.1 | -0.3 | -2.3 | -4.8 | 2.3 | -14.1 | 19.0 | 24.3 | 53.8 | 27.2 | 41.1 |
| LACNIC | 1.2 | 2.4 | 0.1 | 1.4 | 1.5 | 1.2 | 18.7 | 26.3 | 17.3 | 13.6 | 17.1 | 10.5 |
| AFRINIC | -0.2 | 10.1 | 0.2 | 7.1 | 11.9 | 15.0 | 12.8 | 6.3 | 8.5 | 9.4 | 8.8 | 5.9 |
| TOTAL | 2.2 | 24.9 | 0.7 | 13.1 | 19.4 | 30.6 | 55.8 | 53.8 | 88.5 | 218.3 | 224.9 | 187.8 |
Table 2 — IPv4 allocated addresses (millions). Distribution by RIR
Each of the RIRs are running through their final pools of IPv4 addresses. Some of the RIRs have undertaken address reclamation efforts during 2020, particularly in the area of re-designating previously ‘Reserved’ addresses as ‘Available’, notably in APNIC and LACNIC.
At the end of 2020, across the RIR system, there are some 6.2 million addresses in the available pool, mainly in APNIC (4 million) and AFRINIC (1.9 million). Some 12 million addresses are marked as reserved, with 5.5 million held by ARIN, some 2.8 million addresses held by AFRINIC and 2.5 million addresses held by APNIC. See Table 3.
| Available | Reserved | |||
| RIR | 2019 | 2020 | 2019 | 2020 |
| APNIC | 2,937,088 | 4,003,072 | 4,398,848 | 2,483,968 |
| RIPE NCC | 1,536 | 328,448 | 1,072,608 | 965,728 |
| ARIN | 4,096 | 4,352 | 6,137,600 | 5,509,888 |
| LACNIC | 50,688 | - | 1,416,448 | 266,240 |
| AFRINIC | 2,638,848 | 1,925,888 | 1,920,256 | 2,853,888 |
| TOTAL | 5,632,256 | 6,261,760 | 14,945,760 | 12,079,712 |
Table 3 — IPv4 available and reserved pools, December 2020
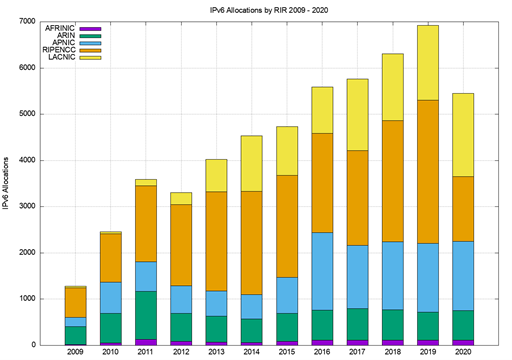
The RIR IPv4 address allocation volumes by year are shown in Figure 1.
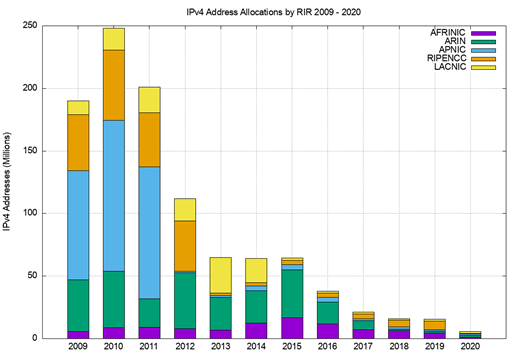
The number of RIR IPv4 address allocations by year are shown in Figure 2.
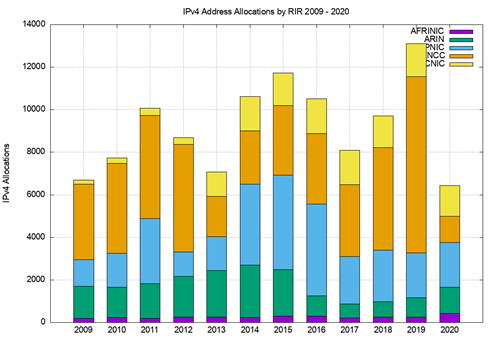
It is clear from these two figures that the average size of an IPv4 address allocation has shrunk considerably in recent years, corresponding to the various unallocated IPv4 pool depletion policies in each of the RIRs.
IPv4 Address Transfers
In recent years, the RIRs have permitted the registration of IPv4 transfers between address holders, allowing secondary re-distribution of addresses, as an alternative to returning unused addresses to the registry. This has been in response to the issues raised by the unallocated IPv4 pool depletion — where the underlying motivation was to encourage the reuse of otherwise idle or inefficiently used address blocks — through the incentives provided by a market for addresses, and to ensure that such address movement is publicly recorded in the registry system.
The registered transfer numbers in the past six years are shown in Table 4. This includes both inter-RIR and intra-RIR transfers. Each transfer is treated as a single transaction. In the case of inter-RIR transfers, this is accounted in the receiving RIR’s totals.
| Recieving RIR | 2020 | 2019 | 2018 | 2017 | 2016 | 2015 | 2014 | 2013 | 2012 |
| APNIC | 781 | 528 | 487 | 834 | 841 | 451 | 302 | 185 | 159 |
| RIPE NCC | 4,696 | 4,221 | 3,774 | 2,451 | 2,373 | 2,836 | 1,054 | 171 | 10 |
| ARIN | 94 | 68 | 26 | 26 | 22 | 3 | |||
| LACNIC | 3 | 2 | |||||||
| AFRINIC | 26 | 27 | 17 | ||||||
| Total | 5,600 | 4,844 | 4,306 | 3,311 | 3,236 | 3,290 | 1,356 | 356 | 169 |
Table 4 — IPv4 address transfers per year
A slightly different view is that of the volume of addresses transferred per year, shown in Table 5.
| Recieving RIR | 2020 | 2019 | 2018 | 2017 | 2016 | 2015 | 2014 | 2013 | 2012 |
| APNIC | 16.6 | 4.3 | 10.0 | 4.9 | 8.2 | 6.6 | 3.9 | 2.5 | 1.7 |
| RIPE NCC | 18.2 | 26.9 | 19.5 | 24.6 | 9.2 | 11.6 | 9.6 | 2.0 | 0.1 |
| ARIN | 0.2 | 0.3 | 0.2 | 0.3 | 0.1 | ||||
| LACNIC | |||||||||
| AFRINIC | 1.2 | 0.5 | 0.2 | ||||||
| Total | 36.2 | 31.9 | 29.7 | 29.7 | 17.6 | 18.2 | 13.6 | 4.5 | 1.7 |
Table 5 — Volume of transferred IPv4 addresses per year (millions of addresses)
A plot of these numbers is shown in Figures 3 and 4.
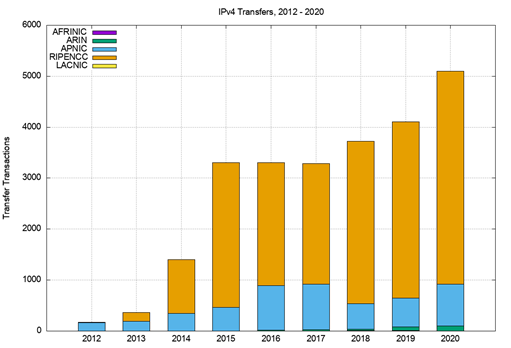

The aggregate total of addresses in the transfer logs, since 2012, is some 150 million addresses, or the equivalent of 9 /8s, which is some 4% of the total delegated IPv4 address space of 3.7 billion addresses.
This data raises some questions about the nature of transfers.
The first question is whether address transfers have managed to be effective in dredging the pool of allocated, but unadvertised, public IPv4 addresses.
It was thought that by being able to monetize these addresses, holders of such addresses may have been motivated to convert their networks to use private addresses and resell their holding of public addresses. In other words, the opening of a market in addresses would provide incentive for otherwise unproductive address assets to be placed on the market. Providers who had a need for addresses would compete with other providers who had a similar need in bidding to purchase these addresses.
In conventional market theory, the most efficient user of addresses (here, ‘most efficient’ is based on the ability to use addresses to generate the greatest revenue) would be able to set the market price. Unused addresses would be put to productive use and, as long as demand outstrips supply, the most efficient use of addresses is promoted by the actions of the market. In theory.
However, the practical experience with transfers is not so clear.
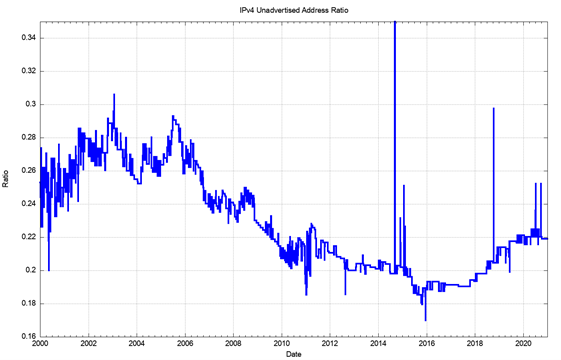
The data relating to address recycling is inconclusive. Between 2011 and late 2017, the pool of unadvertised addresses sat between some 43 and 44 /8s. This pool of unadvertised addresses rose from the start of 2018 and by the end of 2020 there were just under 50 /8s that were unadvertised in the public Internet. Rather than reducing the pool of unused (unadvertised) addresses, this pool appears to be expanding in size over the past 36 months. See Figure 5.
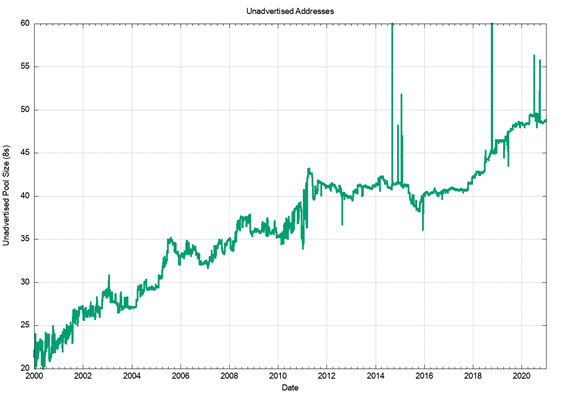
In relative terms, expressed as a proportion of the total pool of allocated IP addresses, the unadvertised address pool dropped from 28% of the total allocated address pool in 2011 to a low of some 24% at the start of 2016, and subsequently rose to 29% by the end of 2020. This data points to the conclusion that address transfer activity has not made a substantial change in the overall picture of address utilization efficiency in the past 12 months. See Figure 6.
Perhaps there is a slightly broader conclusion that can be drawn from this data. We have probably not yet reached that point of true scarcity of IPv4 addresses where the degree of over-reach of need versus supply would cause us to look under every rock and reach deep within every cranny.
The market price for IPv4 addresses for sale is at best sluggish in terms of price movement and the pool of unadvertised IPv4 addresses is increasing in size. The total volume of transferred addresses has dropped by 50% over the 2017-2018 volumes for the past two years.
We have seen this industry react with a fervour close to hysteria when competitive pressures are bought to bear on a finite resource, as we’ve seen in various public auctions of spectrum space. The almost lackadaisical industry reaction to the unallocated IPv4 pool depletion issue tends to suggest that whatever else this protracted transition might be, it is not seen as a crisis in any way or shape.
There is a slightly different aspect to this question, concerning whether the transferred addresses are being traded as a speculative good.
One way to provide some insight into answering this question is to look at the age of transferred addresses. Are such addresses predominately recently allocated addresses, or are they longer-held addresses where the holder is wanting to realise the inherent value in otherwise unused assets? The basic question concerns the age distribution of transferred addresses where the age of an address reflects the period since it was first allocated or assigned by the RIR system.
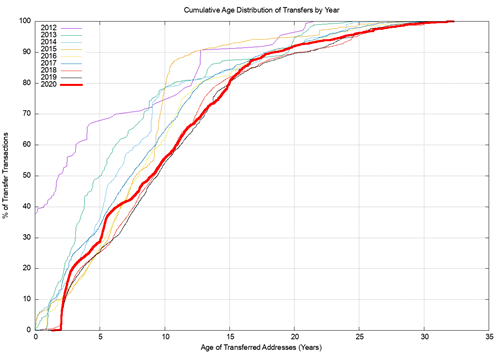
The cumulative age distribution of transferred addresses by transaction is shown on a year-by-year basis in Figure 7. In 2012, some 70% of the transferred address blocks were originally assigned or allocated by an RIR within the previous 10 years. In 2020, some 50% of these transactions relate to addresses that were originally allocated by an RIR in the previous 10 years.
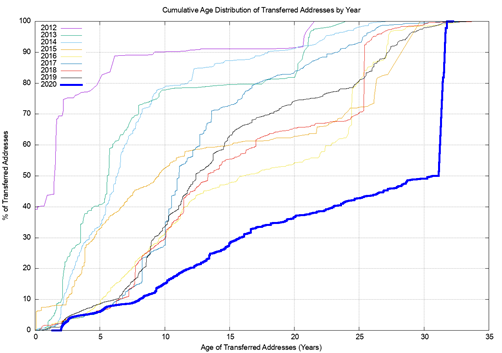
By volume, the overall majority of transferred addresses (some 50% of all transferred addresses) were drawn from legacy address holders, as shown in Figure 8.
The comparison of Figures 7 and 8 also leads to the observation that the transfers of older address blocks have far larger address spans, which corresponds to the very early IPv4 address allocations of /8 and /16 prefixes.
The second question is whether the transfer process is further fragmenting the address space by splitting up larger address blocks into successively smaller address blocks.
There are 24,769 transactions described in the RIRs’ transfer registries from the start of 2012 until the start of 2021. Of these, 17,184 entries list transferred address blocks that are the same size as the original allocated block. The remaining 7,585 entries are fragments of the originally allocated address blocks.
These 7,585 transfer entries that have fragmented the original allocation are drawn from 4,687 such original allocations. On average, the original allocation is split into 1.6 smaller address blocks. This data implies that address blocks are being fragmented because of address transfers, but in absolute terms this is not a major issue. There are 217,992 distinct address allocations from the RIRs to end entities as of the end of 2020, and the fragmentation reflected in 7,585 of these address blocks is around 3% of the total pool of allocated address prefixes.
The third question concerns the inter-economy flow of transferred addresses. Using the RIR-published transfer data for 2020, let’s look at the ten economies which:
- Sourced the greatest volume of transferred addresses, irrespective of their destination (that is, including domestic transfers within the same economy), seen in Table 6
- Had the ten largest recipients of transfers, Table 7
- Had the ten largest economy-to-economy address transfers, Table 8
| Rank | CC | Addresses | Economy |
| 1 | AU | 13.5 | Australia |
| 2 | CN | 6 | China |
| 3 | GB | 3.6 | United Kingdom of Great Britain and Northern Ireland |
| 4 | RU | 3.2 | Russian Federation |
| 5 | US | 2.7 | United States of America |
| 6 | JP | 0.9 | Japan |
| 7 | IN | 0.6 | India |
| 8 | IR | 0.6 | Iran |
| 9 | NL | 0.6 | Netherlands |
| 10 | BG | 0.5 | Bulgaria |
Table 6 — Top 10 source economies providing transferred IPv4 addresses in 2020(millions of addresses)
| Rank | CC | Addresses | Destination Economy |
| 1 | SG | 17.1 | Singapore |
| 2 | RU | 2.6 | Russian Federation |
| 3 | US | 2.5 | United States of America |
| 4 | GB | 2.1 | United Kingdom of Great Britain and Northern Ireland |
| 5 | CN | 2 | China |
| 6 | DE | 1.4 | Germany |
| 7 | ES | 1.1 | Spain |
| 8 | JP | 1 | Japan |
| 9 | HK | 0.8 | Hong Kong Special Administrative Region of China |
| 10 | AU | 0.7 | Australia |
Table 7 — Top 10 economies receiving transferred IPv4 addresses in 2020
Notable in 2020 is the transfer of a large collection of addresses (43.0.0.0/9) in August 2020 from APIDT (the Asia Pacific Internet Development Trust) to ‘Alibaba.com Singapore E-Commerce’. Several other address transfers in 2020 have been to Huawei International, also registered in Singapore. This use of Singapore as an economy of registration for large multinational enterprises with strong associations to Chinese entities probably lies behind the relatively small volume of address transfers into China and the large volume into Singapore in 2020.
| Rank | From | To | Addresses (M) | Source | Destination |
| 1 | AU | SG | 12.6 | Australia | Singapore |
| 2 | CN | SG | 4.2 | China | Singapore |
| 3 | RU | RU | 2.4 | Russian Federation | Russian Federation |
| 4 | GB | GB | 1.8 | United Kingdom | United Kingdom |
| 5 | CN | CN | 1.5 | China | China |
| 6 | GB | US | 1.3 | United Kingdom | United States of America |
| 7 | JP | JP | 0.7 | Japan | Japan |
| 8 | IN | IN | 0.6 | India | India |
| 9 | ES | ES | 0.5 | Spain | Spain |
| 10 | DE | DE | 0.4 | Germany | Germany |
| 11 | AU | AU | 0.4 | Australia | Australia |
| 12 | BG | BG | 0.4 | Bulgaria | Bulgaria |
| 13 | IR | IR | 0.4 | Iran | Iran |
| 14 | US | DE | 0.4 | United States of America | Germany |
| 15 | SE | SE | 0.4 | Sweden | Sweden |
| 16 | US | US | 0.3 | United States of America | United States of America |
| 17 | US | CN | 0.3 | United States of America | China |
| 18 | HK | HK | 0.3 | Hong Kong | Hong Kong |
| 19 | FI | FI | 0.2 | Finland | Finland |
| 20 | IT | IT | 0.2 | Italy | Italy |
Table 8 – Top 20 economy-to-economy IPv4 address transfers in 2020
The 2020 transfer logs contain 3,132 domestic address transfers, with a total of 8,360,064 addresses, with the largest activity in domestic transfers in Russia, the United Kingdom and China. 1,971 transfers appear to result in a movement of addresses between economies, involving a total of 17,990,400 addresses.
It appears that the IPv4 address supply hiatus has motivated most Internet service providers to use address sharing technologies such as Carrier Grade NAT (CGN) on the access side, and name-based server pooling on the content side, as a means of increasing the level of sharing of addresses. This has been accompanied by a universal shift in the architecture of the Internet to a client/server model.
The result is that the pressure on the IPv4 address space has been relieved to a considerable extent, and the sense of urgency to migrate to an all-IPv6 network has been largely, but not completely, mitigated over this period.
The outstanding question about this transfer data is whether all address transfers that have occurred have been duly recorded in the registry system. This question is raised because registered transfers require conformance to various registry policies, and it may be the case that only a subset of transfers are being recorded in the registry as a result. This can be somewhat challenging to detect, particularly if such a transfer is expressed as a lease or other form of temporary arrangement, and if the parties agree to keep the details of the transfer confidential.
It might be possible to place an upper bound on the volume of address movements that have occurred in any period. One way to achieve this might be through a simple examination of the routing system, looking at addresses that were announced in 2020 by comparing the routing stable state at the start of the year with the table state at the end of the year. See Table 9.
| Jan-20 | Jan-21 | Delta | Unchanged | Re-home | Removed | Added | |
| Announcements | 814,253 | 387,073 | 169.73 | 427,180 | 64.02 | 92,026 | 133,540 |
| Root prefixes: | 387,073 | 814,253 | 387,073 | 169.73 | 427,180 | 64.02 | 47,888 |
| Address span (/8s) | 169.73 | 170.75 | 814,253 | 387,073 | 169.73 | 427,180 | 64.02 |
| More specifics: | 427,180 | 455,955 | 28,775 | 814,253 | 387,073 | 169.73 | 427,180 |
| Address span (/8s) | 64.02 | 65.69 | 1.67 | 58.28 | 1.08 | 5.40 | 6.33 |
Table 9 — IPv4 BGP changes during 2020
While the routing table grew by 41,514 entries over the year, the nature of the change is slightly more involved.
92,026 prefixes announced at the start of the year were removed from the routing system throughout the year, and 133,540 prefixes were announced by the end of the year that were not announced at the start of the year. A further 24,299 prefixes had changed their originating Autonomous System number, indicating some form of change in the prefix’s network location, in some manner.
If we look at the entirety of all updates through 2020 then we see a larger collection of transient address prefixes. A total of 1,108,621 distinct prefixes were observed in the total of all BGP updates through 2020, or 294,368 additional prefixes from the initial set at the start of the year.
We can compare these prefixes that change in 2020 against the transfer logs for the two-year period of 2019 and 2020. Table 10 shows the comparison of these routing numbers against the set of transfers that were logged in these two years.
| Type | Listed | Unlisted | Ratio |
| Rehomed | |||
| All | 1,901 | 22,398 | 7.8% |
| Root Prefixes | 1,534 | 13,326 | 10.3% |
| Removed | |||
| All | 3,153 | 88,873 | 3.4% |
| Root Prefixes | 2,259 | 27,284 | 7.6% |
| Added | |||
| All | 6,358 | 127,182 | 4.8% |
| Root Prefixes | 4,580 | 43,308 | 9.6% |
Table 10 — Routing changes across 2020 compared to the transfer log entries for 2019 – 2020
These figures show that 5%-10% of the changes in advertised addresses from the beginning to the end of the year are reflected as changes as recorded in the RIRs’ transfer logs.
This should not imply that the remaining changes in advertised prefixes reflect unrecorded address transfers.
There are many reasons for changes in the advertisement of an address prefix and a change in the administrative controller of the address is only one potential cause. However, it does establish some notional upper ceiling on the number of movements of addresses in 2020, some of which relate to transfer of operational control of an address block, that have not been captured in the transfer logs.
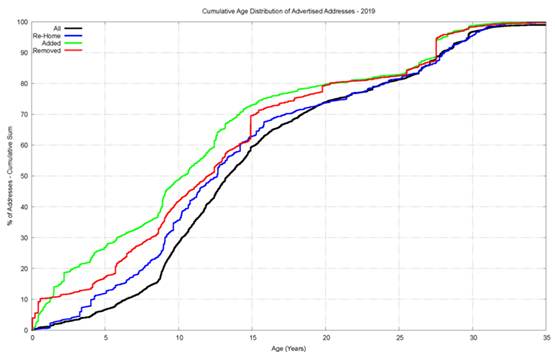
Finally, we can perform an age profile of the addresses that were added, removed, and re-homed during 2019, and compare it to the overall age profile of IPv4 addresses in the routing table. This is shown in Figure 9.
In terms of addresses that were added in 2019, they differ from the average profile due to a skew in favour of ‘recent’ addresses, and 20% of all announced addresses were allocated or assigned in the past 30 months. 20% of all added and removed addresses are more than 20 years old. Addresses that re-home appear to be disproportionately represented in the age bracket of between 5 to 10 years old.
However, as IPv4 moves into its unallocated final stages, we are perhaps now able to take stock of the overall distribution of IPv4 addresses and look at where the addresses landed.
Table 11 shows the ten economies that have the largest pools of allocated IPv4 addresses. However, I must note the assignment of a country code is an address which registration reflects.
| Rank | CC | IPv4 Pool | % Total | Per-Capita | Economy |
| 1 | US | 1,614,294,368 | 43.80% | 4.88 | United States of America |
| 2 | CN | 344,408,576 | 9.30% | 0.24 | China |
| 3 | JP | 189,992,448 | 5.20% | 1.5 | Japan |
| 4 | DE | 123,787,392 | 3.40% | 1.48 | Germany |
| 5 | GB | 114,504,824 | 3.10% | 1.69 | United Kingdom |
| 6 | KR | 112,473,088 | 3.10% | 2.19 | Korea |
| 7 | BR | 87,115,008 | 2.40% | 0.41 | Brazil |
| 8 | FR | 82,368,528 | 2.20% | 1.26 | France |
| 9 | CA | 69,753,856 | 1.90% | 1.85 | Canada |
| 10 | IT | 54,950,976 | 1.50% | 0.91 | Italy |
Table 11 — IPv4 allocated address pools per national economy
If we divide this address pool by the current population of each national entity, then we can derive an address per capita index. The global total of 3.70 billion allocated addresses, with an estimated global population of 7.8 billion people, gives an overall value of 0.47 IPv4 addresses per capita.
| Rank | CC | IPv4 pool | % Total | Per-capita | Economy |
| 1 | SC | 8,118,784 | 0.20% | 82.55 | Seychelles |
| 2 | VA | 10,752 | 0.00% | 13.42 | Holy See |
| 3 | GI | 265,728 | 0.00% | 7.89 | Gibraltar |
| 4 | US | 1,614,294,368 | 43.80% | 4.88 | United States of America |
| 5 | SG | 23,359,744 | 0.60% | 3.99 | Singapore |
| 6 | VG | 102,912 | 0.00% | 3.4 | British Virgin Islands |
| 7 | SE | 29,957,480 | 0.80% | 2.97 | Sweden |
| 8 | LI | 112,672 | 0.00% | 2.96 | Liechtenstein |
| 9 | NL | 50,392,608 | 1.40% | 2.94 | Netherlands |
| 10 | NO | 15,670,032 | 0.40% | 2.89 | Norway |
| – | XA | 3,683,926,432 | 100.00% | 0.47 | World |
Table 12 — IPv4 allocated address pools per capita.
IPv6 in 2020
Obviously, the story of IPv4 address allocation is only half of the story, and to complete the picture it’s necessary to look at how IPv6 has fared over 2020.
IPv6 uses a somewhat different address allocation methodology than IPv4, and it is a matter of choice for a service provider as to how large an IPv6 address prefix is assigned to each customer.
The original recommendations published by the IAB and IESG in 2001, documented in RFC3177, envisaged the general use of a /48 prefix as an end site prefix.
Subsequent consideration of long-term address conservation saw a more flexible approach being taken with the choice of the end site prefix size being left to the service provider.
Today’s IPv6 environment has some providers using a /60 end site allocation unit, many using a /56, and many other providers using a /48. This variation makes a comparison of the count of allocated IPv6 addresses somewhat misleading. An ISP using /48s for end sites will require 256 times more address space to accommodate a similarly sized customer base as a provider who uses a /56 end site prefix, and 4,096 times more address space than an ISP using a /60 end site allocation!
For IPv6, let’s use both the number of discrete IPv6 allocations and the total amount of space that was allocated to see how IPv6 fared in 2019.
Comparing 2019 to 2020, the number of individual allocations of IPv6 address space has declined slightly, while the number of IPv4 allocations has halved.
| Allocations | 2020 | 2019 | 2018 | 2017 | 2016 | 2015 | 2014 | 2013 | 2012 | 2011 | 2010 | 2009 |
| IPv6 | 5,455 | 6,922 | 6,311 | 5,765 | 5,593 | 4,736 | 4,537 | 4,020 | 3,302 | 3,588 | 2,461 | 1,279 |
| IPv4 | 6,263 | 13,112 | 9,707 | 8,091 | 9,911 | 11,644 | 11,114 | 7,073 | 8,608 | 10,062 | 7,739 | 6,698 |
Table 13 — Number of individual address allocations, 2009 – 2020
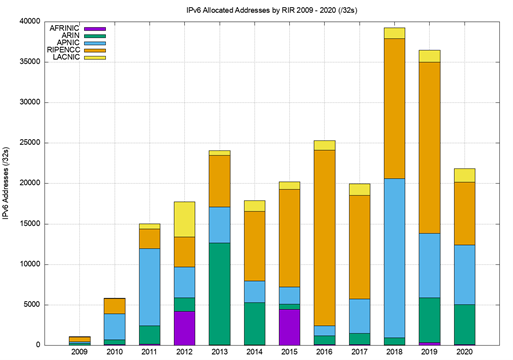
The amount of IPv6 address space distributed in 2019 is slightly less than the amount seen in 2018. As seen in Table 14.
| Addresses | 2020 | 2019 | 2018 | 2017 | 2016 | 2015 | 2014 | 2013 | 2012 | 2011 | 2010 | 2009 |
| IPv6 (/32s) | 21,835 | 36,507 | 39,278 | 19,986 | 25,300 | 20,234 | 17,917 | 24,103 | 17,740 | 15,018 | 5,844 | 1,091 |
| IPv4 (/32s)(M) | 5.6 | 15.4 | 16.1 | 21.2 | 22.5 | 45.3 | 68.5 | 64.9 | 114.9 | 201.0 | 248.0 | 190.1 |
Table 14 — Volume of address allocations, 2007 – 2018
Regionally, each of the RIRs saw IPv6 allocation activity in 2020 that was on a par with those seen in the previous year, except for the RIPE NCC, which saw a 50% decrease in allocations. See Table 15.
| Allocations | 2020 | 2019 | 2018 | 2017 | 2016 | 2015 | 2014 | 2013 | 2012 | 2011 | 2010 | 2009 |
| ARIN | 644 | 605 | 659 | 684 | 646 | 604 | 512 | 560 | 611 | 1,039 | 638 | 394 |
| APNIC | 1,498 | 1,484 | 1,474 | 1,369 | 1,681 | 778 | 528 | 540 | 599 | 641 | 670 | 194 |
| RIPENCC | 1,403 | 3,104 | 2,620 | 2,051 | 2,141 | 2,207 | 2,227 | 2,151 | 1,756 | 1,647 | 1,048 | 642 |
| LACNIC | 1,801 | 1,614 | 1,448 | 1,549 | 1,009 | 1,061 | 1,208 | 696 | 253 | 132 | 50 | 35 |
| AFRINIC | 109 | 115 | 110 | 112 | 116 | 86 | 62 | 73 | 83 | 129 | 55 | 14 |
| 5,455 | 6,922 | 6,311 | 5,765 | 5,593 | 4,736 | 4,537 | 4,020 | 3,302 | 3,588 | 2,461 | 1,279 |
Table 15 — IPv6 allocations by RIR
The address assignment data tells a slightly different story. Table 15 shows the number of allocated IPv6 /32’s per year. There were two /20 allocations in the year; one to CERNET in China and a second to Cable One in the United States. A second large allocation, a /21, was also made to CERNET in China in 2019.
| Addresses (/32s) | 2020 | 2019 | 2018 | 2017 | 2016 | 2015 | 2014 | 2013 | 2012 | 2011 | 2010 | 2009 |
| ARIN | 4,975 | 5,522 | 845 | 1,372 | 1,088 | 642 | 5,232 | 12,581 | 1,676 | 2,280 | 584 | 257 |
| APNIC | 7,365 | 7,945 | 19,690 | 4,228 | 1,236 | 2,109 | 2,663 | 4,462 | 3,807 | 9,506 | 3,241 | 175 |
| RIPENCC | 7,737 | 21,180 | 17,335 | 12,844 | 21,717 | 12,039 | 8,608 | 6,385 | 3,729 | 2,425 | 1,869 | 617 |
| LACNIC | 1,669 | 1,496 | 1,336 | 1,429 | 1,181 | 973 | 1,363 | 608 | 4,325 | 652 | 46 | 32 |
| AFRINIC | 89 | 364 | 72 | 113 | 78 | 4,471 | 51 | 67 | 4,203 | 155 | 104 | 9 |
| 21,835 | 36,507 | 39,278 | 19,986 | 25,300 | 20,234 | 17,917 | 24,103 | 17,740 | 15,018 | 5,844 | 1,091 |
Table 16 — IPv6 address allocation volumes by RIR
Dividing addresses by allocations gives the average IPv6 allocation size in each region, as seen in Table 16. ARIN average allocations increased in size due to some larger allocations in 2019. Overall, the average IPv6 allocation size remains around a /30.
| 2020 | 2019 | 2018 | 2017 | 2016 | 2015 | 2014 | 2013 | 2012 | 2011 | 2010 | 2009 | |
| ARIN | /29.1 | /28.8 | /31.6 | /31.0 | /31.2 | /31.9 | /28.6 | /27.5 | /30.5 | /30.9 | /32.1 | /32.6 |
| APNIC | /29.7 | /29.6 | /28.3 | /30.4 | /32.4 | /30.6 | /29.7 | /29.0 | /29.3 | /28.1 | /29.7 | /32.1 |
| RIPENCC | /29.5 | /29.2 | /29.3 | /29.4 | /28.7 | /29.6 | /30.0 | /30.4 | /30.9 | /31.4 | /31.2 | /32.1 |
| LACNIC | /32.1 | /32.1 | /32.1 | /32.1 | /31.8 | /32.1 | /31.8 | /32.2 | /27.9 | /29.7 | /32.1 | /32.1 |
| AFRINIC | /32.3 | /30.3 | /32.6 | /32.0 | /32.6 | /26.3 | /32.3 | /32.1 | /26.3 | /31.7 | /31.1 | /32.6 |
| /30.0 | /29.6 | /29.4 | /30.2 | /29.8 | /29.9 | /30.0 | /29.4 | /29.6 | /29.9 | /30.8 | /32.2 |
Table 17 — Average IPv6 address allocation size by RIR
The number and volume of IPv6 allocations per RIR per year are shown in Figures 10 and 11.
It might be tempting to ascribe the decline of IPv6 allocations in 2020 from the RIPE NCC to the year where many European countries were hit hard by COVID-19 measures. Arguing against that is the observation that countries all over the world have been similarly affected, yet the decline in IPv6 allocation activity in 2020 is only seen in the data from the RIPE NCC.
READ: IPv6 in China
An interesting question to ask is why IPv6 address allocation activity has slumped in the European economies, but not in China, the US and Brazil? See Table 19.
| Rank | 2020 | 2019 | 2018 | 2017 | 2016 | |||||
| 1 | Brazil | 1,394 | Brazil | 1,112 | Brazil | 1,049 | Brazil | 1,114 | Brazil | 774 |
| 2 | USA | 588 | USA | 538 | Russia | 638 | USA | 634 | USA | 603 |
| 3 | Indonesia | 389 | Russia | 502 | USA | 595 | Germany | 270 | China | 599 |
| 4 | India | 226 | Germany | 407 | Germany | 308 | Russia | 220 | Germany | 266 |
| 5 | Netherlands | 199 | Indonesia | 366 | China | 253 | Australia | 211 | Australia | 219 |
| 6 | Germany | 192 | Netherlands | 342 | Indonesia | 213 | China | 208 | UK | 211 |
| 7 | Bangladesh | 182 | UK | 223 | UK | 184 | Netherlands | 194 | Netherlands | 198 |
| 8 | Russia | 128 | Bangladesh | 202 | Bangladesh | 183 | UK | 190 | Russia | 173 |
| 9 | Australia | 118 | France | 179 | India | 168 | Indonesia | 187 | India | 161 |
| 10 | China | 115 | China | 165 | Netherlands | 162 | Argentina | 178 | Indonesia | 159 |
Table 18 — IPv6 allocations by year by economy
Table 18 shows the countries who received the largest number of individual IPv6 allocations, while Table 19 shows the amount of IPv6 address space assigned on a per economy basis for the past 5 years (using units of /32s).
| Rank | 2016 | 2017 | 2018 | 2019 | 2020 | |||||
| 1 | UK | 9,571 | China | 2,245 | China | 17,647 | China | 6,787 | China | 6,765 |
| 2 | Germany | 1,525 | USA | 1,497 | Russia | 4,675 | USA | 5,510 | USA | 5,051 |
| 3 | Netherlands | 1,312 | Germany | 1,364 | Germany | 1,932 | Russia | 3,716 | Brazil | 1,358 |
| 4 | USA | 1,142 | Russia | 1,358 | UK | 1,209 | Germany | 2,522 | Netherlands | 1,331 |
| 5 | Russia | 1,005 | Netherlands | 1,296 | Singapore | 1,055 | Netherlands | 2,516 | Germany | 716 |
| 6 | France | 926 | Spain | 1,170 | Netherlands | 1,025 | UK | 1,355 | Russia | 715 |
| 7 | Brazil | 727 | India | 1,087 | Brazil | 1,007 | France | 1,182 | UK | 552 |
| 8 | Spain | 702 | UK | 1,072 | USA | 874 | Italy | 1,052 | Italy | 391 |
| 9 | Italy | 679 | Brazil | 1,049 | Spain | 851 | Brazil | 1,049 | France | 390 |
| 10 | China | 597 | France | 714 | France | 722 | Spain | 854 | Turkey | 290 |
Table 19 — IPv6 address allocation volumes by year by economy (/32s)
Historical allocation
Some twenty years ago it was common practice to point out the inequities in the state of IPv4 address deployment. Some US universities had more IPv4 addresses at their disposal than some highly populated developing economies, and the disparity was a part of the criticism of the address management practices of the time.
The RIR system was intended to address this issue of predisposition to a biased outcome. The concept behind the system was that within the regional community each community had the ability to develop their own address distribution policies and could determine for themselves what they meant by such terms as ‘fairness’ and ‘equity’ and then direct their regional address registry to implement these policies.
While IPv4 had a very evident early adopter reward in that the address allocations in the IPv4 class-based address plan could be quite extravagant, the idea for IPv6 was that address allocations were developed from the outset through local bottom-up policy determinate frameworks, so evident inequities in the outcome would be avoided.
It was also envisaged that with such a vast address plan provided by 128 bits of address space, the entire concept of scarcity and inequity would be largely irrelevant. 2128 is a huge number and the entire concept of comparison between two vast pools of addresses is somewhat irrelevant. So, when we look at the metric of /48s per head of population don’t forget that a /48 is actually 80 bits of address space, which is massively larger than the entire IPv4 address space. Even India’s average of 0.1 /48s per capita is still a truly massive number of IPv6 addresses!
However, before we go too far down this path, it is also useful to bear in mind that the 128 bits of address space in IPv6 has become largely a myth.
We sliced off 64 bits in the address span for no particularly good reason, as it turns out. We then sliced off a further 48 bits for, again, no particularly good reason.
READ: Testing transition mechanisms in IPv6-only networks
So, the vastness of the address space represented by 128 bits in IPv6 is not so vast and the usable address prefix space in IPv4 roughly equates to a /32 end address in IPv4, with around a /48 address in IPv6. So perhaps this comparison of /48s per capita is not entirely fanciful, and there is some substance to the observation that there are inequities in the address distribution in IPv6 so far. However, unlike IPv4, the unallocated IPv6 address space is still quite some time off, and we still believe that there are sufficient IPv6 addresses to support a uniform address utilization model across the entire world of silicon over time.
So, for IPv6 it’s still relatively early days and no doubt the picture will change as deployment of IPv6 matures.
| Rank | CC | Allocated (/48s) | % Total | /48s p.c. | Advertised /48s | % Deployment | Name |
| 1 | US | 3,781,720,299 | 18.10% | 11.4 | 995,561,503 | 11.50% | USA |
| 2 | CN | 3,583,049,820 | 17.20% | 2.5 | 1,385,479,853 | 16.00% | China |
| 3 | DE | 1,444,151,922 | 6.90% | 17.2 | 1,007,210,021 | 11.70% | Germany |
| 4 | GB | 1,341,718,755 | 6.40% | 19.8 | 386,508,083 | 4.50% | UK |
| 5 | FR | 918,880,387 | 4.40% | 14.1 | 142,697,493 | 1.70% | France |
| 6 | RU | 809,632,046 | 3.90% | 5.5 | 213,602,534 | 2.50% | Russia |
| 7 | JP | 660,938,940 | 3.20% | 5.2 | 506,102,053 | 5.90% | Japan |
| 8 | IT | 623,054,872 | 3.00% | 10.3 | 394,403,964 | 4.60% | Italy |
| 9 | AU | 615,253,158 | 2.90% | 24.1 | 305,355,551 | 3.50% | Australia |
| 10 | NL | 579,141,930 | 2.80% | 33.8 | 249,749,134 | 2.90% | Netherlands |
| 11 | BR | 513,171,855 | 2.50% | 2.4 | 297,615,084 | 3.40% | Brazil |
| 12 | SE | 426,377,541 | 2.00% | 42.2 | 352,600,454 | 4.10% | Sweden |
| 13 | ES | 361,168,925 | 1.70% | 7.7 | 89,469,533 | 1.00% | Spain |
| 14 | PL | 353,173,719 | 1.70% | 9.3 | 196,706,987 | 2.30% | Poland |
| 15 | AR | 347,670,884 | 1.70% | 7.7 | 280,830,395 | 3.30% | Argentina |
| 16 | KR | 344,719,370 | 1.70% | 6.7 | 6,226,204 | 0.10% | Korea |
| 17 | ZA | 315,429,286 | 1.50% | 5.3 | 286,032,529 | 3.30% | South Africa |
| 18 | EG | 269,090,818 | 1.30% | 2.6 | 268,894,209 | 3.10% | Egypt |
| 19 | CH | 225,181,865 | 1.10% | 26 | 105,767,838 | 1.20% | Switzerland |
| 20 | TR | 196,608,023 | 0.90% | 2.3 | 37,666,566 | 0.40% | Turkey |
| 21 | CZ | 193,527,917 | 0.90% | 18.1 | 105,042,577 | 1.20% | Czech Republic |
| 22 | TW | 167,444,494 | 0.80% | 7 | 154,670,384 | 1.80% | Taiwan |
| 23 | IR | 164,495,367 | 0.80% | 2 | 24,268,880 | 0.30% | Iran |
| 24 | UA | 150,208,673 | 0.70% | 3.4 | 48,230,838 | 0.60% | Ukraine |
| 25 | IN | 147,063,401 | 0.70% | 0.1 | 84,026,162 | 1.00% | India |
Table 20 — IPv6 allocated address pools per national economy
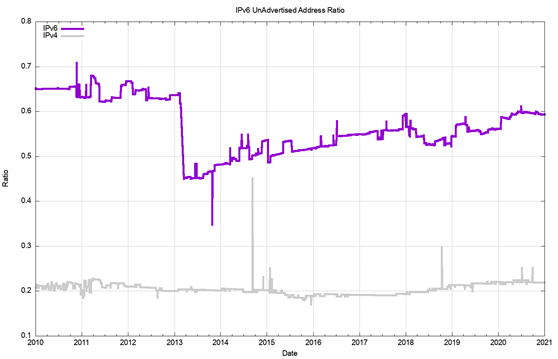
To what extent are allocated IPv6 addresses visible as advertised prefixes in the Internet’s routing table?
Figure 12 shows the overall count of advertised, unadvertised, and total allocated address volume for IPv6 since 2010, while Figure 13 shows the advertised address span as a percentage of the total span of allocated and assigned IPv6 addresses.
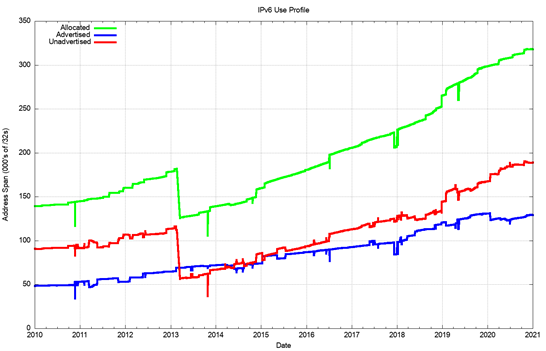
The drop in the allocated address span in 2013 is the result of a change in LACNIC, where a single large allocation into Brazil was replaced by the recording of direct allocation and assignments to ISPs and similar end entities.
From a history of careful conservation of IPv4 addresses, where some 77% of allocated or assigned IPv4 addresses are advertised in the BGP routing table, a comparable IPv6 figure of 40% does not look all that impressive. But that’s not the point. We chose the 128-bit address size in IPv6 to allow addresses to be used without overriding concerns about conservation. We are allowed to be inefficient in address usage. At the start of 2021, we have advertised an IPv6 address span which is the equivalent of 130,000 /32s, or 9 billion end site /48 prefixes. That is just 0.003% of the total number of /48 prefixes in IPv6.
The Outlook for the Internet
Once more the set of uncertainties that surround the immediate future of the Internet are considerably greater than the set of predictions that we can be reasonably certain about.
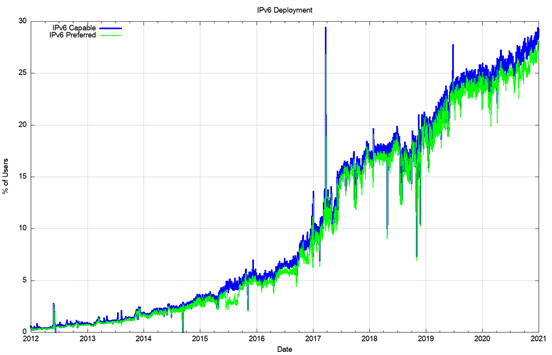
The year 2017 saw a sharp rise in IPv6 deployment, influenced to a major extent by the deployment of IPv6 services in India, notably by the Jio service.
The next year, 2018, was a quieter year, although the rise in the second half of the year is due to the initial efforts of mass scale IPv6 deployment in the major Chinese service providers.
This movement accelerated in 2019, and the overall movement of some 5% in the network wide IPv6 deployment levels has a lot to do with the very rapid rise of the deployment of IPv6 in China.
While several service operators have reached the decision point that the anticipated future costs of NAT deployment are unsustainable for their service platform, there remains a considerable school of thought that NATs will cost-effectively absorb more years of Internet device population growth. At least, that’s the only rationale I can ascribe to a very large number of service providers who are making no visible moves to push out Dual-Stack services at this point in time. Given that the ultimate objective of this transition is not to turn on Dual-Stack everywhere, but to turn off IPv4, there is still some time to go. The uncertainty lies in trying to quantify what that time might be.
The period of the past decade has been dominated by the mass marketing of mobile internet services, and the Internet’s growth rates for 2014 through 2016 might have been the highest so far recorded. This would have been visible in the IP address deployment data, were it not for the depletion of the unallocated IPv4 address pool.
In address terms, this growth in the IPv4 Internet is being almost completely masked using Carrier Grade NATs in the mobile service provider environment, so that the resultant demands for public addresses in IPv4 are quite low and the real underlying growth rates in the network are occluded by these NATs.
In IPv6, the extremely large size of the address space masks out much of this volume. A single IPv6 /20 allocation to an ISP allows for 268 million /48 allocations or 68 billion /56 allocations, so much of the growth in IPv6-using networks is simply hidden behind the massive address plan that lies behind IPv6.
It has also been assumed that we should see IPv6 address demands for deployments of large-scale sensor networks and other forms of deployments that are encompassed under the broad umbrella of the Internet of Things.
This does not necessarily imply that the deployment is merely a product of an over-hyped industry, although that is always a possibility. It is more likely to assume that, so far, such deployments are taking place using private IPv4 addresses which rely on NATs and application-level gateways to interface to the public network.
Time and time again we are lectured that NATs are not a good security device. In practice, NATs offer a reasonable front-line defence against network scanning malware so there may be a larger story behind the use of NATs and device-based networks than just a simple conservative preference to continue to use an IPv4 protocol stack.
More generally, we are witnessing an industry that is no longer using technical innovation, openness, and diversification as its primary means of propulsion. The widespread use of NATs in IPv4 limit the technical substrate of the Internet to a very restricted model of simple client/server interactions using TCP and UDP. The use of NATs forces the interactions into client-initiated transactions. The model of an open network with considerable flexibility in the way in which communications take place is no longer being sustained in today’s network. Incumbents are entrenching their position while innovation and entrepreneurship are taking a back seat as we sit out this protracted IPv4/IPv6 transition.
Today’s Internet carriage service is provided by a smaller number of very large players, each of whom appears to be assuming a very strong position within their respective markets. The drivers for such larger players tend towards risk aversion, conservatism, and increased levels of control across their scope of operation. The same trends of market aggregation are now appearing in content provision, where a small number of content providers are exerting a completely dominant position across the entire Internet.
The evolving makeup of the Internet industry has quite profound implications in terms of network neutrality, separation of functions of carriage and service provision, investment profiles, expectations of risk and return on infrastructure investments, and on the openness of the Internet itself.
Given the economies of volume in this industry, it was always going to be challenging to sustain an efficient, fully open and competitive industry, but the degree of challenge in this agenda is multiplied many-fold when the underlying platform has run out of the basic currency of IP addresses.
The pressures on the larger players within these markets to leverage their incumbency into overarching control gains traction when the stream of new entrants with competitive offerings dries up, and the solutions in such scenarios typically involve some form of public sector intervention, directed to restore effective competition, and revive the impetus for more efficient and effective offerings in the market.
As the Internet continues to evolve, it is no longer the technically innovative challenger pitted against the venerable incumbent industries of telephony, print newspapers, television entertainment and social interaction — the Internet is now the established norm.
The days when the Internet was touted as a poster child of disruption in a deregulated space are long since over, and these days we appear to be increasingly looking further afield for a regulatory and governance framework that can challenge the increasing complacency of the newly established incumbents. It is unclear how successful we will be in this search. We can but wait and see.
The views expressed by the authors of this blog are their own and do not necessarily reflect the views of APNIC. Please note a Code of Conduct applies to this blog.
Why does historical data doesn’t match historical data in 2019 report? E.g. data in 2020 Table4 differs from 2019 Table4
https://blog.apnic.net/2020/01/21/addressing-2019/
Yes, is indeed a point of contention for me. These days the RIRs all publish a JSON transfer log. However the JSON reports differ from each other in subtle ways, but more critically the processes used to generate the JSON files from the registry data appear to differ for each RIR. In 2019 I used the transfer logs published as a simple html tables on the RIRs’ web pages. This year I used the JSON reports. Yes, the results are different. Obviously this should not be the case, however I have no insight as to how this has occurred and what the root cause may be.