

The first part of this report looked at the size of the routing table and some projections of its growth for both IPv4 and IPv6. However, the scalability of BGP as the Internet’s routing protocol is not just dependent on the number of prefixes carried in the routing table, dynamic routing updates are also part of this story. If the update rate of BGP is growing faster than we can deploy processing capability to match, then the routing system will lose coherence. At that point, the network will head into periods of instability.
This report will look at the profile of BGP updates across 2020 to assess whether the stability of the routing system, as measured by the level of BGP update activity, is changing.
Read: BGP in 2020 — The BGP Table
IPv4 Stability
Figure 1 shows the daily BGP update activity as seen at AS131072, since mid-2009.
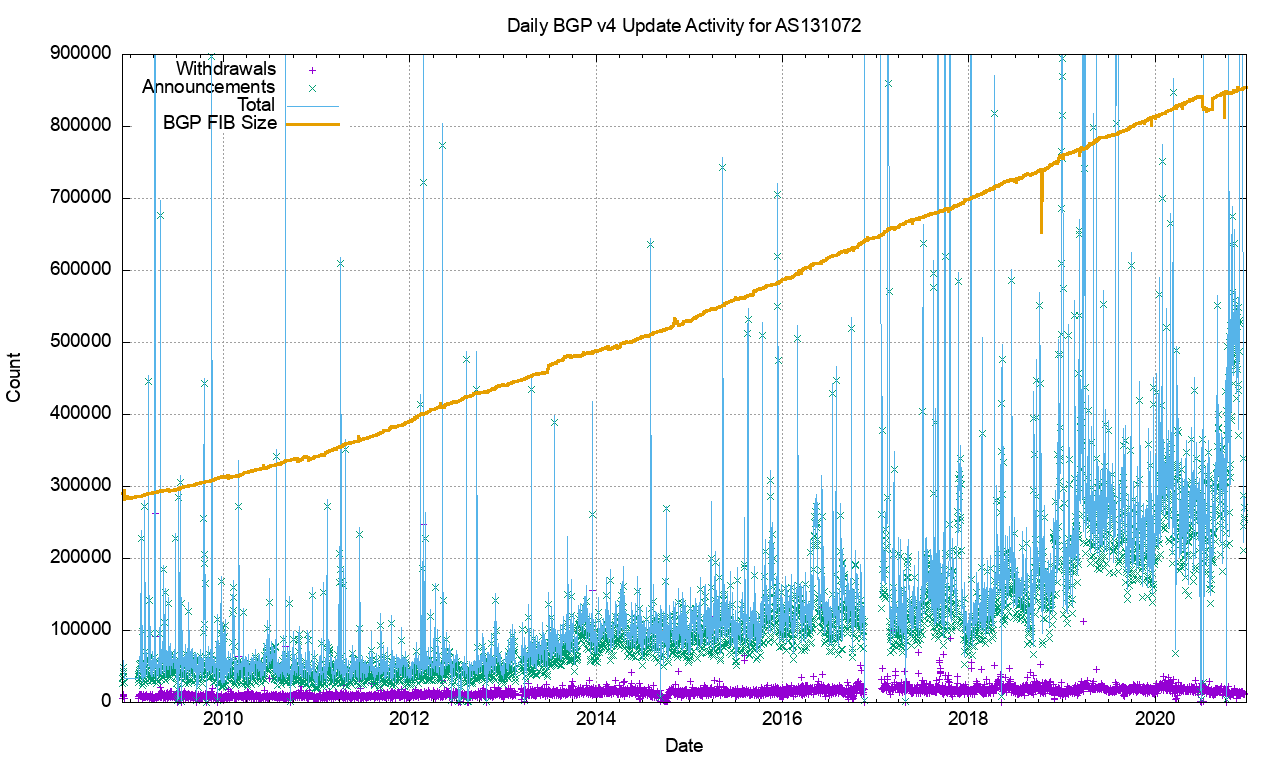
The first aspect of this data is the number of withdrawals per day (violet in Figure 1). The number of observed withdrawals has remained relatively constant at 15,000 – 20,000 withdrawals per day, while the number of advertised IPv4 prefixes has risen from 300,000 to 850,000 (orange in Figure 1).
There is no particular reason why the daily withdrawal count should be steady while the number of announced prefixes has more than doubled. We have no explanation for this behaviour so far.
This is not the case.
The withdrawal rate also appears to be unrelated to either the number of routed prefixes or the number of routed networks.
The second is the number of update messages per day (green in Figure 1). This was steady at 50,000 updates per day from 2009 until 2013. During 2013 the volume of updates doubled to 100,000 updates per day, which it maintained for most of the next 24 months. During 2016 the number of updates per day rose again, approaching some 170,000 updates per day by the end of 2017. The update rate has increased considerably in recent months.
It was fortuitous that the BGP update rate had been held steady for so many years as this implied that the capability of BGP systems did not require constantly increasing processing capability. In the same way that there was no clear understanding of why the BGP update rate was steady for so many years, it’s also unclear why the rate increased in recent years.
What is also intriguing is that most of these 400,000 updates per day are generated from a pool of between 30,000 to 60,000 prefixes. A plot of the daily count of prefixes that are the subject of BGP updates is shown in Figure 2.
While this number is rising, it is not rising at the same rate as the number of updates per day, so the heightened instability is possibly due to more updates reaching convergence, rather than due to more unstable prefixes.
Another possible explanation is that we are looking at daily average numbers, and this rise in the average could be caused by a small pool of unstable prefixes exhibiting higher levels of instability than was the case previously.
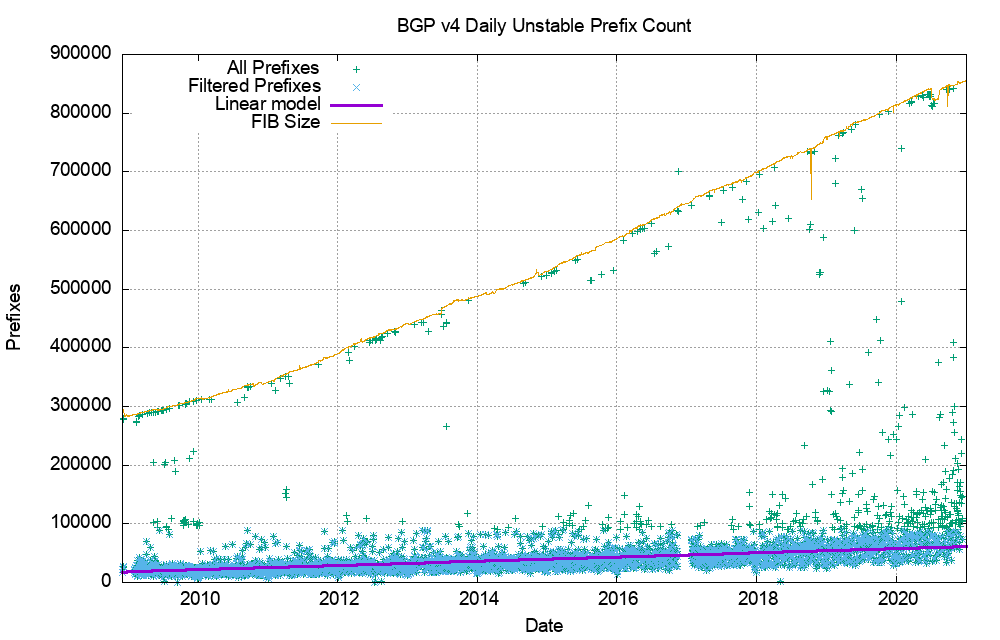
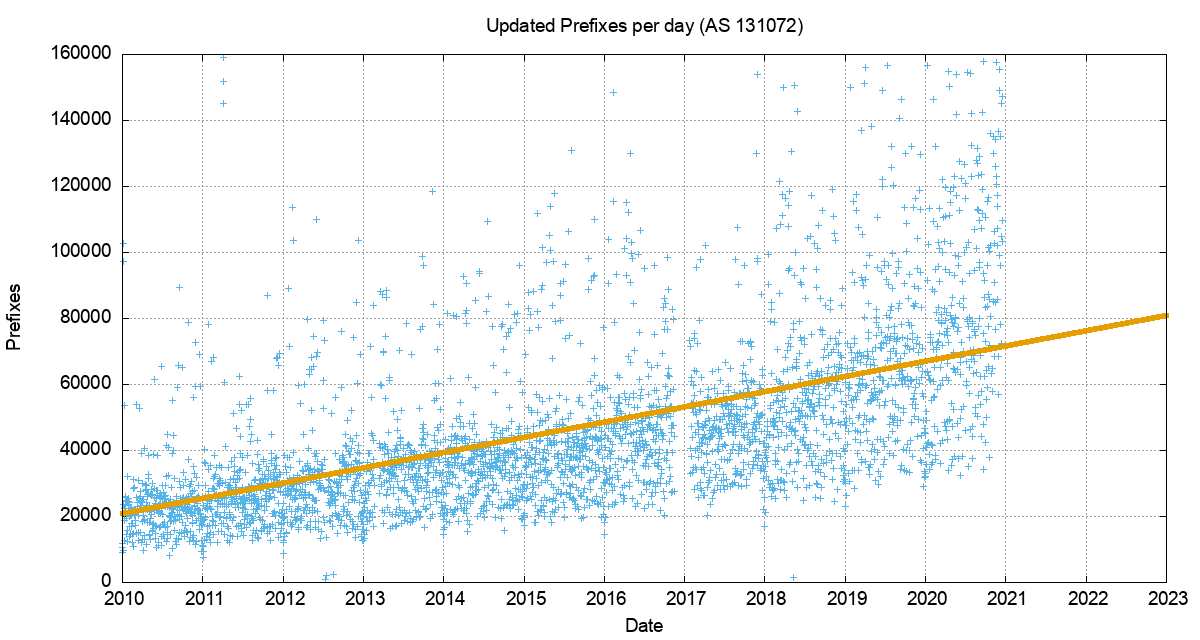
The number of unstable prefixes per day appears to be gradually increasing over the years. A least squares best fit shows a linear trend that increases the average daily unstable prefix count by 2,200 prefixes per year (Figure 3).
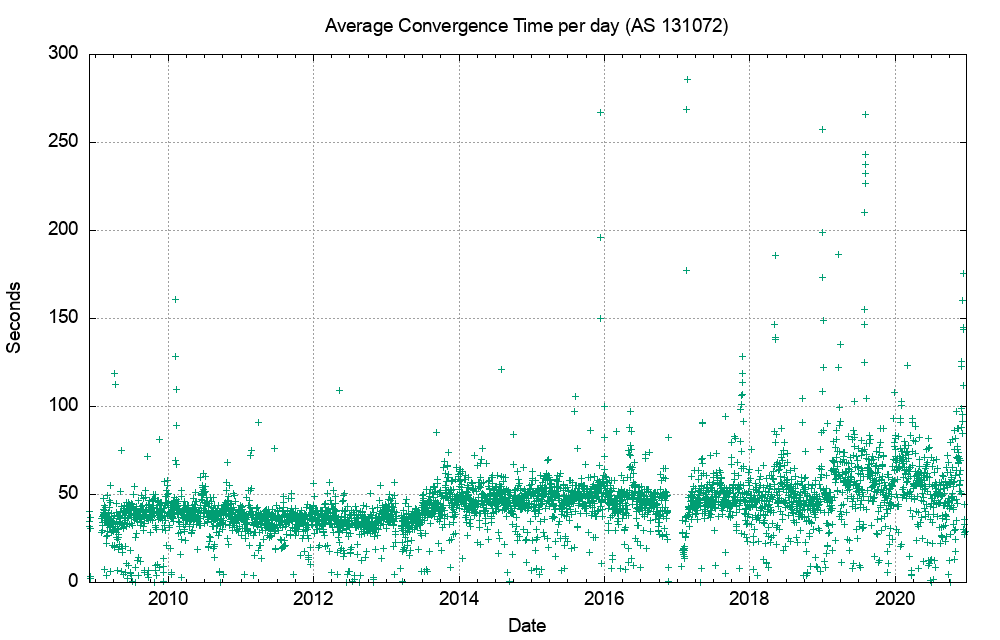
However, this increased count of the number of unstable prefixes and the increasing update count is not reflected in the measure of the time to reach a converged state. The average time for an unstable prefix to reach stability is still at 50 seconds (Figure 4), and while it rose in 2013 from around 40 to 50 seconds, the number has remained at 50 seconds since then.
The instability in BGP is not uniform
Half of all BGP updates over a period of a week are attributed to less than 1% of the unstable prefixes, and just 50 origin ASNs accounted for half of all BGP IPv4 updates in the closing week of 2018.
It appears that the network is generally highly stable, and that a very small number of prefixes appear to be advertised across into highly unstable BGP configurations over periods that extend for weeks, rather than hours.
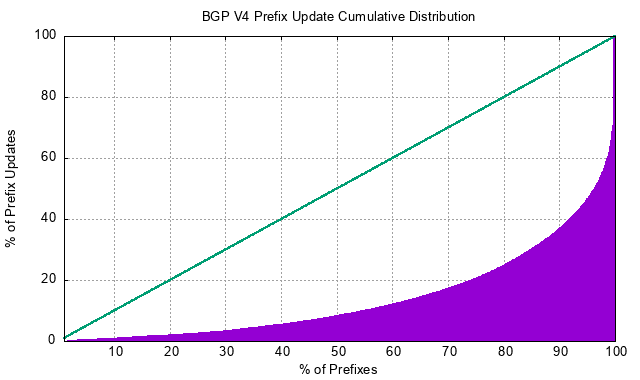
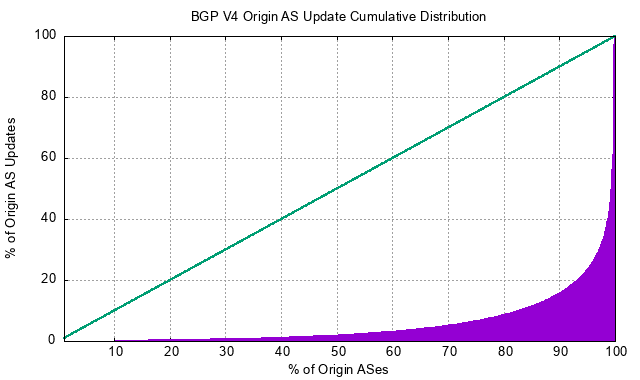
The cumulative distribution of BGP updates by prefix and by origin AS, shown in Figures 5 and 6 for the final weeks of 2020, indicates the highly skewed nature of unstable prefixes in the routing system.
Also of interest, the ASN distribution is more ‘skewed’ than that of the prefix distribution. This would tend to suggest that the cases of high update volume are generated at the AS level rather than the prefix level.
IPv6 Stability
Ideally, the IPv6 routing network should be behaving in a very similar manner to the IPv4 environment. It is a smaller network, but as the overlay IPv6 tunnels are phased out, the underlying connectivity for IPv6 should be essentially similar in terms of the connectivity of IPv4.
It would be unusual to see two networks where one provided transit services to the other in IPv4, yet the opposite arrangement is used for IPv6. So, given that the underlying topology should have strong elements of similarity across the two protocols, we should see the BGP stability profile of IPv6 appear to be much the same as IPv4.
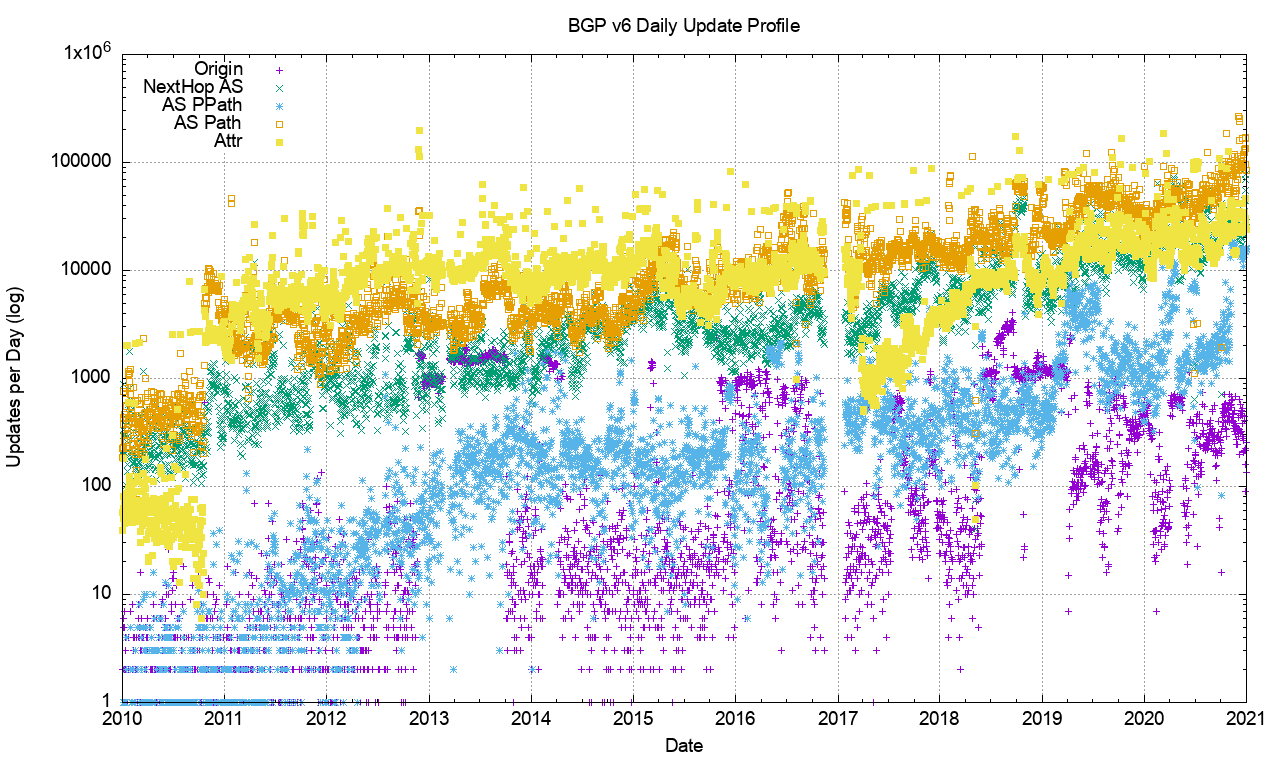
Figure 7 shows the profile of IPv6 updates since 2011. The number of withdrawals per day has been growing steadily across this period. The profile of BGP updates per day is quite different from IPv4.
This number has been rising since 2015, and during 2019 we saw some 35,000 updates per day with peaks of more than 80,000 updates per day.
The final months of 2020 saw a dramatic rise in the instability in IPv6, with the daily update count rising to 1.2M prefix updates per day. This shows some pathological instability in parts of the IPv6 network which may be due to some form of BGP route oscillation that fails to converge.
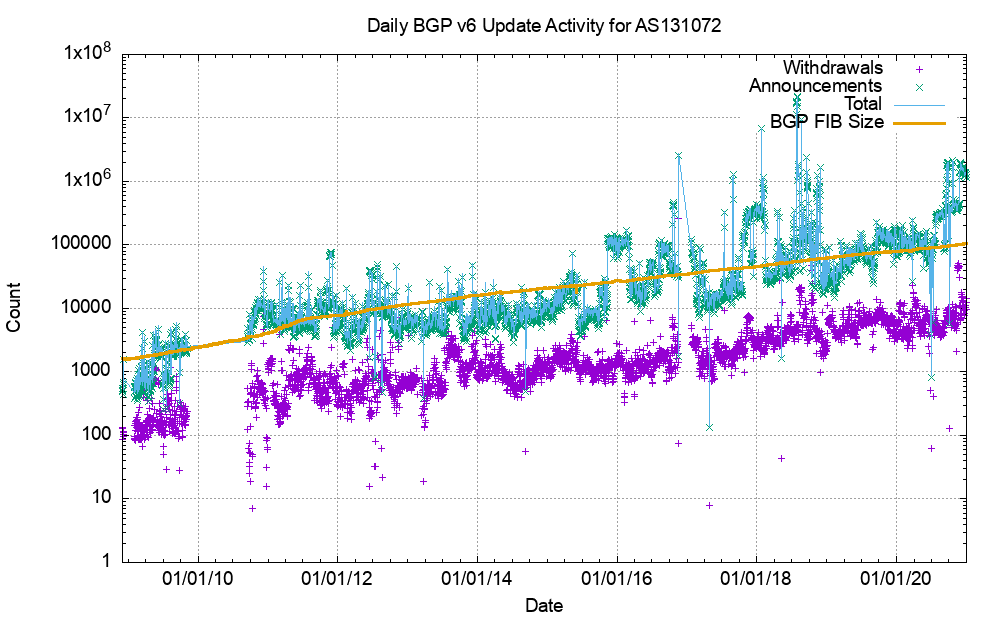
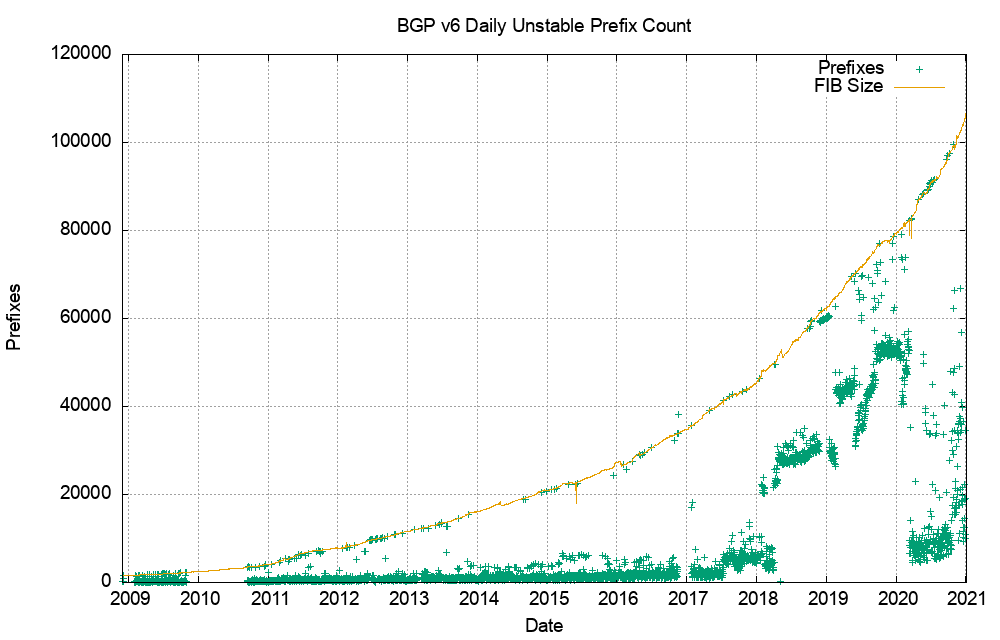
Figure 8 shows that the number of unstable prefixes has changed since the start of 2018. The high count of updated prefixes suggests a topology-based oscillation in one of the upstream feeds for this network that appears to affect half the total count of prefixes in the IPv6 routing table.
This instability was partially addressed at the start of 2020 but returned in the latter months of 2020.
The issue with running two discrete routing systems within the Internet is that it is sometimes the case that operational attention remains fixated on the IPv4 routing system, while IPv6 is simply assumed to be working on the basis that the IPv4 network is stable.
Routing pathologies in the IPv6 network appear to remain unnoticed for many months, and at the end-user level the dual stack environment simply masks the issues. Failure to connect in IPv6 is silently fixed in the happy eyeballs behaviour mode by rapidly switching to use IPv4 for the affected sessions.
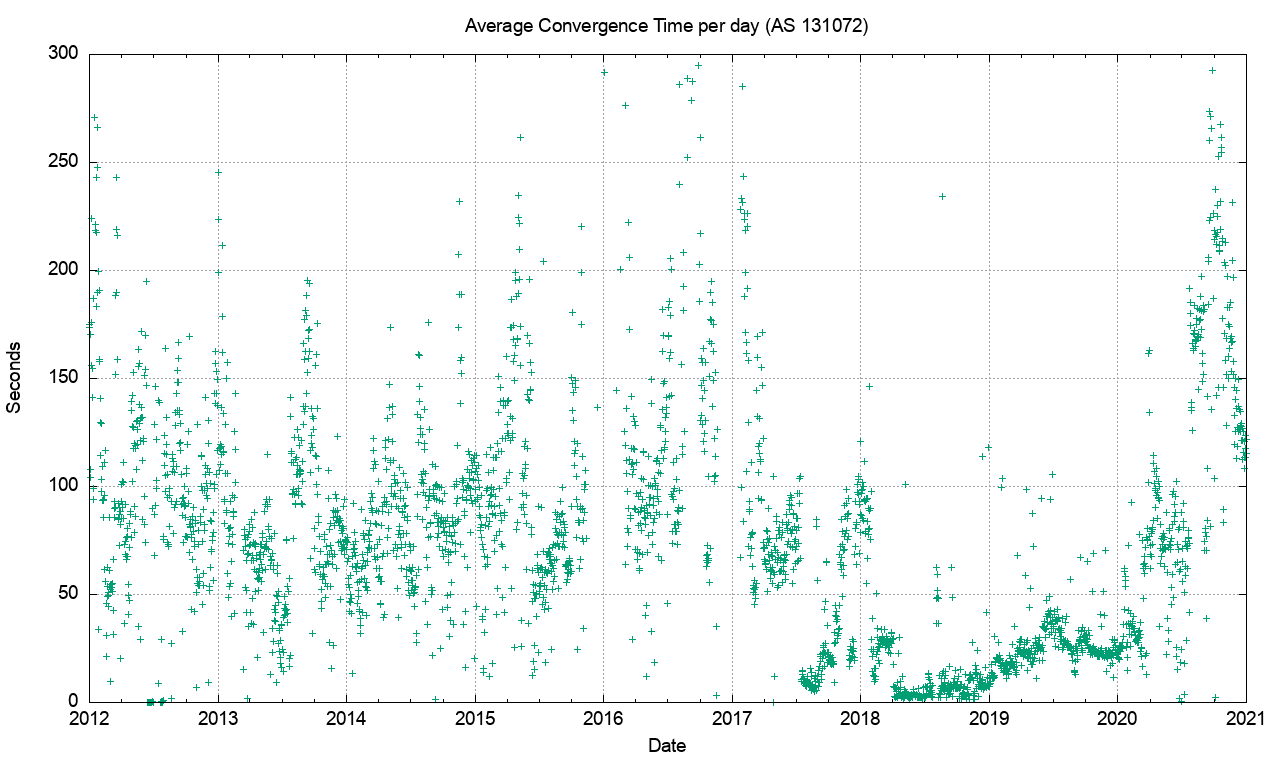
The average time to reach convergence has been unstable for the IPv6 network (Figure 9). The daily average of this convergence time ranges between 70 and 300 seconds.
The last half of 2020 saw some period of high instability with protracted times of up to 300 seconds to reach convergence for individual prefixes.
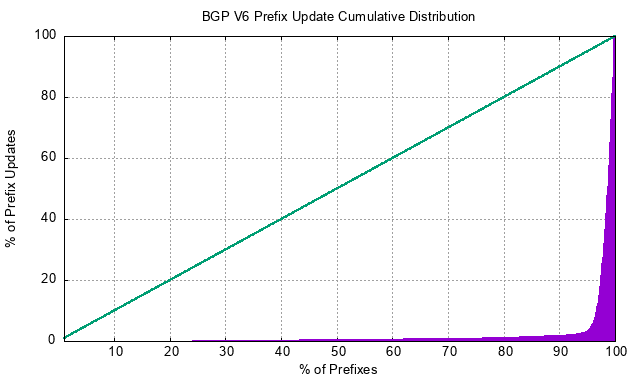
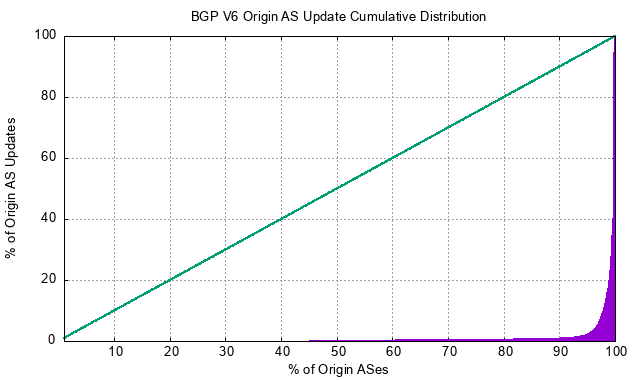
It is also evident that the distribution of updates across the set of announced prefixes and originating ASNs is far more skewed than IPv4.
In the final two weeks of 2020, the most unstable 50 IPv6 prefixes accounted for 5% of the total update volume (compared to 13% of updates for the 50 most unstable prefixes in IPv4), and the most unstable 50 Origin ASNs account for 64% of the updates (compared to 34% in IPv4).
The distribution of updates is shown in Figures 10 and 11.
It is not immediately obvious why IPv6 has this higher instability component than IPv4.
One concern is that this instability remains a persistent condition as the IPv6 network continues to grow, which would create a routing environment that would impose a higher processing overhead than we had anticipated, with its attendant pressures on BGP processing capabilities in the network.
Instability and topology
BGP is a distance vector routing protocol that achieves a coordinated stable routing state through repeated iterations of a local update protocol. The efficiency of the protocol depends heavily on the underlying topology of the network. Highly clustered topologies, such as star-based topologies, will converge quickly, whereas arbitrary mesh-based topologies will generally take longer to converge to a stable state.
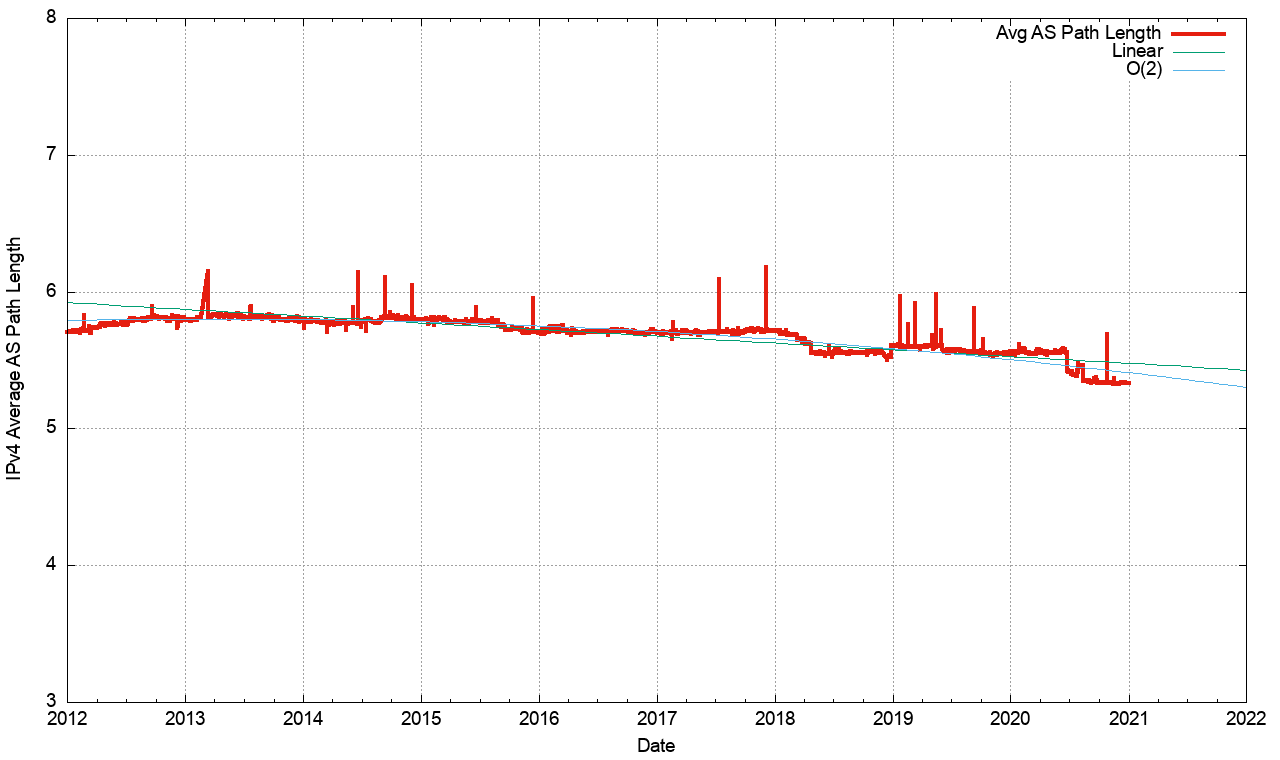
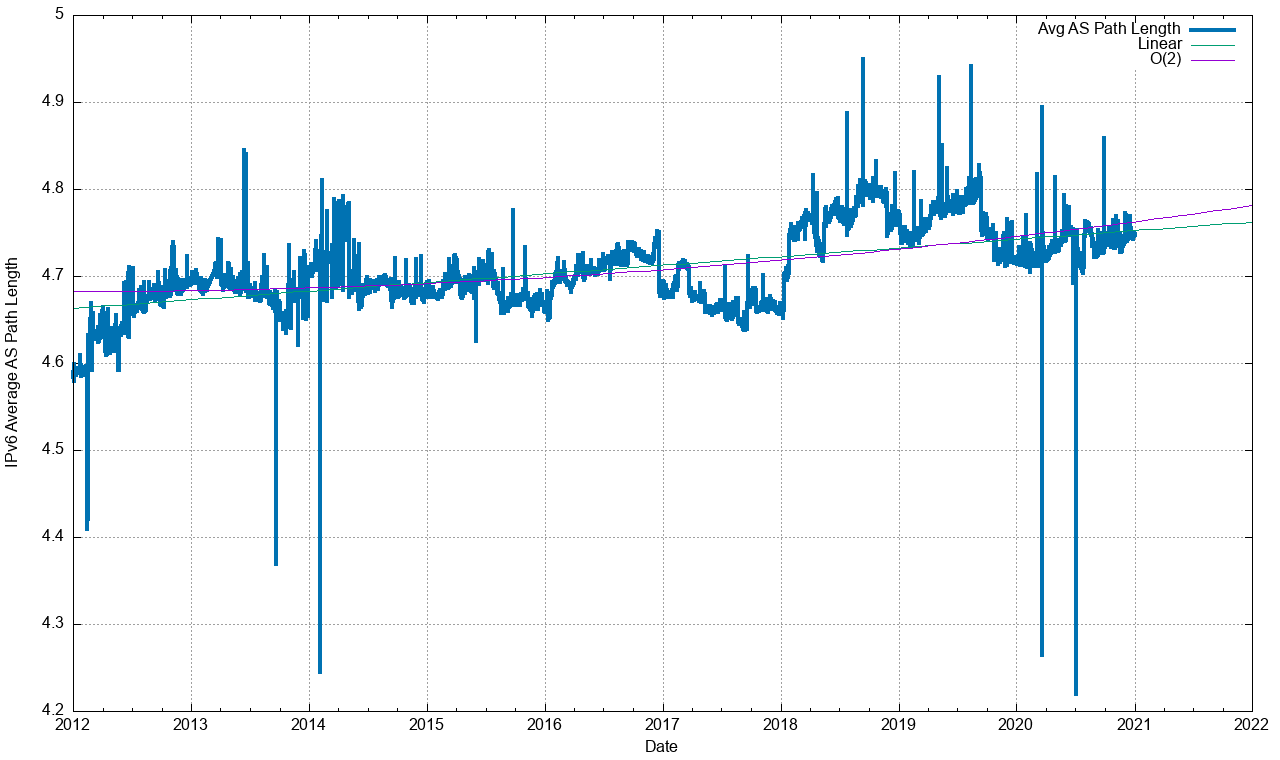
The convergence behaviour of BGP, particularly in the IPv4 network is quite remarkable, and perhaps the best illustration of why this is the case lies in the average AS path length of the BGP routing table, over time (Figure 12).
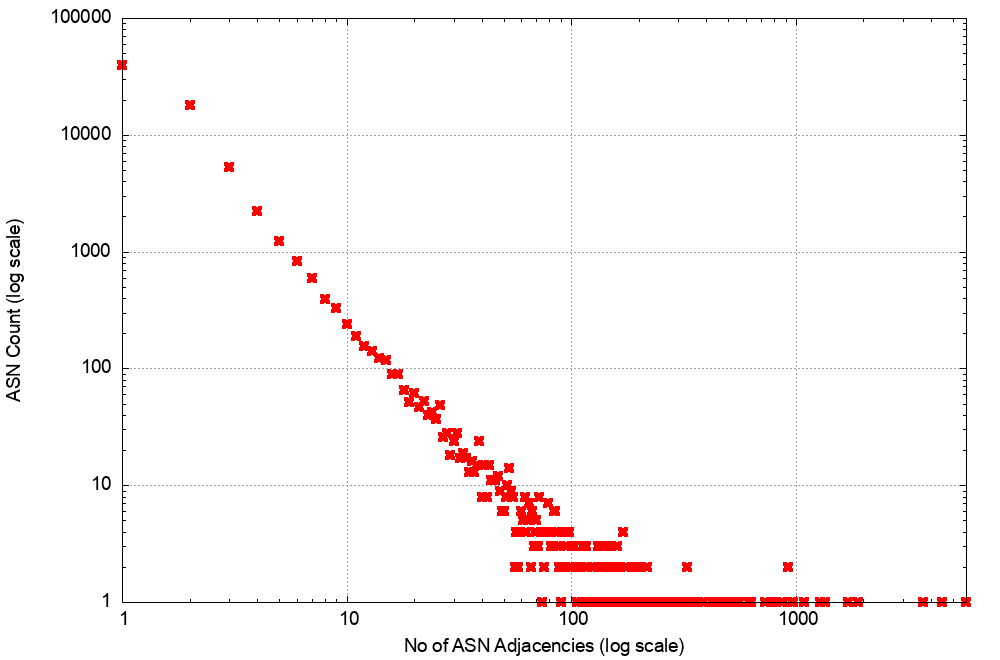
A related picture is shown in the distribution of AS adjacencies counts in the v4 network (Figure 13).
Only 14 networks have more than 100 AS adjacencies that are advertised in the transit network. This is consistent with a network that is composed of a relatively small set of transit ‘connectors’ and a far larger set of stub networks that attach themselves into this core.
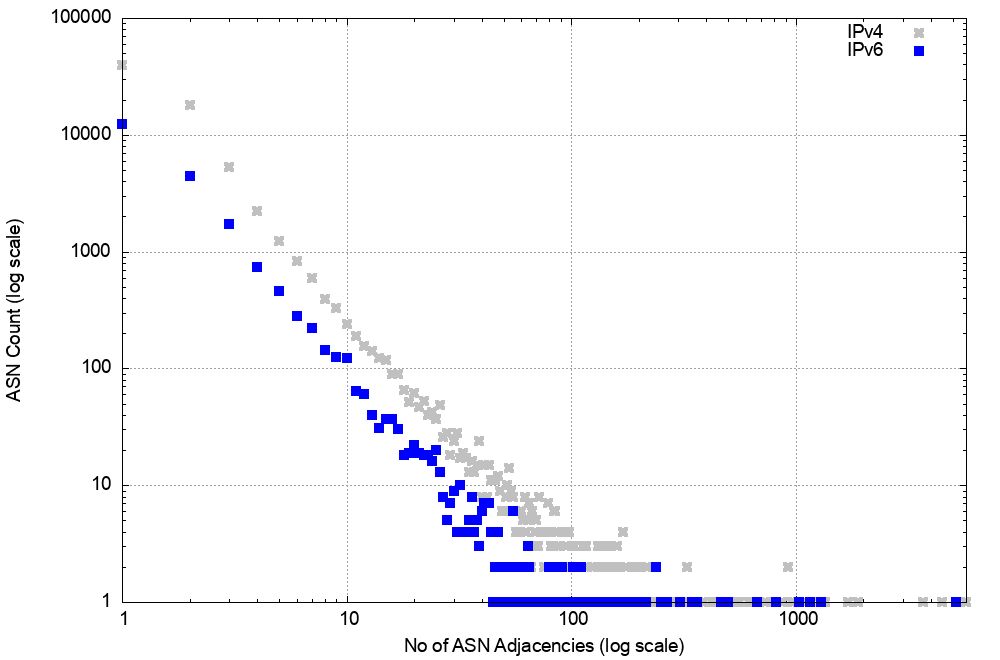
A similar picture exists in IPv6 (Figure 14) of a relatively stable average AS path length, and there is a similar picture of AS adjacency distribution (Figure 15).
In the case of IPv6, there are other factors that appear to influence the overall stability of IPv6.
These profiles of topology would support a conclusion that the IPv4 and IPv6 BGP system should behave in a reasonably similar manner, yet IPv6 is visibly less stable.
However, the distributions of Figures 10 and 11 need to be remembered. When we are talking average update volumes, we are actually talking about a very small set of prefixes that generate anomalously high numbers of updates.
When we say ‘IPv6 is visibly less stable’, it is probably more accurate to say that the small number of anomalously unstable prefixes in IPv6 exhibit relatively higher levels of instability than their IPv4 counterparts.
Instability and update types
We can look further into these updates to see if there is any visible correlation between routing practices by network operators and BGP instability. If we look at just those updates that refine an already announced address prefix, then we can use a taxonomy of the effect of the routing update.
The taxonomy used here is to look at a change in the Origin AS — a change in the next-hop AS (the next AS in the AS path that is adjacent to the origin AS), a change in the AS prepending of the AS path, any other changes in the AS Path, and finally a change in the non-AS Path attributes of the update.
The profile of the daily count of these updates is shown in Figure 16 for IPv4 and Figure 17 for IPv6.
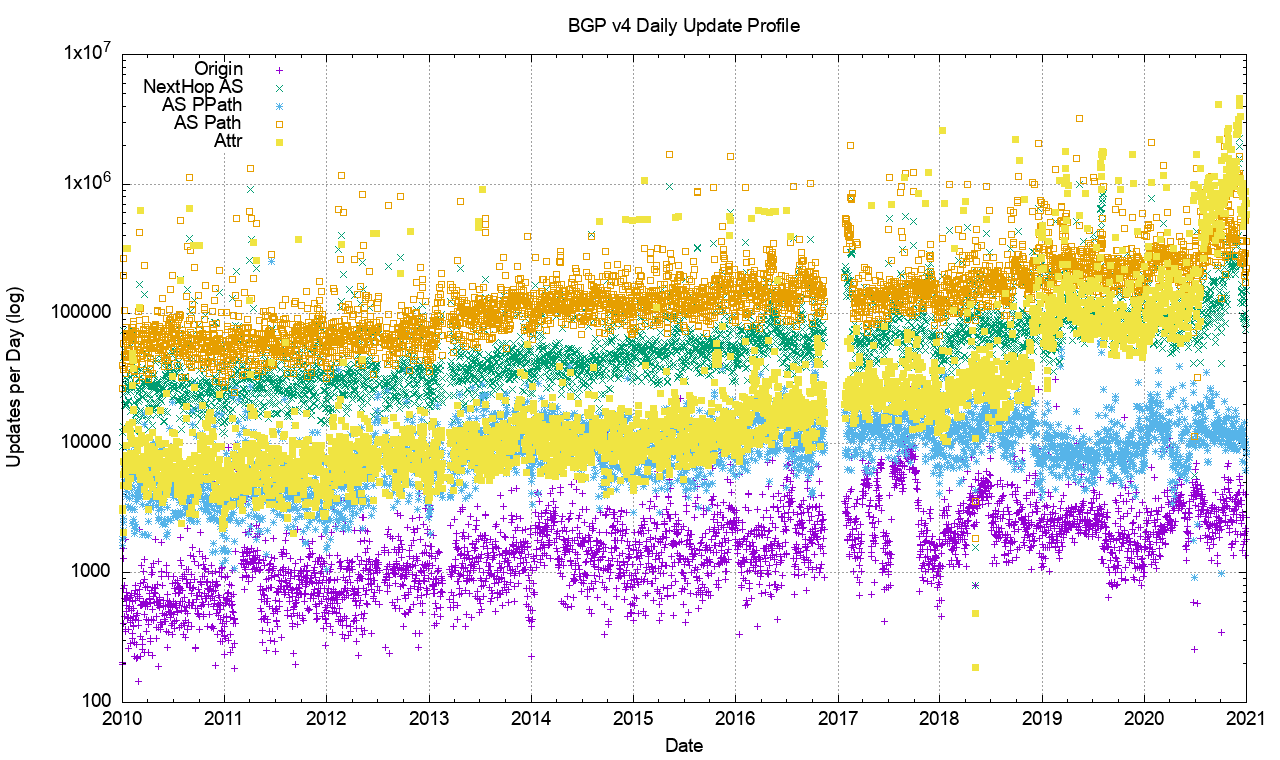
In the IPv4 network, changes to the AS path were the most common, followed by changes to the next-hop AS. However, this profile changed at the start of 2019 and attribute changes that did not include any changes to the origin AS or the AS path are the most common in the IPv4 BGP network these days.
It is challenging to understand the rationale for this level of attribute churn in the IPv4 network given that it has no evident impact on the underlying forwarding decisions or the underlying inter-AS topology.
The IPv6 network shows a similar pattern, although AS path changes are slightly more prevalent than attribute changes by the end of 2020.
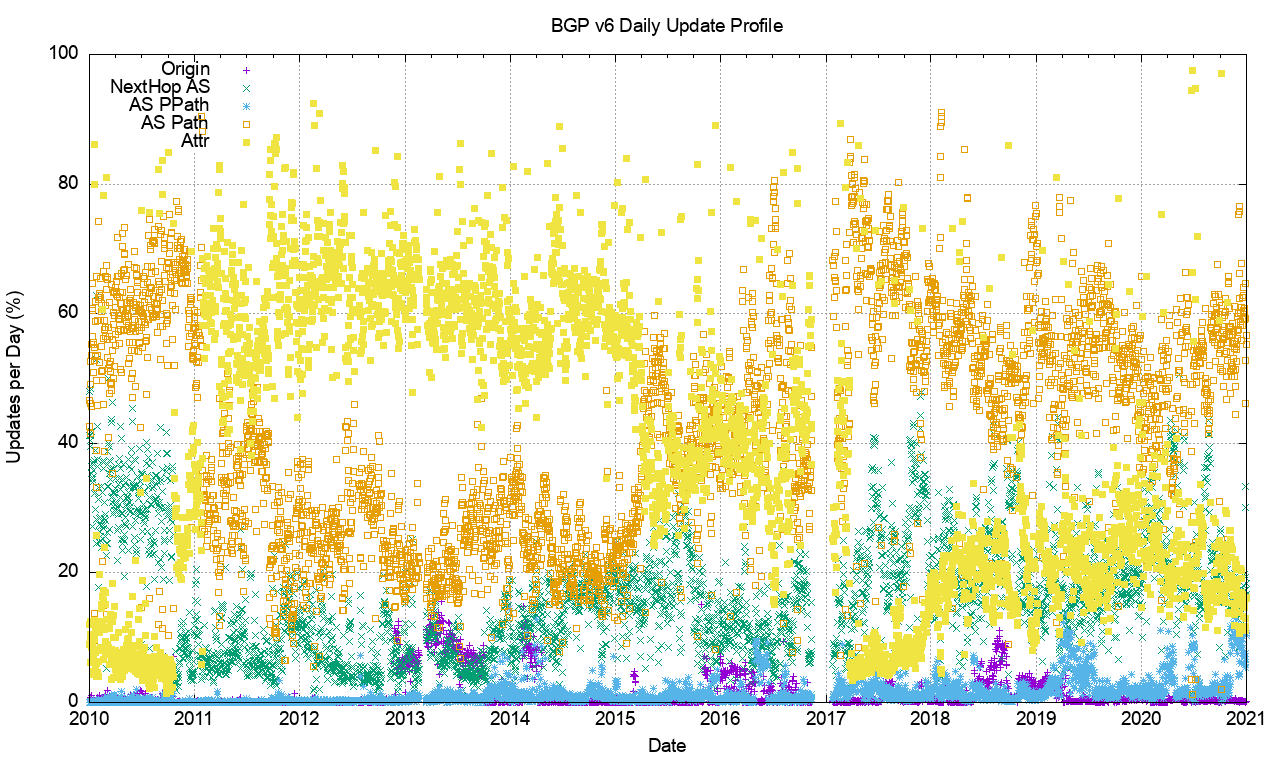
Another way of looking at this data is to remove the absolute volume of updates and look at the update types as a proportion of the total number of updates seen each day (Figures 18 and 19).
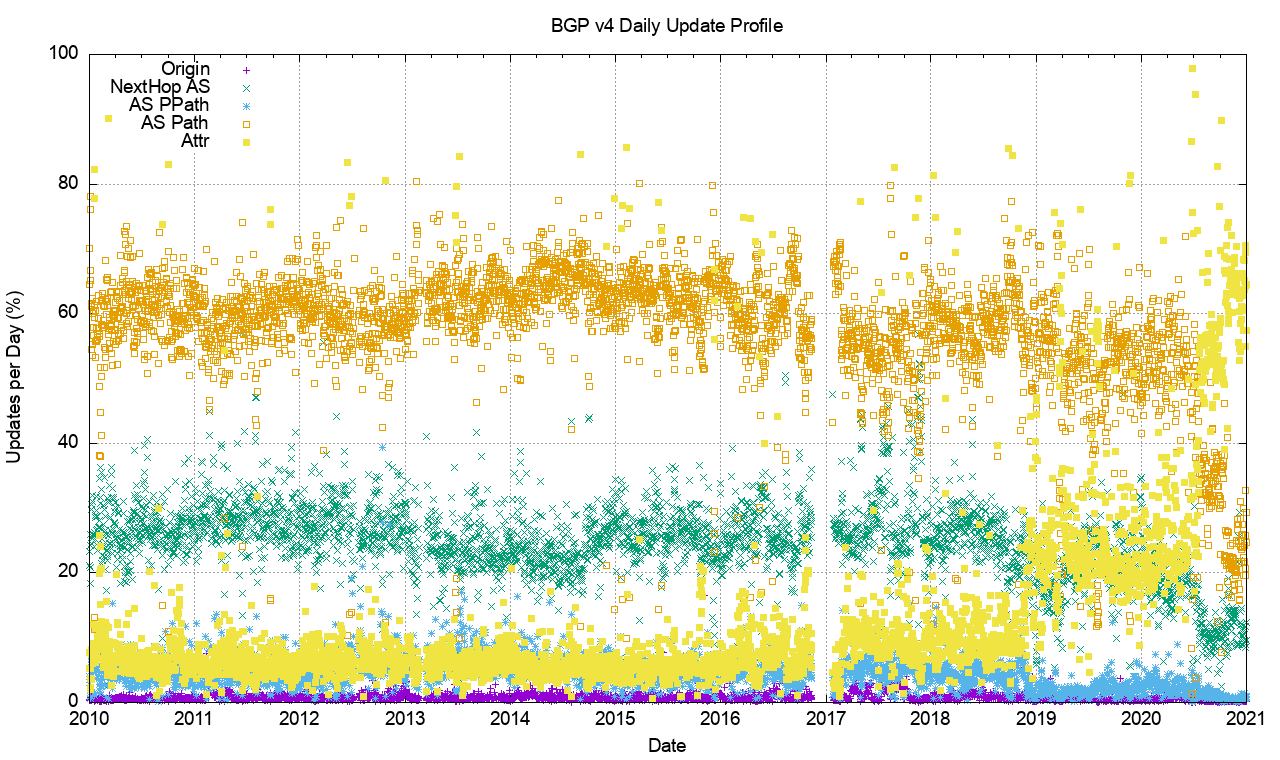
In IPv4, most (60%) of the BGP updates describe changes in the attributes of a BGP route object. Slightly less than 30% of the changes occur with the AS Path and the origin AS.
IPv6 has a distinctly different profile, with 60% of updates causing changes in the AS path, while attribute and next-hop AS updates are each around 20% of the remaining BGP updates.
Instability to be expected
It is likely that much instability is due to BGP oscillation when negotiating routing policies relating to multiple paths.
As a distributed algorithm, BGP itself is not a deterministic process. When the protocol is attempting to negotiate a stable outcome between the BGP preferences of BGP speakers announcing reachability across multiple egress paths, and BGP listeners applying local preferences across several ingress paths, then some level of instability is not unexpected.
Indeed, what is perhaps most surprising here is that these BGP updates are low, particularly when the underlying topology appears to show such a rich level of interconnection. When a BGP environment becomes unstable and flips between multiple local states that are all equivalent, one might expect that the BGP update rate would increase uncontrollably.
Read: BGP in 2019 – BGP churn
Mitigating this situation is BGP’s MRAI damping interval. BGP will only emit updates every MRAI seconds, and only pass on the current state of each updated prefix at that time, damping out any form of higher frequency local route oscillation. The commonly used value of 27 – 30 seconds (varied randomly each MRAI interval) is the most likely explanation of why BGP appears to be so well behaved in terms of update rates.
The cost of this MRAI timer is reflected in the average time to route convergence, which is steady at 50 seconds in IPv4 (Figure 4) and varies between 50 and 300 seconds in IPv6 in a long-term oscillation with a period of some months (Figure 10).
This is of course far longer than the 50ms time to converge, commonly cited within the industry as ideal (although why the value of 50ms has been chosen is baffling, as there is no known justification for this particular value).
From time to time the discussion takes place on reducing the MRAI timer value for all eBGP speakers. Such a change could possibly result in faster average convergence times, but what is not so clear is the relationship between MRAI timer settings and overall BGP update volumes. It is likely that the widespread use of a smaller MRAI timer in the eBGP environment would result in an increased volume of BGP updates.
Instability and traffic engineering
BGP is used for two functions.
The first is the maintenance of the network’s inter-domain topology. BGP ‘discovers’ the set of reachable networks through the conventional operation of a distance vector-style distributed routing protocol. It’s not that every BGP speaker assembles a complete map of the connected state of the network.
BGP’s objective is slightly different, in that each BGP speaker maintains a list of all reachable address prefixes and for each prefix maintains a next hop forwarding decision that will pass a packet closer to its addressed destination.
The second part of the use case can be more challenging. BGP is used to negotiate routing policies, or so-called ‘traffic engineering’.
If a network is connected to two upstream transit providers and one offers a lower price than the other, then the local network may prefer to use the lower cost network for all outgoing traffic, all other things being equal.
Incoming traffic also needs to be considered, so the local network operator would like to bias the route selection policies of all other networks such that the lower cost transit network is used to reach this local network. Outgoing traffic can be groomed to match local policies by using local policy settings in the interior routing space, but incoming traffic can only be ‘groomed’ by using BGP to bias other networks’ route selection policies.
There are several ways of achieving this, but the basic observation is that if you wish to groom incoming traffic according to a number of different policy settings then you need to advertise a collection of address prefixes to be associated with each policy setting.
The most common routing practice is to advertise the aggregate route set to all adjacent peers, and then selectively advertise more-specific routes to some adjacent peers, to implement these routing policies. What we would expect to see in this scenario is that the aggregate routes and the more-specifics may well have differing AS paths, but they would share the same origin AS.
A variant of this form of traffic engineering exploits the fact that the BGP route selection algorithm will prefer shorter AS paths when all other factors are equal.
A BGP speaker may elect to artificially increase the AS path length on the less preferred ingress path by adding repetitions of its own AS to the AS path to the less preferred eBGP peer. Any form of instability in path selection between these multiple ingress paths would be reflected as a set of updates that retain the same origin AS, the same next-hop AS, and the same AS sequences in the AS path, but the paths differ across successive updated in the amount of AS prepending contained with the path.
A somewhat different scenario occurs when an end site uses an address prefix from a provider’s address block but wants to define a unique routing policy. In this case, the end site would use its own AS number, so that the aggregate and its more-specific would use different origin AS numbers.
It is also possible that the network operator is advertising more-specific routes as a means of mitigating, to some small extent, the impacts of a hostile route hijack. In this case, the aggregate route and the more-specific route would share a common origin AS and a common AS path.
We can look at the route table to see the prevalence of each of these types of advertised prefixes. Figure 20 shows the relative proportion of the prevalence of each of these four types of route advertisement:
- a root prefix which has no covering aggregate
- a hole prefix where the origin AS of the more-specific prefix differs from the origin AS of the covering aggregate
- a path prefix where the more-specific prefix shares the same origin AS, but has a different AS path
- a more-specific prefix where the AS path of the more-specific and the covering aggregate are the same
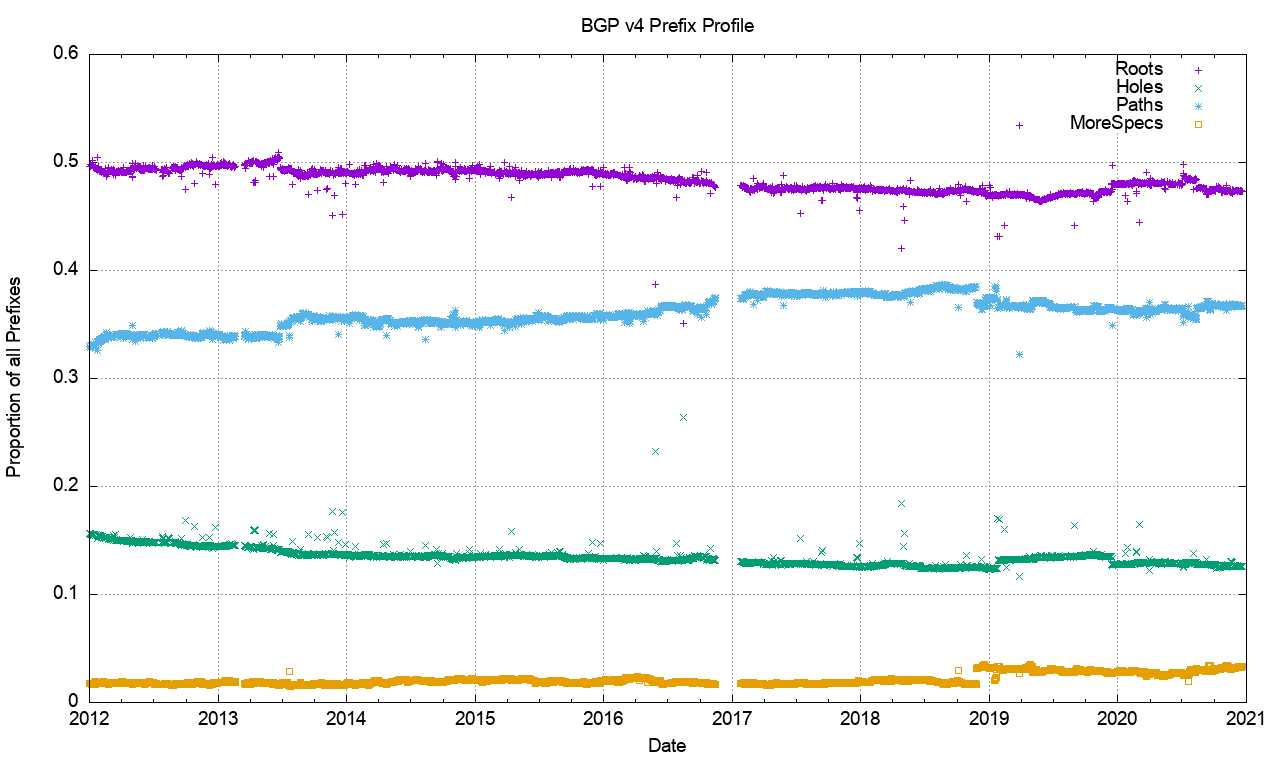
Over the past six years, the proportion of root prefixes has declined slightly, as have hole prefixes, while the number of path (different-path more-specific) prefixes has risen slightly. The high proportion of path prefixes points to prevalent use of more-specifics in the IPv4 network, for traffic engineering purposes.
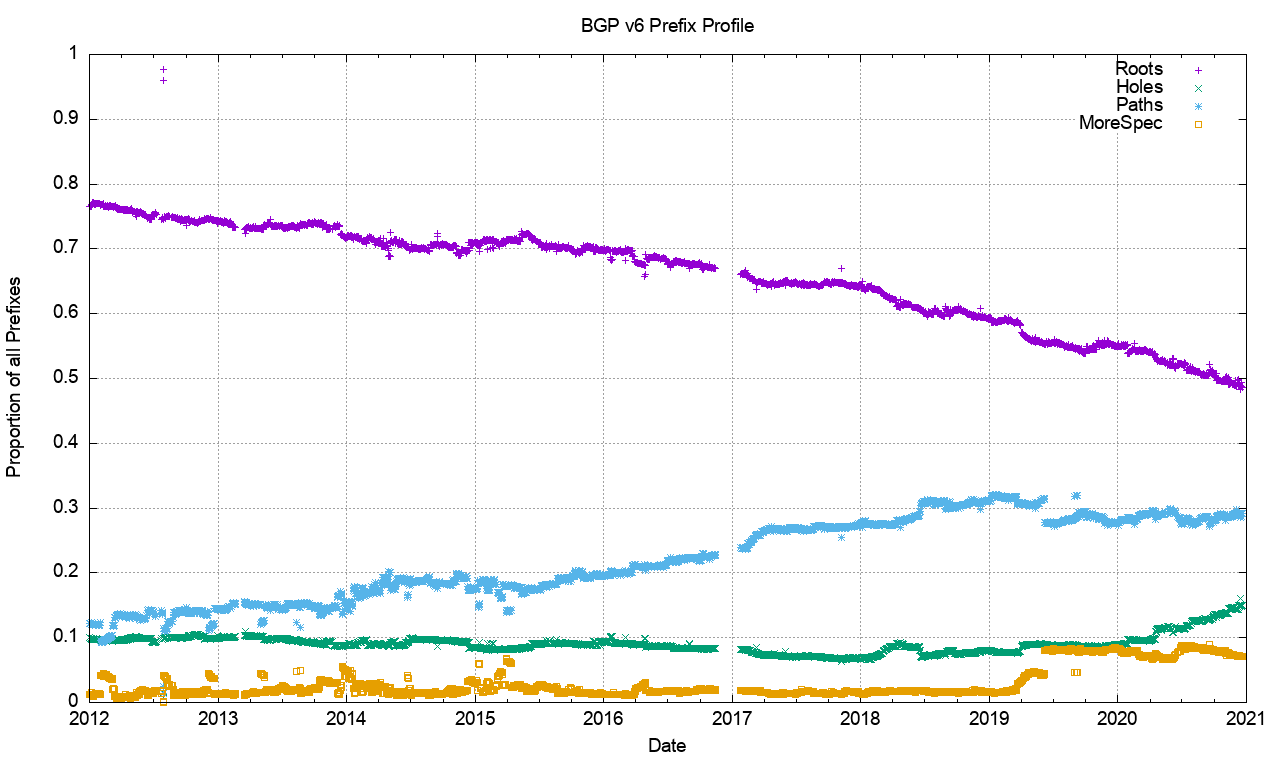
A comparable view of the IPv6 network (Figure 21) shows a similar picture but in a more exaggerated form.
The relative incidence of root prefixes has declined from 95% to 50%, which the number of path/more-specific prefixes has risen from 10% to 30%. A possible explanation is that as IPv6 changes from being a low use trial to become part of the service environment considerations of traffic engineering rise in importance, and the number of different path/more-specific reflects this changing perception of the role of the IPv6 network. The relative count of IPv6 hole prefixes has risen in the last half of 2020.
Are each of these prefix types equally likely to be the subject of BGP updates? Or are some prefix types more stable than others? An intuitive guess would see root prefixes being more stable than traffic engineering prefixes, as would the hole-punching more-specific prefixes. The other two types of more-specific prefixes would more likely be unstable.
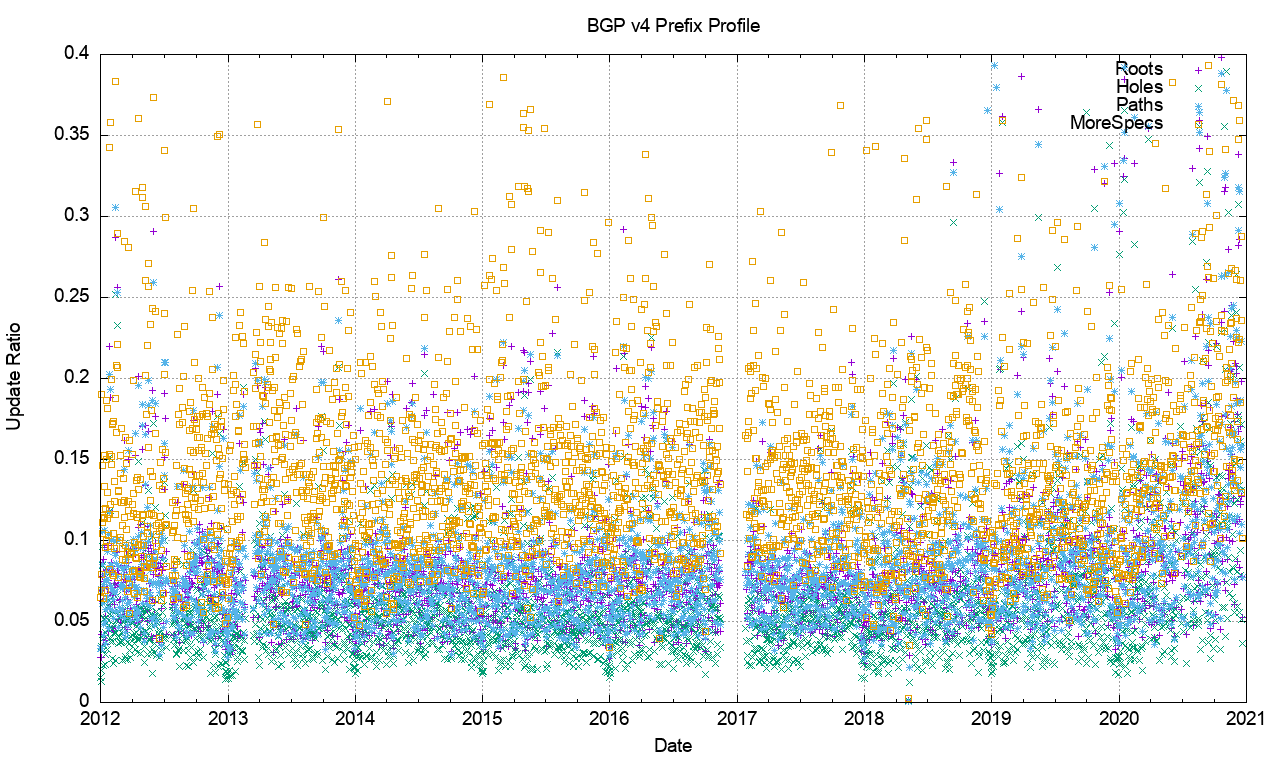
Figure 23 shows the day-to-day calculation of the relative proportion of BGP instability. It plots the number of updated prefixes, per day, of each prefix type, compared to the total number of prefixes of that type. It is a relatively noisy picture, but some general trends are visible.
More-specific prefixes that have the same AS path as their covering aggregate are more likely to be updated as compared to other prefix types. Root prefixes and path prefixes (more-specifics with different AS paths) appear to have a similar update ratio. Hole-punch more-specifics (different origin AS) are the most stable of the prefixes in the IPv4 network.
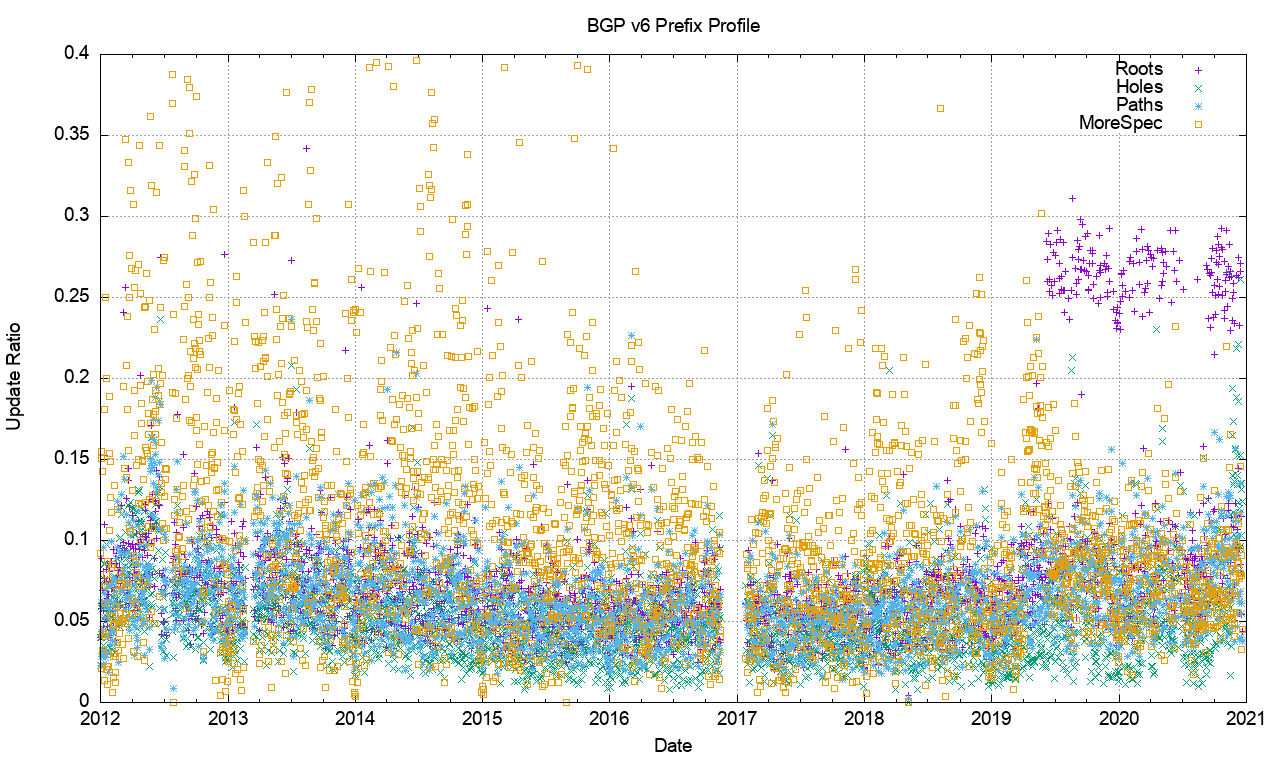
The same analysis has been applied to the IPv6 network (Figure 23). A similar picture is evident in the data, but the level of day-to-day variation is far more evident.
Interestingly, 2019 saw a sharp rise in instability of root prefixes, which has remained the case for much of the time in the ensuing two years.
Conclusions
None of the BGP churn metrics indicate that we are seeing such an explosive level of growth in the routing system that it will fundamentally alter the viability of carrying a full BGP routing table anytime soon. The BGP update activity is growing in both the IPv4 and IPv6 domains.
The changes in IPv4 tend to suggest that there is dynamic ‘ornamentation’ of IPv4 route objects, but such changes do not appear to alter the basic reachability or forwarding paths, so the benefit of these attribute changes are not immediately obvious.
The clustered nature of the Internet, where the diameter of the growing network is kept constant while the density of the network increases, implying that the dynamic behaviour of BGP, as measured by the average time to reach convergence, has remained very stable in IPv4 and is bounded by an upper limit in IPv6. The incidence of BGP updates appears to be largely unrelated to changes in the underlying model of reachability, and more related to the adjustment of BGP to match traffic engineering policy objectives. The growth rates of updates are not a source of any great concern at this point in time.
The views expressed by the authors of this blog are their own and do not necessarily reflect the views of APNIC. Please note a Code of Conduct applies to this blog.
One part of the explanation for why #announcements is rising when #withdrawals are staying constant is likely that the convergence process of a withdrawal may take more announcements the larger the topology is, i.e., more alternative paths needs to be explored until the final withdrawal is sent.
Maybe you mentioned it, but the increase in churn (#updates) over time has been shown to be proportional to the topology size (#ASes). Most recently by Jia et al. in 2019.
Thanks for this comment. In a distance vector protocol the system converges when the updates run to exhaustion and there are no further refinements to each speaker’s “best path”. There is a topology consideration here, however. In a dense mesh the diameter of the topology is far more important than the number of speakers. So the average AS Path length in the topology should have a far greater influence on updates over the number of BGP speakers – this work dates back to work of Craig Labowitz in his merit days in the early 90’s.
From that stance the assertion that update counts are proportional to the number of ASes does not appear to be a well founded assertion. I am still a little perplexed to see update counts rising while the AS path lengths remain roughly constant, and I suspect that a detailed study that attempts to characterise updates and behaviours, in a way similar to earlier work on Path Exploration to Withdrawal some years ago might inform our thinking of with we are seeing highler levels of BGP instability these days.