

The Internet no longer follows the traditional hierarchical topology, where traffic between networks at the bottom of the hierarchy (for example, user and content provider networks) must traverse the hierarchy’s upper tiers to exchange traffic. Now, many of the Internet’s networks establish direct connectivity between each other, effectively bypassing the few dozen networks that occupy the traditional Internet hierarchy’s apex.
The phenomenon of bypassing the traditional hierarchy, primarily the networks of the Tier-1 and Tier-2 Internet Service Providers (ISPs), is known as Internet flattening.
Unfortunately, direct connections are not visible to most measurement techniques and existing metrics do not capture these aspects of the modern Internet. This means that the most used Internet topologies for modelling the Internet are missing most links used by the hugely important cloud providers.
In addition, the value of the most used metrics do not actually change as flattening increases. For example, customer cones would tell us who is reachable through customer links. However, only examining customer links misses all the connectivity enabled by the rich peering we see with flattening and does not reflect the reachability of various networks in a flattened Internet.
Understanding the progress of Internet flattening
To understand the extent of Internet flattening, we first need to uncover the missing links in the Internet’s topology maps, and second, understand to what degree the missing links enable the cloud providers to bypass the traditional Internet hierarchy of Tier-1 and Tier-2 providers. This will allow us to not only capture the progress of flattening but understand how much these cloud routes have been hidden from the traditional approaches to examine the Internet’s topology.
We begin our examination by constructing an Autonomous System (AS) level topology graph of the Internet. The foundation for constructing our graph is to use CAIDA’s serial2 AS relationship dataset, which is gathered using Border Gateway protocol (BGP) monitors that receive routing message updates from networks around the Internet.
While datasets constructed in this manner have a high accuracy rate for identifying customer links, they have poor visibility into peer links that contribute to Internet flattening. To identify the progress of Internet flattening from the cloud providers’ perspective, we identify additional neighbours of the cloud providers from traceroutes we source from virtual machines inside the cloud providers.
Calculating hierarchy-free reachability
To understand the progress of Internet flattening, rather than counting the number of networks reachable via customer links, we also look at which networks are reachable through a network’s peers as well. We determine reachability using our AS-level topology to emulate BGP route propagation, while enforcing common routing policies. So, if AS B receives a prefix announcement from AS A, AS B is reachable by AS A.
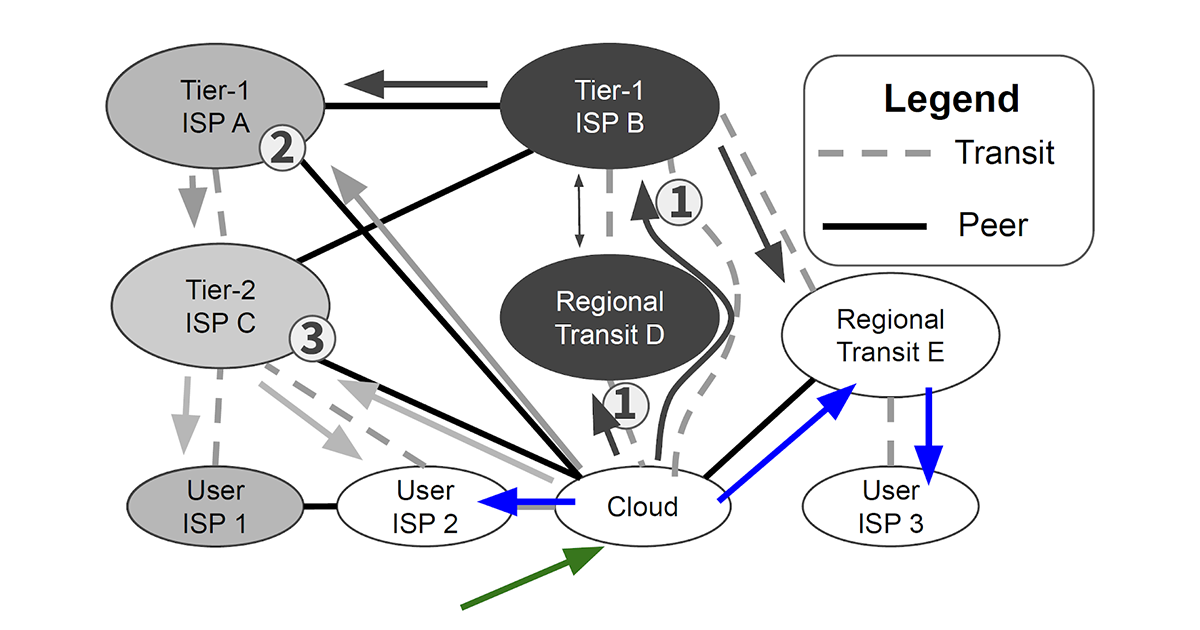
We do not consider propagating routes through a network’s providers, only through its peers and customers. We make two additional restrictions: we do not propagate announcements through Tier-1 or Tier-2 peer links, because those would provide access to the traditional Internet hierarchy. We can see an example of this in Figure 1, where the cloud announces a prefix that is ultimately received by three other networks, resulting in a reachability of three ASes.
We define the number of reachable ASes, when applying the constraints described above, as the hierarchy-free reachability of a given network.
What hierarchy-free reachability reveals
If we examine the reachability of the Internet’s networks without traversing the traditional hierarchy, we can see that there are a large number of networks that still have high reachability, showing that the progress of Internet flattening is quite extensive. Figure 2 shows the hierarchy-free reachability for all networks on the Internet (y axis) compared to each network’s customer cone (x-axis in log scale).
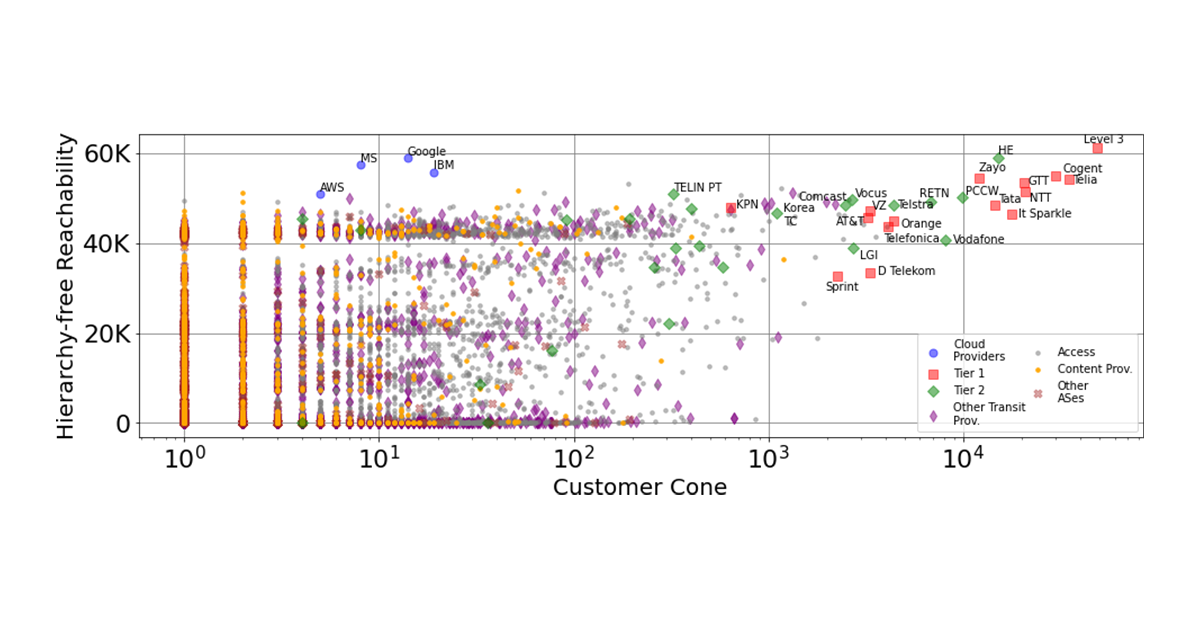
We can see in Figure 2 that the cloud providers have very high reachability, compared to most other networks. In fact, Google, Microsoft, and IBM have higher reachability than every network other than Level 3 and Hurricane Electric.
We can also see the progress of Internet flattening, by the number of networks with large hierarchy-free reachability compared to the number with a large customer cone. There are only 51 networks with a customer cone ≥ 1,000 ASes, while there are 8,374 networks with hierarchy-free reachability ≥ 1,000.
This comparison highlights two things: the vast connectivity available to networks via peer connections, and customer links do not paint a complete picture of Internet connectivity. There are thousands of networks that are also able to reach a sizeable portion of the Internet without traversing the hierarchy, providing insights into the benefits of flattening that is not captured by other metrics.
To learn more about our study, read our IMC 2020 paper; our cloud provider neighbour datasets are also available for download.
Todd Arnold is a research scientist at the Army Cyber Institute and an Assistant Professor in the Department of Electrical Engineering and Computer Science at West Point.
The views expressed by the authors of this blog are their own and do not necessarily reflect the views of APNIC. Please note a Code of Conduct applies to this blog.