

There have been growing concerns over the last few years about the excessive concentration of control over the Internet’s markets and infrastructure — what is commonly referred to as Internet centralization.
Key points:
- Five cloud providers are responsible for third of the DNS queries to two ccTLDs (.nl and .nz).
- The providers differ, in some cases significantly, in terms of their adoption and use of DNSSEC, IPv6 and TCP.
- The positive side of centralization is that when a provider adopts a privacy-friendly technology, it benefits a large user base.
Perhaps the most public of these concerns has been from governments, particularly in the US, where many of the main players are based. Just this October, the US Department of Justice (DoJ) formally accused Google of illegally protecting its monopoly following its previous antitrust review of the big tech companies. The US House Lawmakers have also condemned ‘Big Tech’s monopoly power‘. Similarly, in the European Union, regulators have also long been trying to curb Big Tech powers.
However, governments are not the only ones paying attention to this issue. There has been an IETF draft covering the issue of centralized infrastructures for the Internet, followed by a journal article. The Internet Society, in turn, released a report addressing how consolidation will impact the “Internet’s technical evolution and use”. Furthermore, some Big Tech companies currently rely on surveillance as their business model, raising serious privacy concerns.
From the technical point-of-view, centralization increases the risks of creating a single point of failure. In 2016, when Dyn, a large Domain Name System (DNS) provider was hit by a major DDoS attack, some of its US-based clients could not reach prominent websites such as Twitter, Netflix, Spotify, Airbnb, Reddit, Etsy, SoundCloud and The New York Times.
Making claims about Internet centralization is one thing, measuring it and its effect, particularly from a technical standpoint, is something that has not been easy to do. One method that my colleagues and I recently experimented with and presented our findings on at the ACM IMC 2020 conference and the RIPE 81 meeting, is to analyse the DNS traffic from cloud and content providers to see how market dominance is reflected in traffic dominance.
Over the last three years, we have analysed the DNS traffic generated by Amazon, Google, Microsoft, Cloudflare and Facebook from authoritative DNS servers in three different zones: two country-code top-level domains (ccTLDs) — The Netherland’s .nl (6M domain names) and New Zealand’s .nz (710K domain names) — and B-Root, one of the 13 root servers.
For our study we analysed 55.7 billion queries (~30B from .nl, 12B from .nz, and 14B from B-Root), covering snapshots from 2018 through 2020, as shown in Table 1 below. For example, in the snapshot week of 2020, we see that .nl received 13.75B queries, from 1.99M unique addresses (resolvers, both IPv4 and IPv6), from 41,717 Autonomous Systems (ASes).
| .nl | ||||
|---|---|---|---|---|
| Week | Queries (total) |
Queries (valid) |
Resolvers |
ASes |
| w2018 | 7.29B | 6.53B | 2.09M | 41276 |
| w2019 | 10.16B | 9.05B | 2.18M | 42727 |
| w2020 | 13.75B | 11.88B | 1.99M | 41716 |
| .nz | ||||
| Week | Queries (total) |
Queries (valid) |
Resolvers | ASes |
| w2018 | 2.95B | 2.00B | 1.28M | 37623 |
| w2019 | 3.48B |
2.81B | 1.42M | 39601 |
| w2020 | 4.57B | 3.03B | 1.31M | 38505 |
| B-Root | ||||
| Date | Queries (total) |
Queries (valid) |
Resolvers | ASes |
| 2018/04/10 | 2.68B | 0.93B | 4.23M | 45210 |
| 2019/04/09 |
4.13B | 1.43B | 4.13M | 48154 |
| 2020/05/06 | 6.70B | 1.34B | 6.01M | 51820 |
Table 1 — Evaluated datasets for .nl, .nz and B-Root DNS servers (2018 to 2020).
How much traffic comes from the cloud?
To determine the percentage of traffic originating from each cloud provider (CP), we mapped each query source IP address to its respective AS. We aggregated the results per AS and used the cloud’s AS to attribute traffic.
| Company | ASes | Public DNS |
|---|---|---|
| 15169 | Yes | |
| Amazon | 7224, 8987, 9059, 14168, 16509 | No |
| Microsoft | 3598,6584, 8068–8075, 12076, 23468 | No |
| 32934 | No | |
| Cloudflare | 13335 | Yes |
Table 2 — Cloud/content providers and their ASes.
5 clouds: ⅓ of the traffic
The figure below shows the results of query volume data per CP. For the Netherlands and New Zealand, we see that the five CPs are responsible for around 1/3 of all DNS queries. That is a significant concentration, especially considering that together the clouds consist of 20 ASes, while .nz and .nl are visited by roughly 40,000 ASes a week.
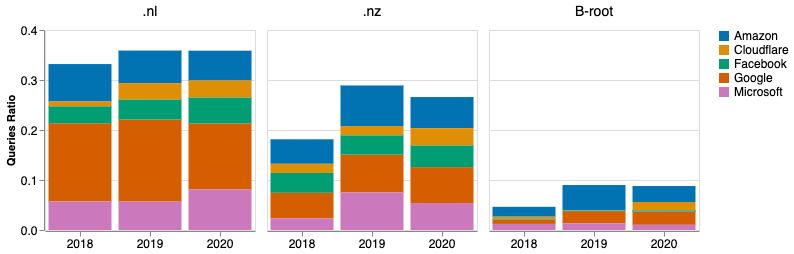
The traffic to B-Root is less concentrated — less than 10% of the traffic comes from these clouds. A reason for this may be that B-Root receives lots of chromium browser-based queries.
Oddly, Google is more dominant in the .nl traffic than the .nz traffic— showing different cloud market penetration according to the vantage points. And its Google Public DNS service is responsible for the bulk of the queries: almost 90% of all queries for both NZ and NL.
What records do cloud providers ask for?
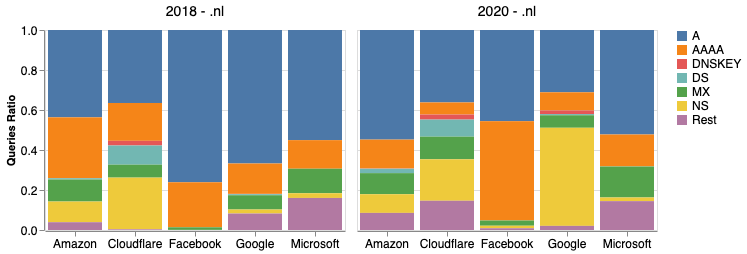
As a distributed database, the DNS can be used to store different types of records. Figure 2 below compares the popularity of record types for .nl in 2018 and 2020 (.nz and B-Root follow similar patterns). From the graphs, we can see that A records (IPv4 addresses) are the most popular, followed by AAAA (IPv6 addresses).
Where Google is concerned, we can also see a considerable increase in NS records (records that store authoritative name servers) in 2020. Why did that change take place?
Analysing the query names, we found that Google deployed QNAME Minimization (RFC 7816) in December 2019. Resolvers that conform to this RFC send the minimum information required about the domain names to their authoritative servers, to protect user’s privacy. And RFC 7816 specifies that NS queries should be sent first — which explains the increase in the proportion of NS queries.
To confirm that we analysed monthly NS queries from Google — Figure 3 shows the change distinctly.
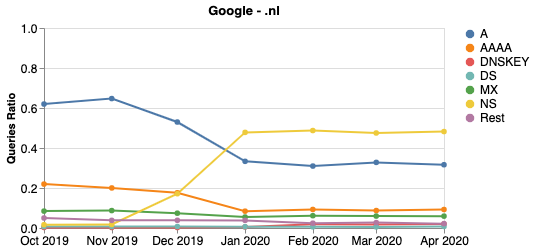
The finding highlights an advantage of centralization: when one privacy/security feature is deployed, it protects many users at once.
Comparing clouds
Given that all vantage points (.nz, .nl, and B-Root) serve all the clouds, we can compare the various clouds, in terms of technology adoption, including DNSSEC usage, IPv4 vs IPv6 traffic, and UDP vs TCP usage.
DNSSEC deployment
DNSSEC provides authenticity and integrity for the DNS. Given these five CPs are so large, one would expect them to be equally up to date with DNSSEC adoption.
We can measure DNSSEC adoption by analysing the volume of DNSKEY queries (that is, queries for a DNSKEY, which is a particular type of DNS record). Figure 4 shows the data for .nl in 2020 (.nz has similar figures, as reported in the paper):
- Microsoft sent 0.02M DNSSEC queries, out of 1.1B in the same period (0.001% of the total).
- Cloudflare sent 11M, out of 460M queries (2.3% of the total).
The significant difference in the proportion of DNSSEC-related queries shows how dissimilar the CPs are when it comes to technology adoption. Thus, we cannot assume all CPs are similarly up to date.
IPv6 uptake
As with DNSSEC, we can also measure IPv6 usage amongst the CPs. We initially expected similar results, but it turned out that there was considerable variation in results, as seen in Table 3.
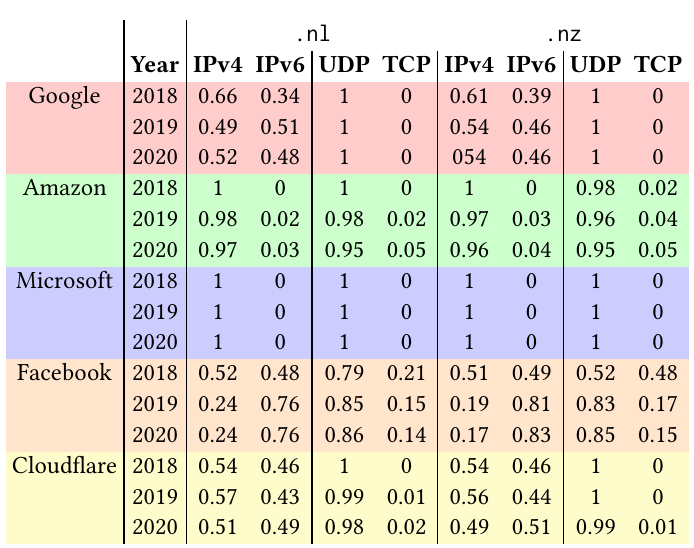
Again, we found dissimilar patterns among the CPs where both .nz and .nl were concerned:
- Good balance of IPv4/IPv6: Google, Facebook, Cloudflare
- More IPv6 from 2020: Facebook
- Very little IPv6: Amazon and Microsoft
Previous research has shown that resolvers, when presented with multiple authoritative servers, tend to send more traffic towards the one with the lowest latency values. But they still use all of the authoritative servers.
So, what could explain the observed differences? On possibility is the size of the resolver infrastructure. We see in Table 4 that Amazon and Microsoft have far fewer IP addresses reaching the .nz and .nl authoritative servers.
| .nl | .nz | |
| Amazon | 38317 | 34645 |
| IPv4 | 37,640 (98.2%) | 33,908 (97.9%) |
| IPv6 | 677 (1.8%) | 737 (2.1%) |
| Microsoft | 14494 | 10206 |
| IPv4 | 14,069 (97%) | 9,738 (95.4%) |
| IPv6 | 425 (3.0%) | 468 (4.6%) |
Table 4 — Amazon and Microsoft DNS resolvers (week during 2020).
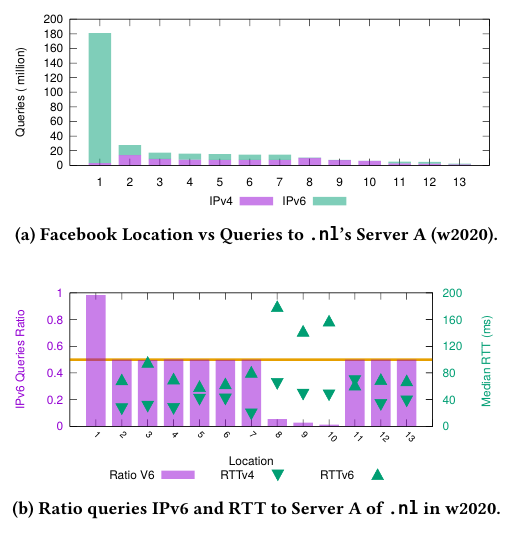
With a view to understand why Facebook has been sending more IPv6 queries in 2020, we mapped each IP address from Facebook using reverse DNS. That enabled us to map the IP addresses to names and locations (they use airport codes for their servers).
As shown in Figure 5, we observed 13 locations with location 1 sending the bulk of the queries. We then analysed the RTT of their TCP queries and saw that most locations confirm the resolvers’ preference:
- Location 8, 9 and 10 send mostly IPv4 queries because the median RTT for IPv4 is shorter than IPv6.
- The remaining locations have a more balanced distribution, because their RTTs for IPv4 and IPv6 are more similar.
- However, we cannot say anything about location 1’s DNS TCP RTT, because it sends very few TCP queries. Unfortunately for us, it is also the location that sends most of the queries.
UDP/TCP usage
Finally, we analysed the CPs’ transport protocol of choice, with UDP dominating — it delivers faster responses within a single RTT, whereas TCP requires an extra RTT due to its handshake.
| >.nl | >.nz | ||||
|---|---|---|---|---|---|
| Year | UDP | TCP | UDP | TCP | |
| 2018 | 1 | 0 | 1 | 0 | |
| 2019 | 1 | 0 | 1 | 0 | |
| 2020 | 1 | 0 | 1 | 0 | |
| Amazon | 2018 | 1 | 0 | 0.98 | 0.02 |
| 2019 | 0.98 | 0.02 | 0.96 | 0.04 | |
| 2020 | 0.95 | 0.05 | 0.95 | 0.05 | |
| Microsoft | 2018 | 1 | 0 | 1 | 0 |
| 2019 | 1 | 0 | 1 | 0 | |
| 2020 | 1 | 0 | 1 | 0 | |
| 2018 | 0.79 | 0.21 | 0.52 | 0.48 | |
| 2019 | 0.85 | 0.15 | 0.83 | 0.17 | |
| 2020 | 0.86 | 0.14 | 0.85 | 0.15 | |
| Cloudflare | 2018 | 1 | 0 | 1 | 0 |
| 2019 | 0.99 | 0.01 | 1 | 0 | |
| 2020 | 0.98 | 0.02 | 0.99 | 0.01 | |
Table 5 — UDP and TCP query proportion for .nl and .nz.
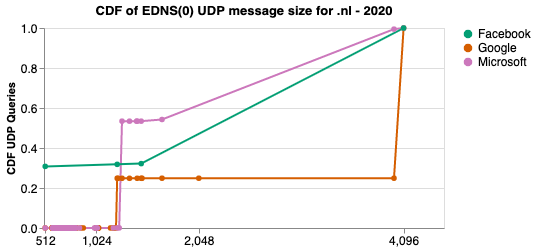
As with the other technologies, not all clouds are the same. Facebook, for example, sends proportionally far more TCP queries than the others. We wondered why that could be. Typically, TCP is used as a fallback mechanism for large responses — if the authoritative server cannot fit a response into a single UDP response, it should truncate it, and resolvers should query again with TCP.
The limit on UDP queries is partially controlled by the resolvers, which can advertise their EDNS0 buffer size. That tells the authoritative server the maximum size of UDP responses that the resolver can process.
We looked into Facebook-advertised EDNS0 buffer size, and found that roughly ⅓ of them were 512 bytes long, which is indeed very small. For example, the DNS Flag Day 2020 recommends a buffer size of 1,232 bytes. That would explain why there is more truncation and more TCP queries are sent.
For more details, watch the video presentations of our research paper at RIPE 81 and IMC 2020, and read our research paper.
Contributors: Sebastian Castro and Wes Hardaker.
Giovane Moura is a Data Scientist with SIDN Labs, the research arm of the .nl registry.
The views expressed by the authors of this blog are their own and do not necessarily reflect the views of APNIC. Please note a Code of Conduct applies to this blog.