
Absent industry-driven answers on just how much unwanted traffic is too much, the aim of this article is to share some data on the amount of traffic an IPv4 host might expect to see and to begin to outline some perspectives on what it looks like from the end hosts that are getting hit by it.
In summary:
- There’s more unwanted traffic out there than you (probably) think
- It’s from everywhere and persistent
- It’s not reasonable to block list everything as a defensive posture
Over four years ago, the Global Cyber Alliance (GCA) established a worldwide honeyfarm, with hundreds of sensors, to collect IoT attack traffic for analysis. GCA now has terabytes of data, with over a million hits a day on the honeyfarm sensors. If nothing else, it clearly communicates that the Internet is full of a lot of unwanted traffic, hammering unsuspecting devices.
In order to have a clearer picture of the global impact on any exposed IPv4 device, we analysed (approximately) five months of data from our honeyfarm sensor network. In that timeframe, our ~200 sensors deployed across the globe saw attacks from over 10% of the estimated active Autonomous Systems (ASes) making up the Internet. While some were small-scaled offenders, approximately 20% of these networks fielded more than 1,000 attacks on our sensors (our sensors are passive collectors, not expecting any form of connection from elsewhere. We filter out ‘scan’ traffic, and any other login or access attempts are considered ‘attacks’).
160-day view
Over the course of 160 days — from 29 November 2021 to 8 May 2022 — here’s what we saw from our ~200 globally-distributed sensors:
- Saw attacks from 10,823 ASes
- 2,183 of the ASes fielded more than 1,000 attacks on our sensors
- 40 of the ASes launched attacks from more than 1,000 distinct IP addresses
- Were touched by 274,494 distinct IP addresses
With that aggregate picture in hand, we did some further analysis to see if we could get a sense of what makes a ‘bad’ network. (Unless otherwise stated, the time period covered by the following charts is the same 160 days noted above).
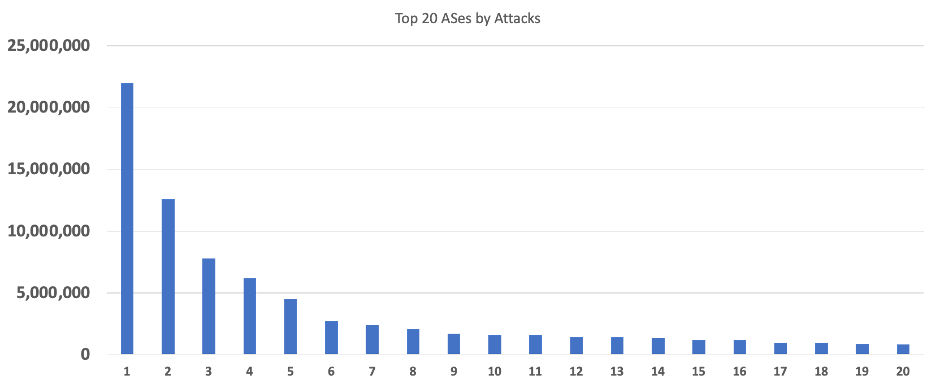
Figure 1 shows the top 20 ASes, ranked by the number of attacks on our sensors. The top-ranked AS spewed an astonishing 20M+ attacks at our sensors. But, even the ‘tail’ ASes in the top 20 were sending significant amounts of unwanted traffic.
Depending on the number of hosts in the network, it’s possible that the sheer volume of attack traffic isn’t a great metric, because it could still be ‘noise’ from a network with many hosts. Another way we looked at the ASes was by the intensity of attacks from the individual IP addresses (the really ‘bad apples’). The following chart shows the ranking of the top 20 ASes by (average) number of attacks per attacking IP in the network. Again, the top-ranked AS shows an impressive amount of attack traffic per attacking IP address — but 18,000 attacks per IP address (in 160 days) at the right end of the spectrum still seems like it might be noticeable activity.
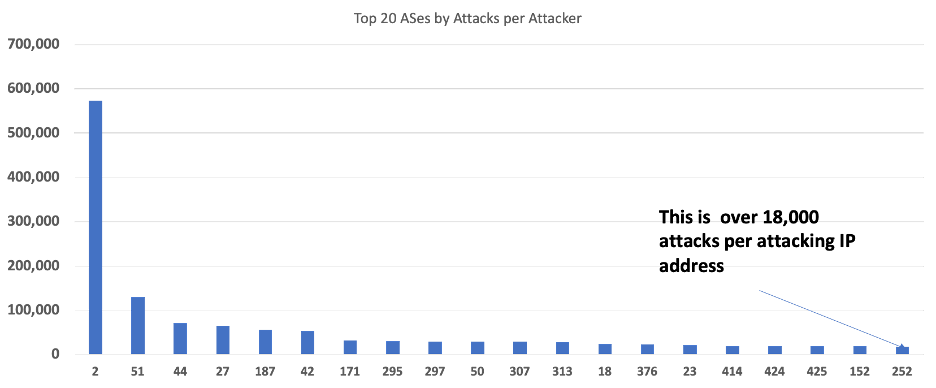
Note that the AS identifiers (not their real numbers) are consistent in both charts, however, they rank differently based on the type of analysis performed. For instance, the network that had the most attack traffic (AS 1) is not even in the top 20 networks with attacks by attacking IP address. Likewise, some of the networks that were way down the list of total attack traffic figure prominently in the second chart. These networks may have relatively few bad apples, but they are acting out very significantly.
Normal bad behaviour and bad bad behaviour
The point of the exercise wasn’t to name and shame any networks, but rather to compare and contrast bad behaviour in networks to get a sense of ‘normal’ or ‘(un)acceptable’. The top 20 in each of the charts above clearly stand out as unacceptable. But, where should the line be drawn for acceptability? What do network operators generally look for in monitoring their own networks, and what do they consider reasonable? The honeyfarm database from which these charts were drawn includes considerably more data about the attack sessions observed, including information relevant to the command and control of attacking botnets. What can we draw from that database to help inform network operators to establish industry norms for acceptability?
Much of the focus of cybersecurity efforts is, deservedly, on ensuring that hosts and edge networks can defend themselves against attacks. After ensuring that no one puts a device on the network with a default username and password, attention often turns to blocking. The reality is that there is network-level blocking put in operational practice today (AS-level blocking of connections). At the very least, extensive IP address block lists are common. Not only does this impact large segments of legitimate network usage (mysterious system failures, users able to connect to services from their phones but not their work notebook, for example), but it also contributes to ‘IP address reputation’.
Reputation has a habit of sticking around — impacting the resale value of IPv4 address blocks, for example. If for no other reason, network operators might be mindful of their network real estate ‘curb appeal’ and seek to ensure that they are not inadvertently harbouring cybercriminal activity.
Of course, informed, surgical blocking of known threat sources is good practice for edge networks, but as attacks and threat actors expand in scope and activity, there won’t be much Internet left to access if blocking is our only defence.
Perhaps it’s time to refocus some of our efforts and examine the underbelly of Internet traffic to see where the malicious traffic is coming from. Then we can talk about best practices for stopping it at its source. It’s not like this sort of industry collaboration is without successful precedent — the MANRS work is contributing significantly to improving the overall level of routing security awareness and implementation. Driven by what the industry knows it can and should do, it has set (and advanced) the bar based on operational realities, as opposed to strictly legislative or other external pressures.
If you are interested in further discussion or have any questions about whether your AS showed up in our study, we’d be happy to have a discussion with you. You can contact us at the Global Cyber Alliance.
Leslie Daigle is Chief Technical Officer at Global Cyber Alliance.
Adapted from the original post RIPE Labs.
The views expressed by the authors of this blog are their own and do not necessarily reflect the views of APNIC. Please note a Code of Conduct applies to this blog.
Good