

Give your DNS Statistics Collector (DSC) a facelift with a new Grafana dashboard, featuring a host of applications and metrics that will provide server administrators far richer commentary on the health of their DNS.
In this post I want to share the process we took to update our dsc-datatool and highlight some of the features that we’re hoping will change people’s perceptions of DSC as a checks and balance tool for the DNS.
Don’t worry, we’ve still retained a lot
For those unfamiliar, DSC is an open-source system for collecting and exploring statistics from busy DNS servers.
Originally it was developed as a community telemetry project, where OARC members and those running root servers were encouraged to share their DNS data (packets received, queries, responses) with one another to get a greater perspective of the DNS and compare how their system was faring. It’s still set up to allow users to do this, but mostly everyone now uses it to privately monitor their own systems.
It was designed to use a distributed architecture with collectors running on or near name servers, sending their data to one or more central presenters for display and archiving. Collectors use PCAP to sniff network traffic and transmit aggregated data to the presenter as XML data.
Data captured includes:
- Query types
- Response codes
- Opcodes
- Source addresses or subnets
- Query name TLD
- EDNS parameters
- Known types of DNS ‘pollution’
- Message sizes
- IP transport
- TCP/UDP ports
XML files are not everyone’s favourite format to work with; this was a major reason why we sought to create a tool to work with the data and to produce something more user friendly and compatible with today’s monitoring standards.
Redesigning the visual experience
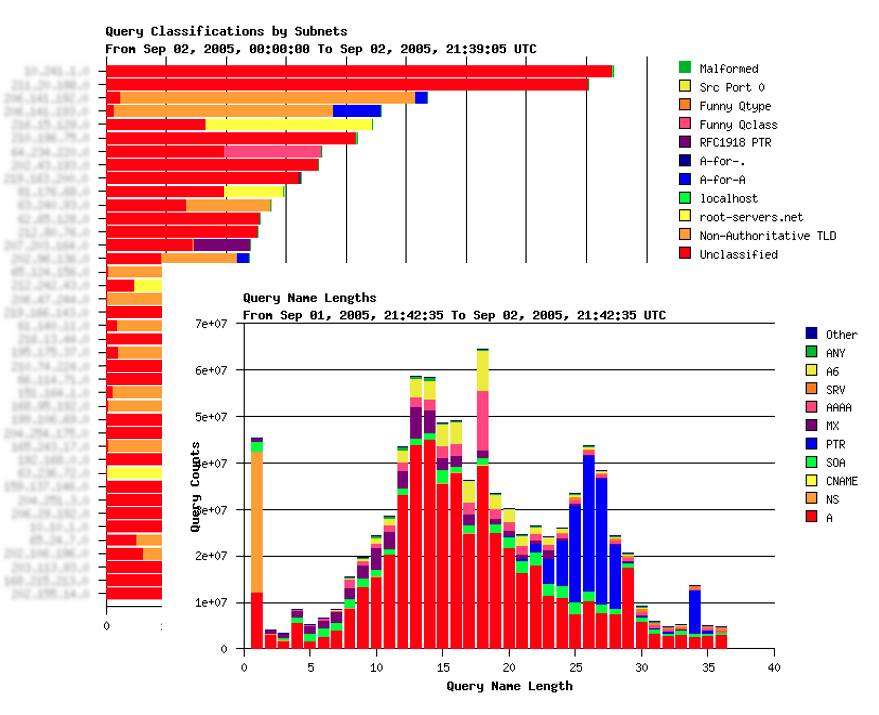
The DSC presenter, developed more than 15 years ago, comprises an aggregator, a few Perl CGI programs, and uses Ploticus to generate graphs.
A few years ago, I was working on how to progress this part of DSC and the first problem I saw was that it was using aggregated data of already aggregated data. This is not ideal if you want to customize graphs on the fly. The other problem was Ploticus — it’s an old plotting and graphing software that hasn’t seen any updates in many years.
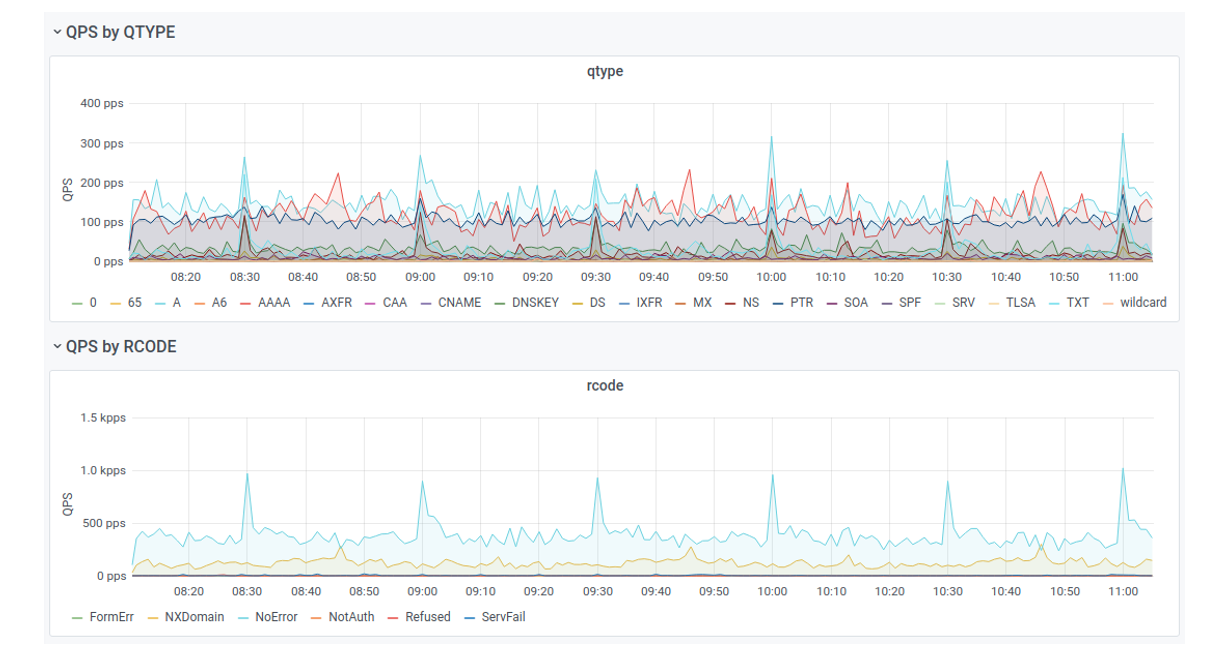
So, I started looking at what all the cool kids were using to visualize metrics and came across Grafana.
Grafana seemed to have it all: various backends support, easy graph creation, and easy navigation through time-series metrics. This led me to create the first version of dsc-datatool that successfully replicated all the functionality and graphs of the presenter by using Grafana.
On that note
I want to remind people that DSC is a very configurable collector! You can create your own two-dimensional datasets using any of the available indexers. See the example config and the man-page ‘dsc.conf’ for more information or reach out to me if you need help.
“To infinity and beyond!”
Even though dsc-datatool was quite a simple tool, it was based on a few modules that the aggregator used, and these had long been abandoned, which made maintaining the tool more and more difficult.
Luckily EURid came with a request to have the tool packaged on CentOS and after a short discussion they agreed to fund a rewrite of the tool, going from Perl to Python (which is more in use at OARC members then Perl) and to have it use well-supported modules in place of the old and abandoned ones.
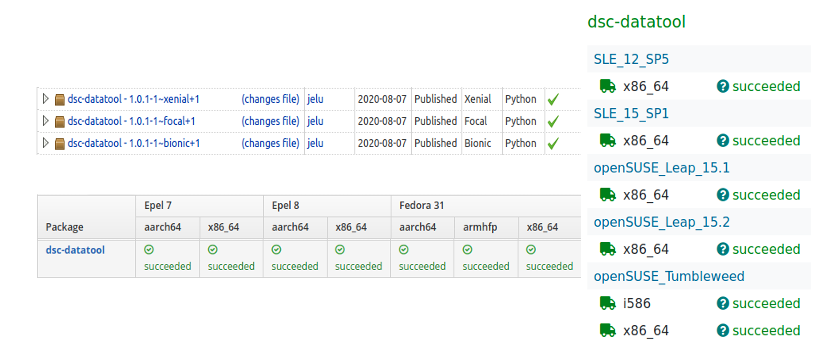
This rewrite made the dependency list go from a bunch of Perl modules down to two Python modules: PyYAML and maxminddb. Both these modules exist on all platforms and are very well supported, which made packaging a breeze!
Pics or it didn’t happen
For those interested, we have a demo running that shows live stats from one of OARC’s authoritative name servers. It also links to a wiki I wrote on how to set up an instance like it with example graphs, but please explore Grafana and make your own graphs and share your feedback!
The DSC source code is maintained by DNS-OARC. Download it today and let me know in the comments below what you think and what other features you’d like to see in the future.
DNS-OARC is a 501(c)3 non-profit, and if you want to support this project or further development of existing or new DNS open-source tools, please consider a donation, or become more involved by becoming a member!
Read: Rallying a community to protect core Internet service
Jerry Lundström is a software engineer with DNS-OARC.
The views expressed by the authors of this blog are their own and do not necessarily reflect the views of APNIC. Please note a Code of Conduct applies to this blog.