

Many companies use a Content Delivery Network (CDN) to serve static assets. Using a CDN allows you to offload static assets loading from origin servers, to then serve those assets as close to the end users as possible. With many points of presence across the globe, CDNs help deliver content to end users from a server in their city or economy, instead of downloading them from the original location, which could be much further away.
Still, picking a CDN is not an easy task. How do you measure a CDN’s performance? Which strategy do you apply? Should you use multiple CDNs? When approaching such a broad topic, there are different ways of evaluating and measuring your choices. We should back up each option with an analysis of the current state, the competitors in different regions where we operate and the performance from the perspective of different ISPs. There are negligible variations throughout different browsers and operating systems. We would rule these differences out as statistically insignificant and focus on network performance and the end-user latency as a single metric of a CDN.
“You can’t improve what you can’t measure.”
After evaluating different options, I realised that there is a tool fitting our needs for retrieving scientific results and real-world measurements from many points across the globe. This tool can help us to identify which CDN performs best per economy or per region. Our quest for the fastest CDN outgrew the original idea and became a large piece of research. The final result was a lot of wildly coloured maps, including an interactive one that you can use to see the best performing CDN in your economy.
Using RIPE Atlas
RIPE Atlas is a global, open and distributed network of probes that actively measure Internet connectivity and reachability. It’s the largest Internet measurement infrastructure ever created! Seen in a historical context, people have used the electric telegraph since 1835 to broadcast the weather forecast. The first weather station started collecting weather data even before that, in 1781. In a connected and digital-first 21st century world, we still make use of hundreds of thousands of weather stations worldwide to quickly see the current weather conditions on our smartphones and decide on our clothing for the night out.
Such a connected world needs an Internet equivalent of weather stations, that could monitor the Internet itself. And so, that’s where the RIPE Atlas project fits in: it gives everyone the ability to measure the connectivity of any device connected to the Internet (by only having a publicly routable IP address) from different probes. RIPE Atlas gives everyone the ability to use more than 10,000 probes worldwide, thanks to the hundreds of volunteers hosting them.
It’s important to note that RIPE Atlas is a credit-based system: you can get uptime credits for having the probes online, and you can also get them whenever your probe delivers results for someone else’s measurement. To get started, you can get free credits at RIPE events, then you can also send and receive credits to and from other RIPE Atlas users.
Content Delivery Networks
The image below gives a high-level overview of how a geographically spread CDN’s Points of Presence (PoPs) help get content from servers closer to the end user (image courtesy of Cloudflare).
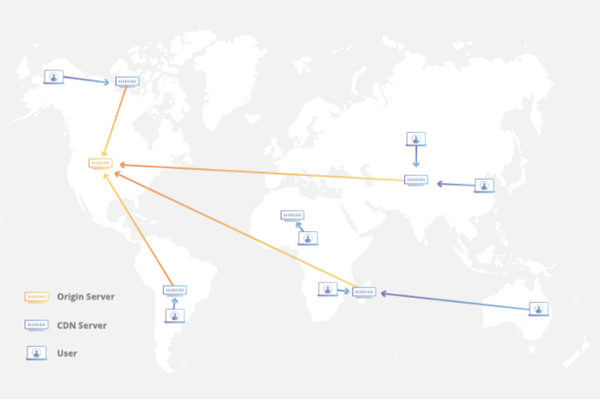
Figure 1 — High-level overview of a CDN.
I will not get into the topic of implementing a CDN or how they work ‘under the hood’. Instead, I will point out the benefits that they provide:
- The faster loading time of assets due to decreased latency: Assets (images, JavaScript, CSS files and so on) are fetched once from the origin server, then from that point on they are served from the server closest to the user. This benefit helps to optimize the end user experience, making our customers happy, and boosting our SEO rankings due to a faster page load time.
- Cutting traffic costs: Typically, by serving your static content from popular cloud storage services (that is, AWS S3 and Google Cloud Storage) to your users, you pay for the Internet traffic generated for each download/hit. A CDN helps as a man-in-the-middle: it will fetch the requested content only once from the origin server, store it, and then serve it from the cache. This is a lot cheaper and will result in less outgoing traffic.
- Caching: Using a CDN allows you to specify different dynamic caching policies and increase the cache hit rate. If the content is served from a CDN’s server cache, it does not have to fetch it from your origin server. Cache hit rates of static content requests can often reach 90% and more, which essentially means cutting 90% of traffic costs from your data centre.
- Ensuring readiness for traffic spikes in case of sudden traffic: CDNs have invested a lot of time and knowledge in developing large infrastructures that scale well, from being featured on Reddit and Hacker News to streaming live UEFA Champions League finals.
In the case of asset-heavy websites, the main objective is to serve assets to your customers in the fastest way possible. To ensure this, as well as the most efficient caching policy and using a reliable and well-spread CDN, use the correct Cache-Control headers with appropriate expirations for different content types; ignoring query strings to avoid cache busting, using the immutable flag, and so forth.
Who’s using CDNs?
Nowadays, the majority of Internet traffic is passing through Internet Exchange Points where traffic is exchanged for free, or for a very low fee. There, big content providers (think Netflix, Facebook, Google/YouTube) and ISPs connect and exchange traffic with the lowest latency and the highest throughput possible. By reading any blog on Medium.com, you have unknowingly accessed Cloudflare, one of the most popular CDNs. Or when you listened to your favourite song on Spotify, your device probably established a connection to Fastly’s servers.
Your favourite blogs and news portals are served using AWS Cloudfront, Google Cloud or other CDNs. Like the majority of Internet users, you have also generated some traffic to private CDNs by accessing Facebook, Instagram, Youtube, Netflix and so forth. You may think that only big companies use CDNs, but you would be mistaken. Nowadays, it’s unimaginable to start an online service without thinking about the best way to serve your traffic, so upfront planning to use a CDN makes a lot of sense.
Should you think about a CDN from day one? Absolutely! You want to optimize your costs upfront and achieve the best performance at the same time. To achieve this, you can rely on your gut feeling, a friend’s recommendation, a web search or you can use scientific, statistical data with real numbers. If you’re still interested, keep on reading. Here’s where the research starts!
Creating RIPE Atlas measurements
To create your very first measurement using RIPE Atlas, you can either use a web UI or a nice JSON API. Using the RIPE Atlas Web Wizard is simple — in a few clicks, you can create a measurement with the summary of all the associated costs. The probes available for use are hosted at various places: on a local router at home in residential areas, racks in workplaces and offices, and inside data centres. They can also be connected to mobile 4G connections or via a satellite uplink in a very remote location. As long as there’s an ethernet connection, the source of the connectivity doesn’t really matter. The coverage of IPv4 and IPv6 networks in total is pretty much the same: below 10% of worldwide Autonomous System Numbers (ASNs).
IPv4 ASNs covered: 3,602 (5.627%)
IPv6 ASNs covered: 1,446 (8.617%)
However, in the grand scheme of things, the major worldwide consumer ISPs and hosting companies have a sufficient number of probes hosted with them, and almost all of the world’s economies are connected — 182 (92.857%).
Research methodology
As noted above, using the web UI has its drawbacks in some scenarios. Particularly in my case, as I want to analyse all the economies in the world one by one, selecting the probes and then filtering them by different tags; it would be very cumbersome to repeat this process manually for 182 economies. Luckily, all of this can be done through a very simple REST API. First of all, we need a key ingredient to conduct this research: plenty of RIPE Atlas credits. Luckily, I have had a probe connected for more than five years in which it had collected almost 60 million credits, which was more than enough to conduct this research over a dozen times. I made some analysis for private use and also for investigations like this. Then, a list of CDN providers was defined, by analysing the current CDN market and favouring companies with a global presence, instead of a regional availability. Here is a breakdown of the CDNs chosen for this research (a total of 7):
Once the CDN providers list was defined, I decided to write a simple script using the Go programming language, due to its simple concurrency primitives. This small script (of fewer than 200 lines) goes through all the ISO2 (ISO 3166) codes of the economies, combines them with all the possible combinations of CDNs that were defined before, and sends a three-packet ping measurement API request to RIPE Atlas’ API.
Cloudflare has its own DNS resolver on 1.1.1.1. For Cloudfront and Google Cloud, I had to create my own distribution, but all the others were very easy to test with some of the well-known hostnames of the companies publicly using them (FIFA, and so forth).
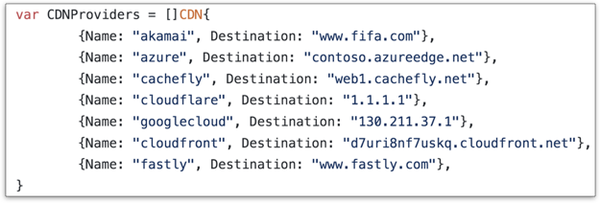
Figure 2 — Setting up measurements for a number of CDNs.
Using the request option, we would select up to 50 probes and use a couple of tags to filter out all the unavailable or unstable ones that would negatively influence our results set. The probe selection tags I used were system-IPv4-capable, system-IPv4-works and system-resolves-a-correctly to ensure that DNS resolution works correctly.
Parsing the measurements
Once we received an API response after creating a measurement, we saved the measurement ID to a results database, in the form of a CSV file. This database was used to store all the measurement IDs and their economy/CDN key pairs. We waited for some time before fetching the results of the measurement as sometimes they can take up to 15 minutes. Also, the API calls had to be periodically paused because of the throttling on the RIPE Atlas API side: up to 100 concurrent measurements and up to one million credits daily expenditure are allowed. Some requests failed. RIPE Atlas is still not distributed in all of the world’s economies, so these failed requests were expected and discarded, hence some of the grey areas on the results map. Here’s a screenshot of a single measurement result from the perspective of a web UI:
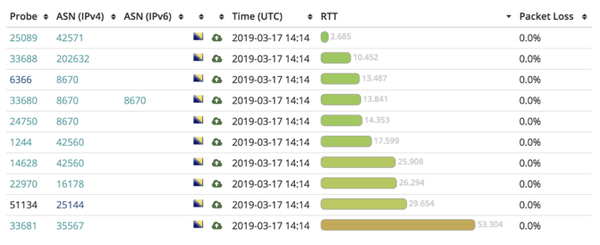
Figure 3 — Single measurement result from the perspective of a web UI.
We can see all the probes involved, their related ASNs, packet loss in percentage, and a round-trip time from a probe to a target host (our metric of interest). Of course, consuming these results through an API made more sense, and that’s what we’ll focus on (see below).
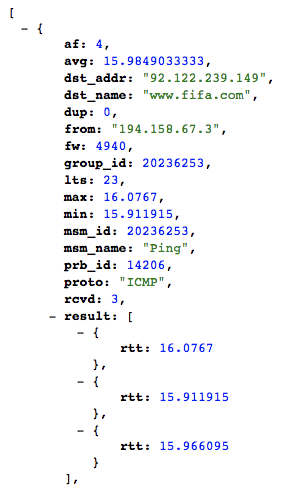
Figure 4 — Results in the API.
All the results were separated into a separate directory for each CDN, and within those directories, a file per economy was created.
The results set is available in a GitHub repository. After collecting and storing all the measurements from the RIPE Atlas API, I ended up with a combination in the following format:
iso2_code,cdn_name,rtt_ms
Overall, the entire research consumed around 50,000 credits.
Results
In the pie chart below you can see that Cloudflare is the fastest in most economies, followed by Google Cloud, Akamai and Azure.

Figure 5 — Results for all measured CDNs.
On a world map, the situation is very colourful. The map shows the fastest CDN in each economy.
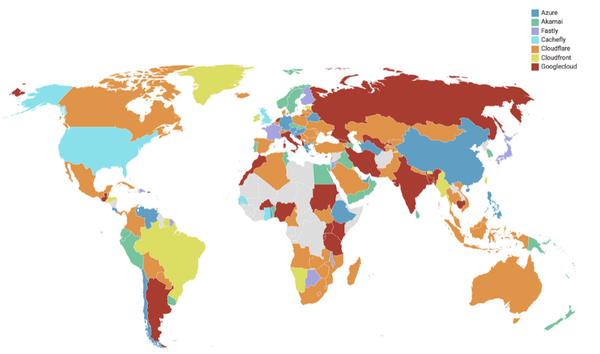
Figure 6 — Map showing the fastest CDN in each economy.
On the next map we can see the average latency of all CDNs in each economy. On average we can see that European customers take less than 50ms response time to each CDN.
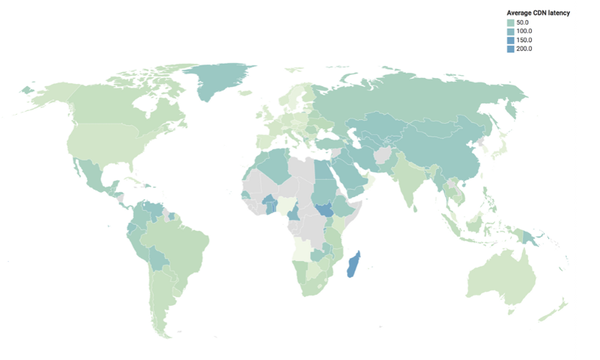
Figure 7 — Average CDN latency.
The average latency of a ping round-trip is mostly under 50ms per economy. In Europe, this is usually around 10ms as you can see on the following map.
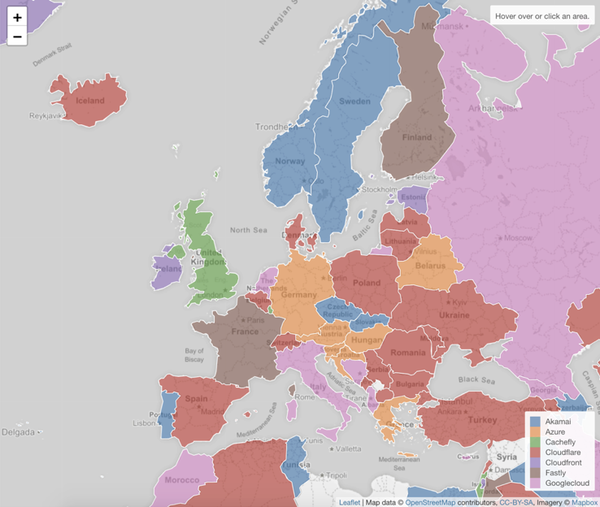
Figure 8 — Best performing CDNs in Europe.
The graph below shows the average latency per CDN worldwide.
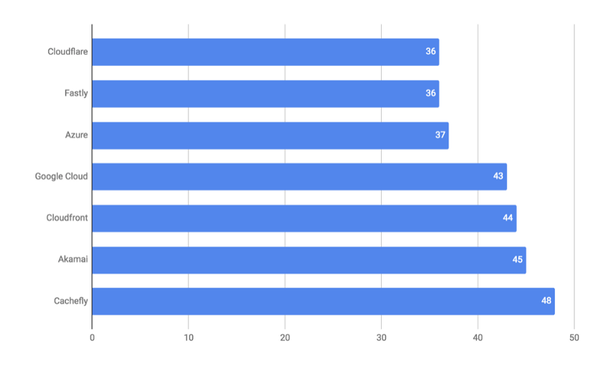
Figure 9 — Average latency per CDN worldwide.
Some remarks: 36 milliseconds was not the average. If we ran the research a few more times, it would always yield different results, since the 50 probes included in each measurement were assigned randomly. This randomness can yield biased results in economies that have a large number of probes (500 or more). Also, please keep in mind that not all the ASNs in every economy have a RIPE Atlas probe installed. Therefore, results can sometimes be artificially boosted because the results in one economy consist of probes belonging to the same ASN.
These results have a good connection with low latency to the target host. So, if an economy has only two probes and both of them are performing badly to any hostname (with an initial ping of 100+ ms to anywhere), then the results would be worsened. Again, a solution to this is to diversify probes in each economy and cover as many ASNs with at least one probe if possible. An interactive map is available here.
Conclusion
Cloudflare has the best geographical spread, and it’s clear that it is constantly adding new PoPs, with currently over 180 PoPs. Akamai used to have the reputation as the best (but most expensive) CDN for a very long time, almost exclusively used by very big companies. They have different types of agreements with ISPs through private peering, as well as connections at several IXPs. In the MENA region, they’re doing a really good job in my opinion and so far, as I mentioned in the introduction, the performance is satisfying. When taking into consideration the sheer size of Google’s network, keep in mind that with Google Cloud, you can opt for different network tiers. Choosing a Premium over a Standard network tier costs more but can give you better performance and reliability because the traffic will be routed differently.
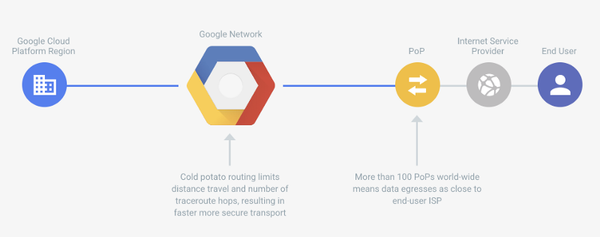
Figure 10 — Illustration of the way Google routes its traffic.
When using Google Cloud’s Premium network tier, the traffic should flow through Google’s internal, higher quality network.
Azure is also a bit unique and can yield different results depending on the network choice. When creating a CDN distribution on Azure, you can choose between a Verizon, Akamai and Microsoft CDN, which are running on three different networks. If you want to use Akamai, using it through Azure might be the easiest way to do so; otherwise, you would have to reach out to Akamai sales and have a rather high volume of traffic.
After concluding the results of this research, I tried to see if there are any active and maintained tools to do a near-real-time analysis of CDNs.
Some of them proved to be useful. For example, CloudHarmony uses the RIPE Atlas probes as well and offers a nice web UI with filters and graphs. On the other hand, CDNPerf utilizes proprietary data to do RUM analysis. I always prefer open-source and public data if possible.
This entire research wouldn’t be possible without the RIPE Atlas project. If you would like to participate, you can apply for hosting a physical probe here. In any case, it’s clear that picking a CDN has never been easier, and that it has never been backed by more data.
This blog post originally appeared on RIPE Labs, and is based on a presentation given at the SEE 8 meeting held in April 2019 (slides and video).
Emir Beganović is a long-time open source contributor, founder of the Bosnia and Herzegovina IXP initiative, and software developer specializing in high-traffic enterprise applications and websites, with more than a decade of professional experience.
The views expressed by the authors of this blog are their own and do not necessarily reflect the views of APNIC. Please note a Code of Conduct applies to this blog.