

APNIC Sub-regional Resource Updates are periodic blogs on resource delegation trends in a specific APNIC sub-region, featuring interactive data from the APNIC Internet Directory.
East Asia is a sub-region with a population of over 1.6 billion people, reaching as far east as Japan, with China covering the area’s most northern and western points. The sub-region also encompasses North and South Korea, as well as Mongolia, Macao, Hong Kong and Taiwan.
East Asia is also partially serviced by a number of National Internet Registries (NIRs) and the charts in this report include delegations to those NIRs.
ASNs
The East Asia sub-region includes some economies that adopted the Internet early and at scale, such as Japan, South Korea and Hong Kong. While these economies continue to require ASNs at a healthy rate, the graphs for more recent years also feature China just as prominently.
If we look at ASN delegation for the year to date, we see that China, Hong Kong and Japan have been consistent. It is important to note that the May 2019 data includes a delegation of 100 ASNs to CNNIC, and so doesn’t necessarily represent members of either APNIC or CNNIC immediately receiving an ASN.
Peering
Looking at the number of visible BGP adjacencies per ASN, South Korea has 1.39 adjacencies per ASN (738 peers and 1029 visible adjacencies), the highest number in the sub-region, indicating that a significant number of Autonomous Systems are multihomed. The VizAS graph also appears to show that the Internet routing landscape in South Korea is centered around two major ASNs.
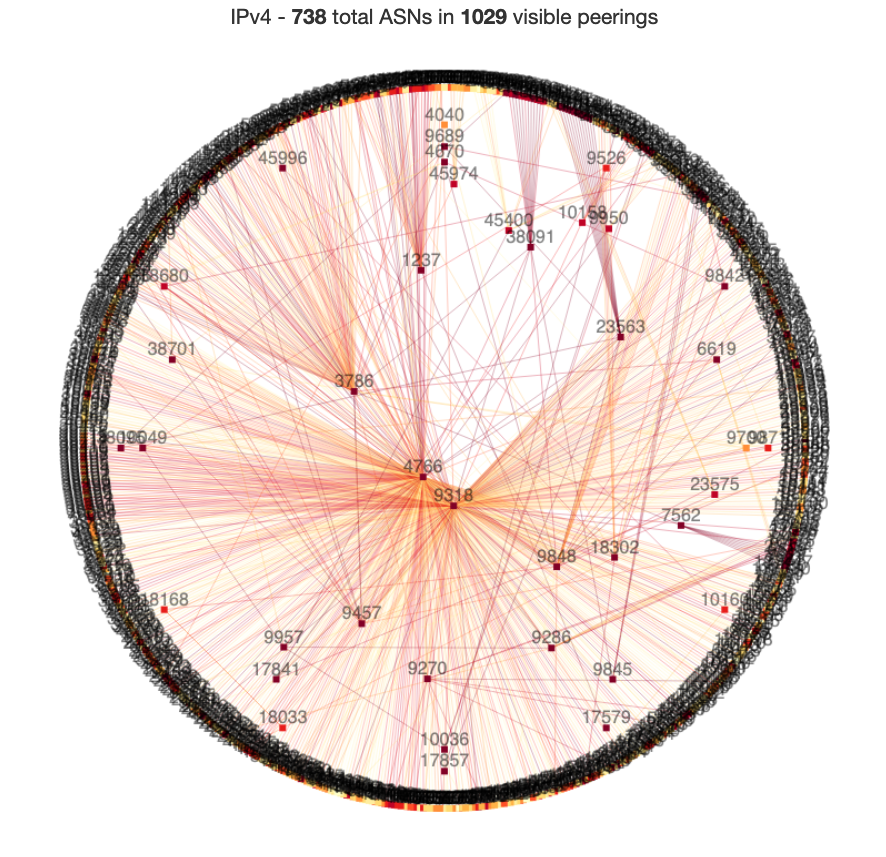
Figure 1 — VizAS graph for South Korea.
IPv4
There are almost 637 million IPv4 addresses delegated to the East Asia region, meaning that there is about 1 IPv4 address for every 2.6 people. This ratio is positively luxurious when compared with some other sub-regions (South Asia is 1:37), and may be a result of the early adopting economies acquiring IPv4 space in the ‘first come, first served’ era, before address depletion reached critical levels, leading to changes in delegation policy.
It’s hard to ignore the uptick in delegations to China from 2011 onwards, which reflects the overall economic growth in the economy at the time. The delegations view can be deceiving though — if you select the ‘IP Address’ or ‘/24’ view options on the graph below, you can easily see when IANA assigned APNIC its final /8 in 2011 and the maximum delegation size was changed to a /22. In 2019, the maximum delegation size was reduced even further to a /23 as a result of prop-127.
IPv6
Most economies in East Asia have received a significant number of IPv6 delegations. China’s 54.5% share of that pie amounts to almost 3.1 billion IPv6 /48s, which is almost 70% of all IPv6 in the sub-region. Japan holds almost 795 million /48s.
The past year has seen the number of IPv6 delegations in China increase significantly, not in the least due to some large delegations last December. These delegations can be seen in the graph below by clicking on either the /32 or /48 button.
Unsurprisingly, the rate of IPv6 acquisition and deployment in China has also been on the rise, encouraged by a government-issued action plan for the large-scale deployment of IPv6. As Yuedong Zhang reported earlier this year, the plan’s ultimate aim is to have all networks running IPv6 by 2025.
China’s IPv6 capability grew from 0.52% in September 2018 to 12.76% by the end of June 2019.
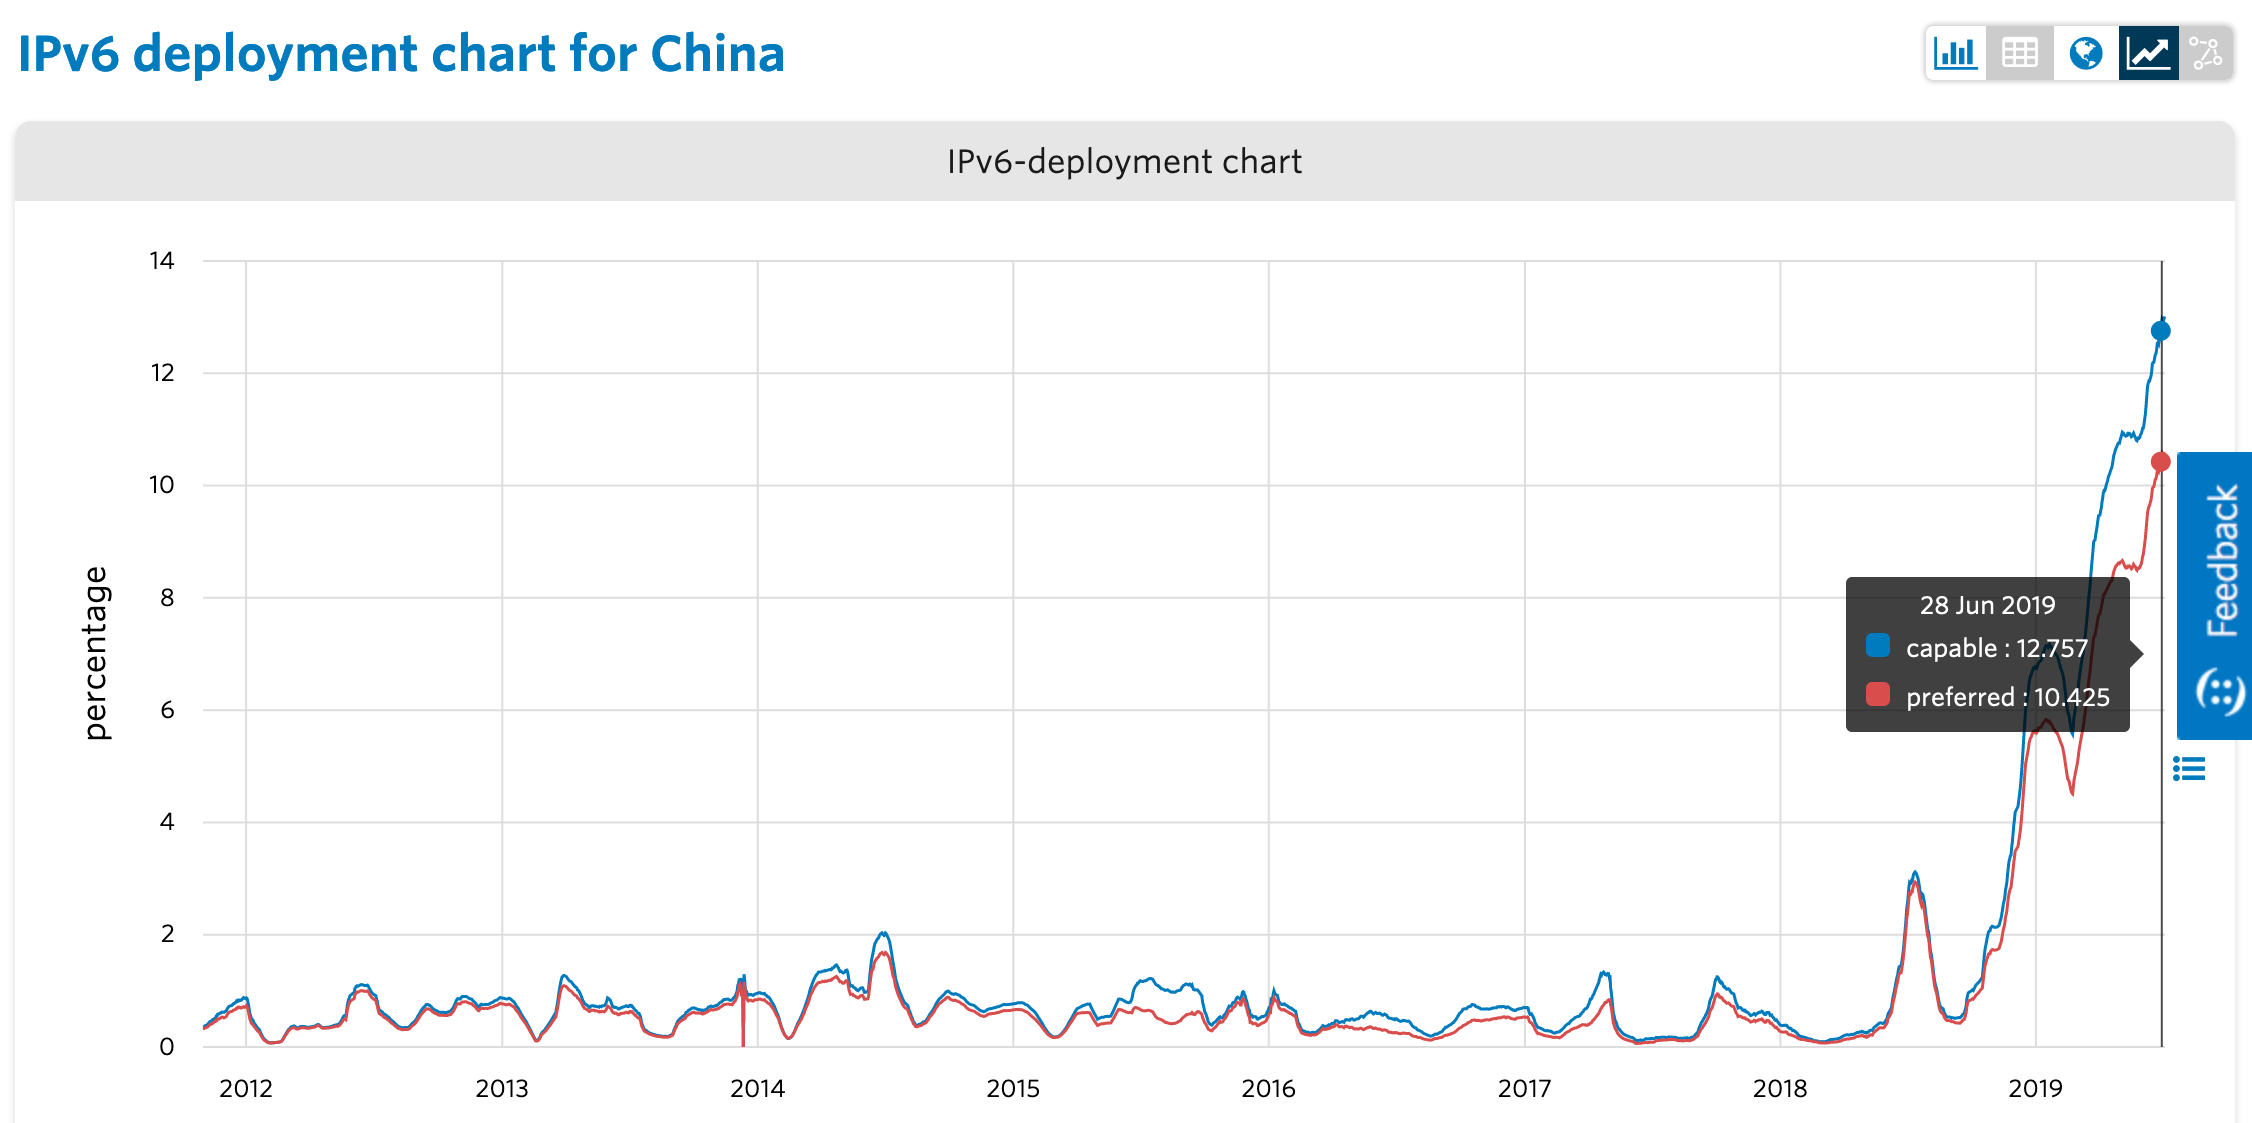
Figure 2 — IPv6 deployment chart for China.
The sub-region as a whole is around 15% IPv6-capable, and Macao, China and South Korea all hover around this mark. The economies with the strongest overall IPv6 deployment numbers to date are Taiwan at 34.12% IPv6-capable and Japan at 33.64%.
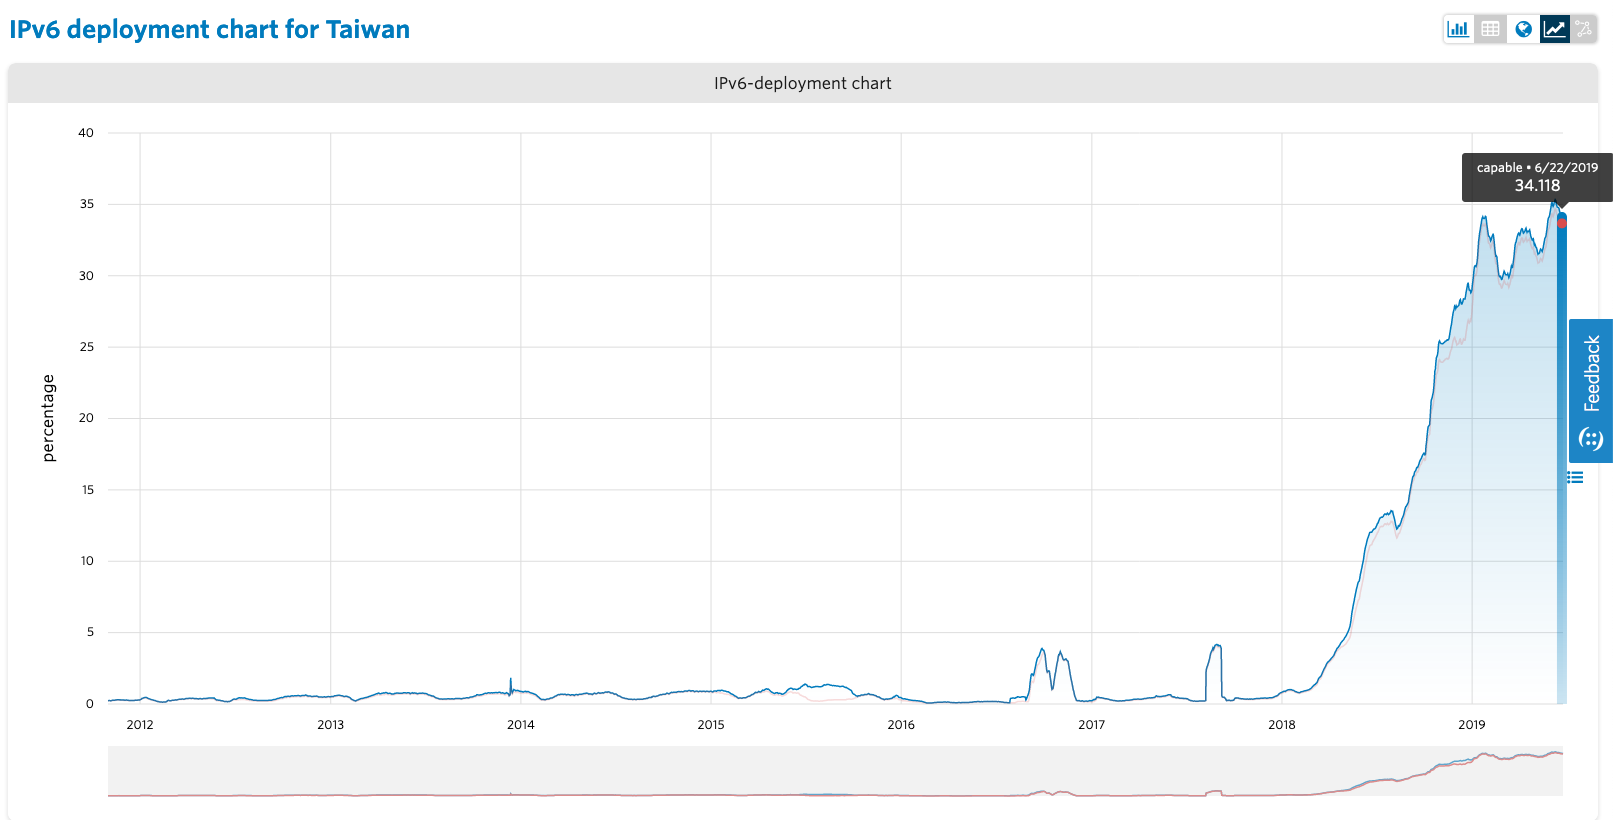
Figure 3 — IPv6 deployment chart for Taiwan.
The embedded charts in this report are sourced from the APNIC Internet Directory, which, in addition to IPv4, IPv6 and ASN delegation statistics, will soon include the IPv6 deployment charts featured in the images above.
The views expressed by the authors of this blog are their own and do not necessarily reflect the views of APNIC. Please note a Code of Conduct applies to this blog.