

Although some people think of the DNS as ‘just’ the Internet’s phone book, it’s actually a very complex system, specified by hundreds of RFC documents. Moreover, the Internet critically depends on its integrity and resilience, as recent attacks have shown. This begs the question: Is today’s DNS distributed, fast and secure enough for its purpose?
We investigated this question, based on our new DNS Observatory framework, presenting our outcomes at IETF104 (March 2019) during the MAPRG session.
Key points:
- Using the DNS Observatory, we processed over 1 trillion DNS transactions from January to March 2019, seeing over 2.5 million unique Fully Qualified Domain Names (FQDNs) per minute, on average.
- Approximately 60% of the DNS transactions captured in our list were handled by just 1,000 name servers; the majority of queries flowed into ASes operated by less than 10 organizations.
- For some popular FQDNs, up to 90% of all DNS transactions are NODATA responses to AAAA queries.
- DNSSEC adoption is poor, although many name server IP addresses are already in IP prefixes secured with RPKI.
Tracking the DNS stars
DNS Observatory is a new research project backed by Farsight Security that provides a telescope for global DNS traffic. Compared with similar platforms, we leverage a large stream of passive observations (DNS traffic) from real-world recursive resolvers to authoritative name servers. From January to March 2019, we processed over 1 trillion DNS transactions, seeing over 2.5 million unique FQDNs per minute, on average. Our data is jointly contributed by many parties who run their own resolvers around the globe, including large ISPs, recursive DNS providers, and universities.
We aggregated incoming data in 60 second time steps. Each minute, we produced a list of the Top n most popular authoritative name servers (or other DNS entities, for example FQDNs). We ranked them by query count and characterized using over 30 traffic features. Examples for such characteristics are the number of successful and NXDOMAIN responses, the number of queried FQDNs and returned IP addresses, and the median response delay and packet size.
Subsequently, we aggregated the minute-by-minute files into larger time windows, eventually producing daily and monthly snapshots of the DNS.
The big picture
Using this vast data set we studied the Internet’s top 10,000 name servers — that is, the most popular IP addresses of authoritative name servers seen in DNS transactions. Note that due to IP anycast, a single address may represent multiple machines.

Figure 1 — Traffic distribution for the top 10,000 name servers (curves not to scale).
In Figure 1, we see that approximately 60% of the DNS transactions captured in our list were handled by just one thousand name servers, which demonstrates a high concentration of DNS traffic on a relatively small part of the IP addressing space. From a BGP point of view, the majority of queries flowed into ASes operated by less than 10 organizations.
Moreover, we see that the really popular name servers — such as the root and TLD name servers — are more likely to be queried for random or otherwise erroneous names, which leads to an NXDOMAIN response. For instance, we found some non-existing TLDs, such as ‘.local’, being more popular than existing TLDs, such as the Italian ccTLD ‘.it’.
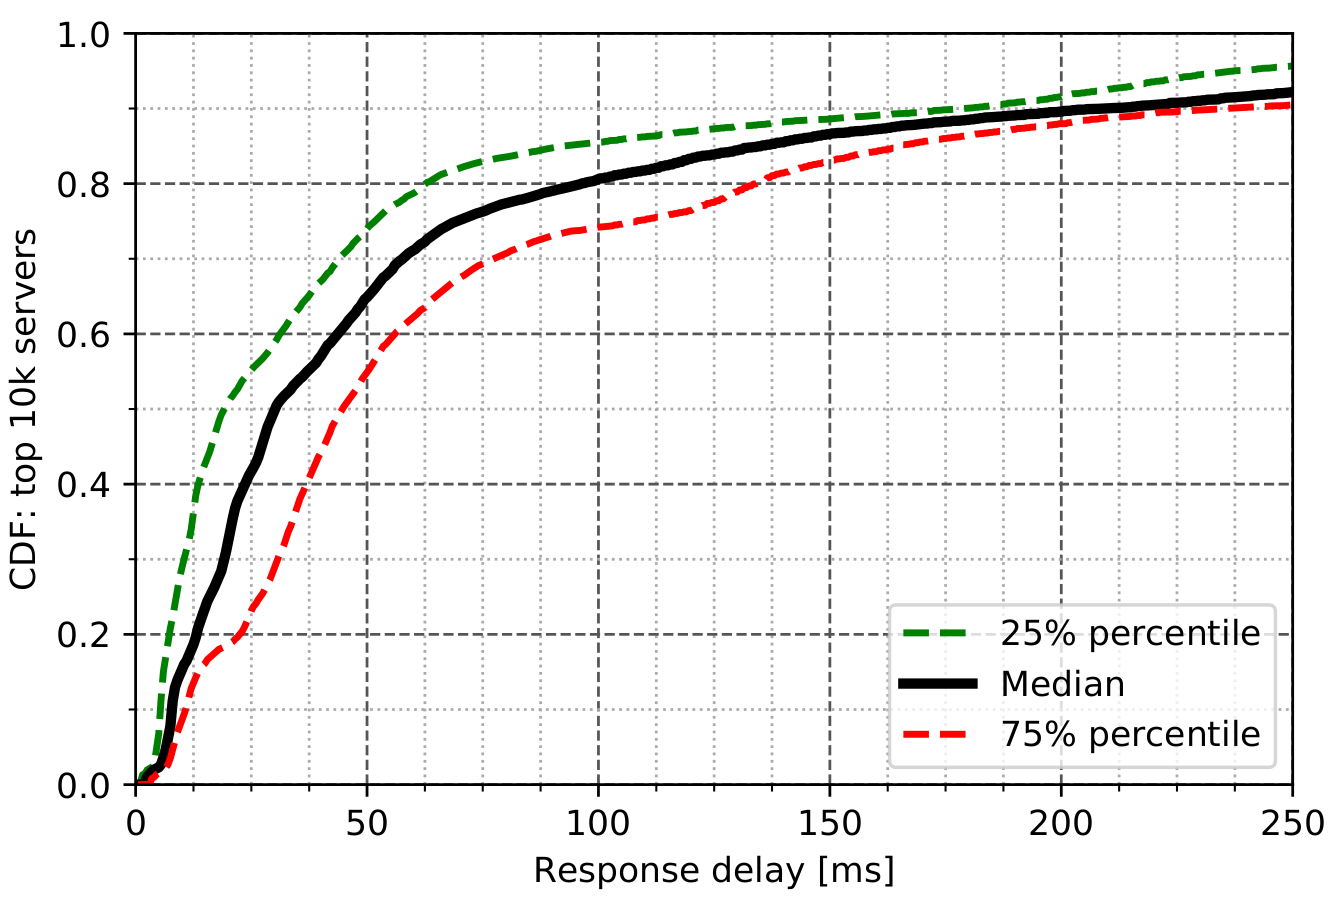
Figure 2 — Response delays for the top 10,000 name servers.
We also investigated DNS performance, where in Figure 2 we show the nameserver response delay. While most nameservers respond in less than 30ms, still one in five needs more than 100ms. This suggests there is much space for improvement by replicating zones closer to the resolvers.
Happy Eyeballs, sad DNS?
The Happy Eyeballs algorithm makes dual-stack hosts send both A and AAAA queries before establishing a connection. The DNS negative caching mechanism, controlled via the zone’s SOA record, should cause the resolver to cache the absence of an IPv6 address for a particular domain. If the negative caching TTL is much lower than the regular A record TTL, resolvers will query the authoritative name server much more often than needed.
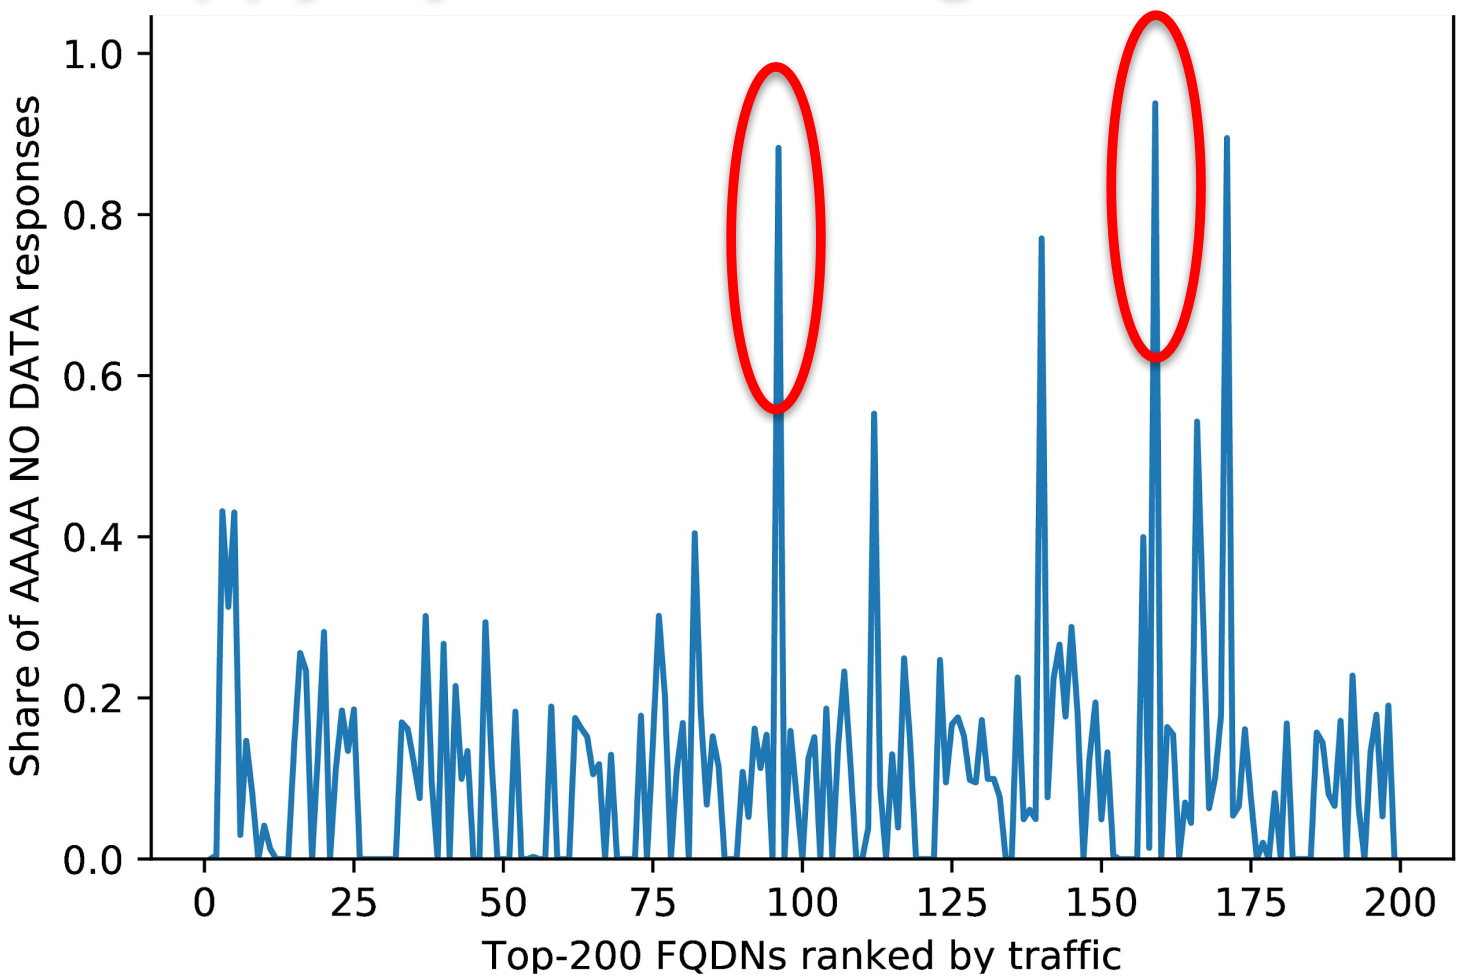
Figure 3 — Ratio of empty AAAA responses for the top 200 FQDNs.
We found popular domains with an order of magnitude shorter negative TTLs than regular A record TTLs. For instance, in Figure 3, we highlight two FQDNs used by the time service of a popular operating system, where the A record TTL was set to 15 minutes, but the zone’s negative TTL was set to 15 seconds. The net effect is that 90% of all transactions for this FQDN are NODATA responses to AAAA queries, which degrades performance.
DNSSEC and RPKI
Finally, a quick look into DNS security. In Figure 4, we show DNSSEC and RPKI support, both of which can make DNS hijacking attacks much more difficult. Each dot on the plot represents the average of a group of 100 name servers.
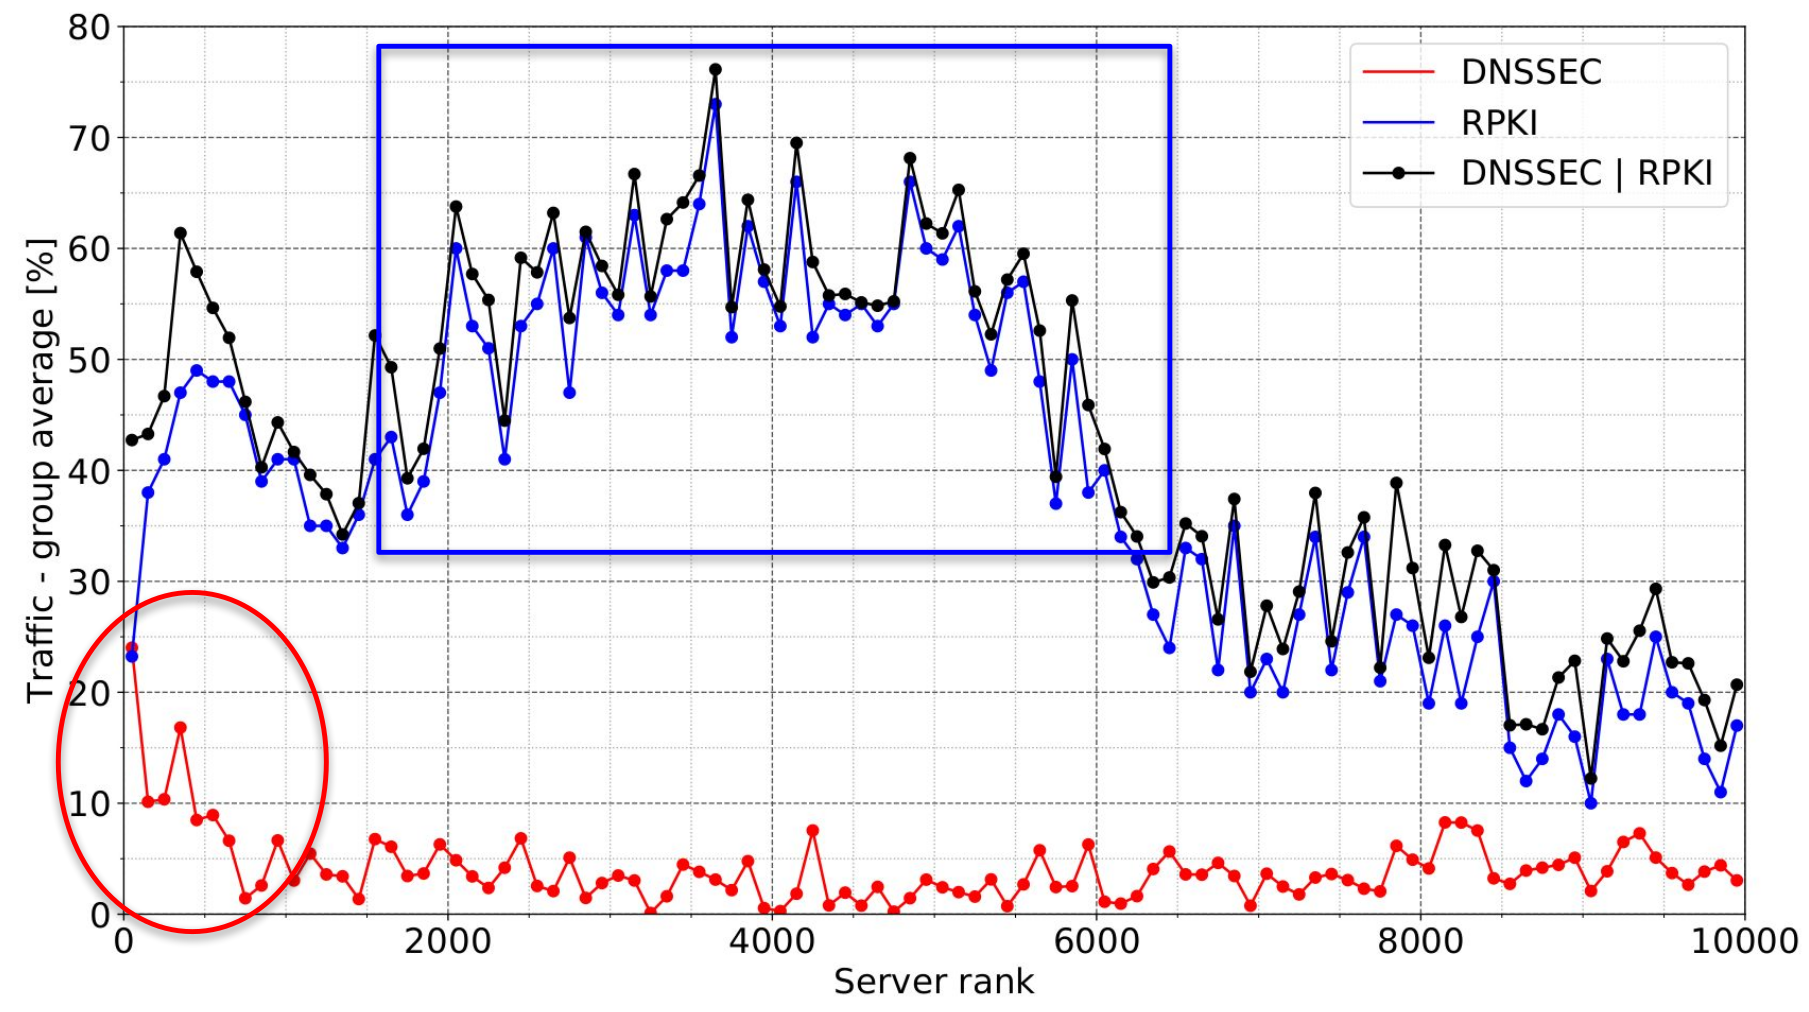
Figure 4 — DNSSEC and RPKI support for the top 10,000 name servers.
The top 1,000 name servers are more likely to send DNSSEC-signed traffic, although the rate of DNSSEC adoption is still poor. We were surprised to see many name server IP addresses already in prefixes with ROAs, but note this doesn’t automatically mean the resolver side will make use of the RPKI as well.
Make your own observations
The DNS Observatory aggregates billions of DNS transactions per day and gives researchers and operators a bird’s-eye view of the DNS. We have shown illustrative performance and security analysis. If you have interesting ideas you want to explore using the DNS Observatory feel free to contact us.
Contributor: Oliver Gasser.
Pawel Foremski is a Scientist / Senior Engineer at Farsight Security, Inc.
The views expressed by the authors of this blog are their own and do not necessarily reflect the views of APNIC. Please note a Code of Conduct applies to this blog.