
It’s been five years since Google launched QUIC — a new transport protocol that is deployed on the shoulders of UDP in user space.
QUIC offers similar properties as TCP + TLS 1.3 but promises to incorporate new features more easily and without them being dropped by legacy systems that don’t support them, for example, middleboxes that block new TCP features — a problem that TCP has faced since its initial deployment. QUIC tackles the problem by offering a fully encrypted transport protocol, thereby removing the possibility for middleboxes to alter its content. Some say this challenges the operability of networks as traditional measures that rely on unencrypted headers cannot be applied anymore.
Watch the IETF QUIC’s WG chair Lars Eggert lecture at our university last year to learn more about QUIC.
Google’s implementation is open-source and, over time, has spawned other independent implementations. In our paper, A First Look at QUIC in the Wild, — published at the Passive and Active Measurement (PAM) Conference 2018 — we monitored and analyzed the growth of QUIC in three different networks: a publicly available university uplink (MAWI Samplepoint-F); a major European Tier-1 network, including its mobile network; and a major European IXP.
Below is a brief summary of our findings, which are continually updated and freely available on our project website.
QUIC in IPv4
We have been monitoring the whole IPv4 space since August 2016. We regularly investigate QUIC support in various zone files such as the .com / .net / .org zones.
First, we investigated the QUIC-capable infrastructure in IPv4 on its common UDP port 443, from which we built a ZMap module to rapidly enumerate QUIC hosts. We exercised QUIC’s version negotiation feature within our module, which yields QUIC support as well as the supported QUIC versions.
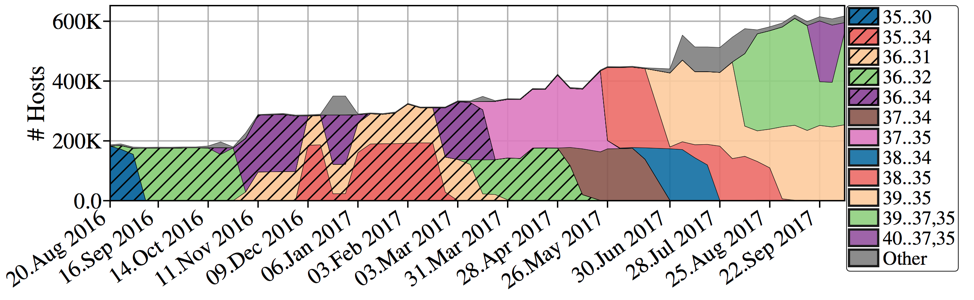
Figure 1: The number of QUIC-capable IPs and support for sets of certain QUIC versions. Here we display versions when there was support by at least 20,000 hosts. Versions that first appeared in 2016 are hatched.
Figure 1 shows the growth in QUIC support until September 2017 — the number of IPs tripled in this time, and we can observe a very vibrant version space. Many new versions appeared and others faded away.
On closer inspection, we also see versions like Version 35 to be supported over the whole course of our observations. Google operates 53% of these hosts and we found Akamai to operate roughly 40%.
However, things have changed since September last year. One week before Akamai officially announced its QUIC rollout, we noticed a drastic increase in QUIC support in IPv4:
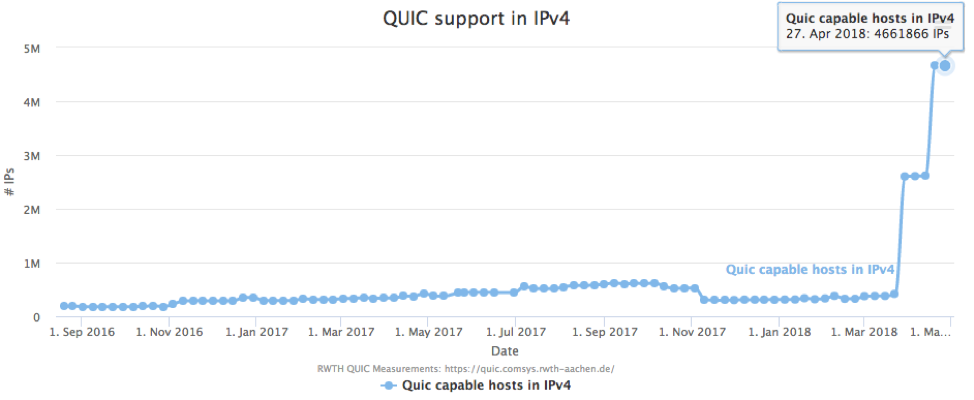
Figure 2: Akamai has stepped up their QUIC support since March 2018. We now observed more than 4.6M IPs supporting QUIC, most hosted by Akamai.
See our paper and website for more information about the state of these infrastructures and the extent existing domains already use QUIC.
QUIC traffic shares
Given there is already some QUIC infrastructure out there, which is mostly operated by two large content providers, how much Internet traffic is already using QUIC?
European Tier-1 network
Let’s first look at how we saw things back in August 2017 when we investigated QUIC in a major European Tier-1 ISP.
We analyzed anonymized netflows (IPs have been replaced by ASNs) from all border routers of that ISP for the duration of one day:
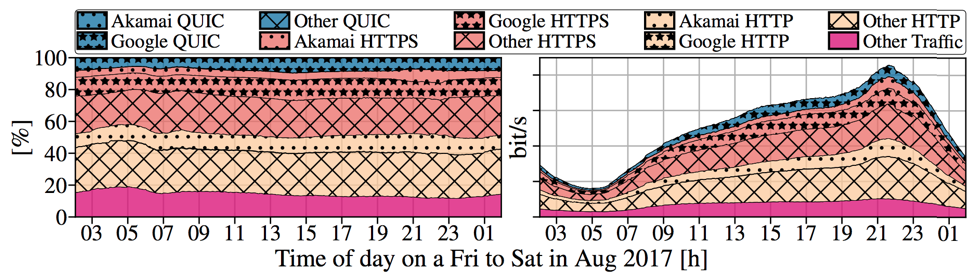
Figure 3: Relative QUIC shares (left) and absolute traffic (right) in a major European Tier-1 network. QUIC shares (blue) in contrast to HTTP (yellow) and HTTPS (red). Note: the ISP requested the actual traffic volume not be disclosed.
QUIC accounts for up to 7.8% of the total traffic volume, of which 98% is contributed by Google. Furthermore, QUIC follows the same pattern as the other traffic over the course of the day.
The Tier-1 also operates a mobile network, the results of which are included in the above plot. When we exclusively analyze the mobile share we see the following:
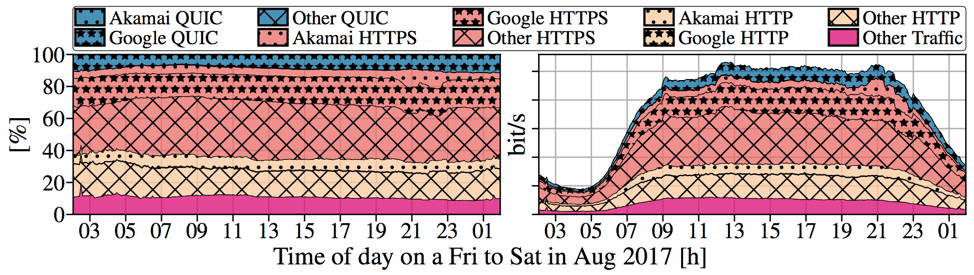
Figure 4: Relative QUIC shares (left) and absolute traffic (right) in the mobile network of a major European Tier-1 network. QUIC shares (blue) in contrast to HTTP (yellow) and HTTPS (red). Note: the ISP requested the actual traffic volume not be disclosed.
Most visually different is probably the absolute traffic distribution showing constant network use over the day. We again observed Google dominating QUIC traffic shares — it pushed ~34% of its own traffic via QUIC to mobile end-users (we observed slightly higher peak QUIC shares of 9.1% on that day).
QUIC traffic shares do not (yet) reflect server support. While Akamai operates a comparably large infrastructure in the number of QUIC-capable IPs, QUIC traffic is (still) almost entirely served by Google. That said, Akamai’s recent efforts (as above) means that this is likely to change.
European IXP
We continue by looking at a major European IXP with data from the same day in August 2017.
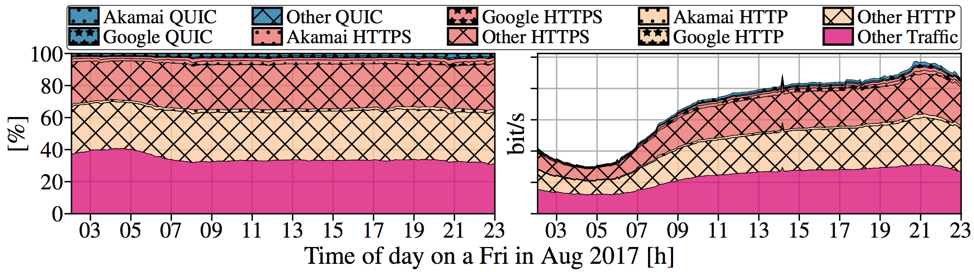
Figure 5: Relative QUIC shares (left) and absolute traffic volume (right) at a major European IXP. Note: the IXP requested the actual traffic volume not be disclosed.
The IXP presents a slightly different picture to the ISP: the overall QUIC share is, on average, only around 2.6%. While only barely visible from the plot, Akamai dominates the QUIC traffic with nearly 60%. (Per-CDN) traffic shares largely depend on the chosen vantage point.
We believe that different traffic engineering strategies cause these differences but we have no data to support this.
University uplink
Thanks to the people at WIDE, we can analyze full 15-minute pcap header traces each day of actual Internet traffic enabling us to also view into the past and continue monitoring the QUIC evolution.
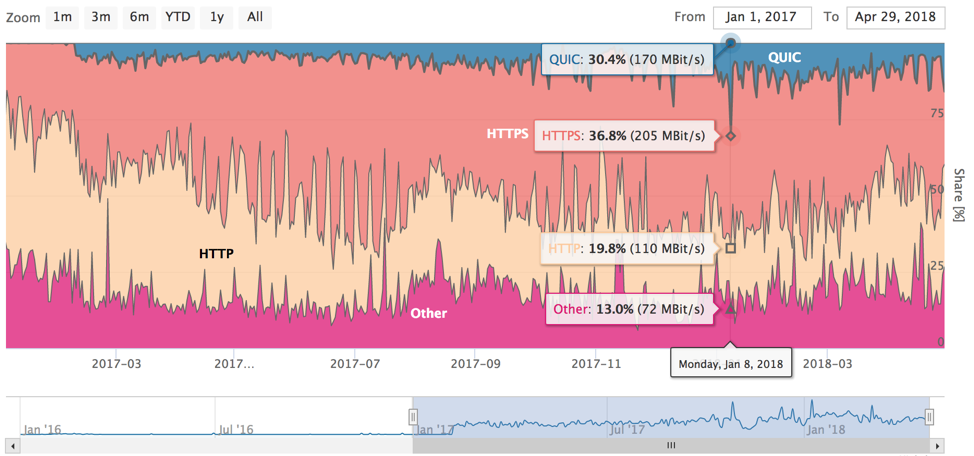
Figure 6: QUIC (blue), HTTPS (red), HTTP (yellow) and other (purple) traffic at samplepoint-F of the MAWI trace from January 2017 to the end of April 2018. An interactive version of this plot is available at: https://quic.netray.io.
Figure 6 shows how QUIC traffic has evolved since January 2017. There was close to no QUIC at the start of last year with the first significant amount of traffic (5.2%) observed in March 2017. In September 2017 (to enable comparison to the other plots), we saw slightly less traffic compared to the ISP network of roughly 6.7%. When we look beyond this, we can see that the QUIC portion of the plot continued to rise — in fact, we find peaks of up to 30%.
Follow the growth of QUIC
Even though the IETF QUIC is not yet fully standardized (due November 2018) our work shows that Google QUIC — which will gradually transition to the IETF QUIC — is already a network reality that is currently dominated by a few big players.
We believe that once QUIC is standardized, its use will grow even further; something we will continue to monitor via IPv4 and the MAWI trace and make publicly available.
Jan Rüth is a PhD student at the Chair for Communication and Distributed Systems at RWTH Aachen University in Germany.
The views expressed by the authors of this blog are their own and do not necessarily reflect the views of APNIC. Please note a Code of Conduct applies to this blog.
Good the see increasing number of IPv4 nodes supporting QUIC. Any similar graph but for IPv6 nodes?