

International routing detours are paths that originate in an Autonomous System (AS) located in one country, traverse an AS located in a different country and return to an AS in the original country.
In November 2013, the Internet intelligence company Renesys (now owned by Dyn, Oracle) published an online article detailing an attack they called Targeted Internet Traffic Misdirection. Using Traceroute data, they discovered three paths that suffered a man-in-the-middle (MITM) attack. One path originated from, and was destined to, organizations in Denver, CO, after passing through Iceland, prompting concern and uncomfortable discussions with ISP customers.
Are such detours only a result of an attack?
Previous studies have considered this problem space using data plane measurements with specific geographic focus. For example, cities located in the African continent commonly communicate via an external exchange point in Europe as shown by Gupta et al. in Peering at the Internet’s Frontier: A First Look at ISP Interconnectivity in Africa [PDF 2.8MB].
The goal of Gupta’s work, however, was to investigate large latencies in Africa and ways to reduce them. The premise was that if a route crosses international boundaries it would exhibit high latency. The work pointed to cases where local ISPs are not present at regional IXPs and IXP participants don’t peer with each other. Similar to Renesys, Gupta’s work also used traceroute measurements, this time from the BISmark infrastructure (a deployment of home routers with custom firmware) in South Africa.
In Internet Surveillance and Boomerang Routing: A Call for Canadian Network Sovereignty, Obar et al., also used traceroute to identify routes from Canada to Canada that detour through the US, but their motivation was based on concerns about potential surveillance by the NSA.
While these studies highlight an important issue in current Internet routing, our research team (myself and Christos Papadopoulos from Colorado State University, and Romain Fontugne from IIJ) aimed to answer a much broader question: Can we detect detours in near-real time using current public measurement infrastructure? Moreover, we aim to present characterization such as who causes most detours and which countries get affected most.
Characterizing detours is important to several players, including:
- Network engineers to diagnose problems
- Policy makers aiming at adhering to potential national communication policies mandating that all intra-country communication be confined within national boundaries
- Entrepreneurs looking for opportunities to deploy new infrastructure in sparsely covered geographical areas such as Africa
- Privacy-conscious states trying to minimize the amount of internal communication traversing different jurisdictions.
Below are the findings and insights from our recently published work, “Towards Characterizing International Routing Detours”, which we presented at the Asian Internet Engineering Conference (AINTEC 2016).
Detecting detours
There are multiple ways to detect detours.
A common approach followed by many is to run data plane measurements (traceroutes) between two vantage points whose locations are known. By geolocating each IP in the traceroute you can check if the path crossed international boundaries. RIPE NCC follows this approach for detecting similar problems.
Data plane-based methods are limiting in some sense. You can only detect detours in networks where you have a vantage point. Also, a live-tool continuously generating traffic to detect detours may not be a solution that every network operator would prefer. Therefore, we chose to look at the problem from a control plane point of view. Currently, there are more than 400+ BGP peers all over the world that feed their RIBs to RouteViews or RIPE RIS. Each RIB provides its view of the global prefix table.
To detect detours using control plane we propose to geolocate each AS in the AS path of the prefix entry and detect paths that start and end in the same country but visit at least one AS in between that does not have a presence in the origin country.
AS Geolocation
To map an AS path to country level path our first challenge is to geolocate ASs.
Geolocation of an AS is loosely defined. For the work of inferring possible country level paths, we want to create a set of all the countries an AS can have a presence in. We identified three possible cases an AS can have a presence in a country (C):
- It announces a prefix that geolocates to C
- It has infrastructure (physical routers/switches) in C
- It participates at an IXP in C
We geolocated all the prefixes announced by each AS in the global routing table; fetched IXP mappings from peeringDB, PCH and by crawling 300+ IXP websites; and geolocated infrastructure IPs that may not have appeared in BGP but appeared in CAIDA’s Ark traceroutes. The distribution of AS geolocation is shown in Figure 1.
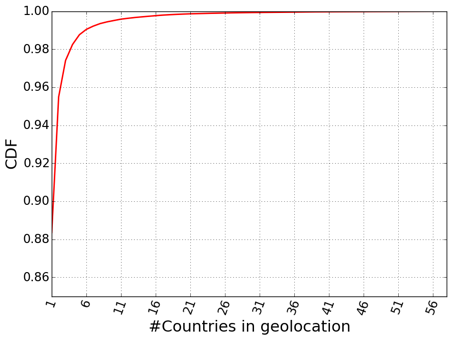
Figure 1: Distribution of AS geolocation
Perhaps surprisingly, only about 11.6% ASs out of a total of 52,984 geolocated to multiple countries. We believe that this is the result of a practice where most organizations use a different AS number in different countries. If an AS does geolocate to multiple countries, we used the set of all countries in our analysis.
Although our end goal is to detect detours, these geolocation results provided interesting insights.
To understand more about which ASs geolocate to more than one country, we used CAIDA’s AS Rank. This dataset gives higher ranks to ASs that have large customer cones. Intuitively, ASs with higher rank should resolve to many countries due to their wider presence.
The following table shows ASs with their CAIDA AS rank and corresponding number of countries the AS geolocated to for the top three and bottom three in the first 1,000 ranked ASs.
| AS Rank | ASN | Customer Cone Size | AS Name | No. Countries |
| 1 | 3356 | 24,553 | Level 3 Communications | 63 |
| 2 | 174 | 17,891 | Cogent Communications | 58 |
| 3 | 3257 | 16,963 | Tinet Spa | 34 |
| 998 | 25394 | 18 | MK Netzdienste GmbH | 2 |
| 999 | 6724 | 18 | Strato AG Ascenty DataCenters | 4 |
| 1000 | 52925 | 18 | Locacao e Services LTDA | 2 |
As expected, we saw that ASs which have a large presence with many customers across the world geolocate to a large number of countries, and low-rank ASs with smaller customer cones geolocate to fewer countries.
Finally, to detect detours we fetched a RIB dump from RouteViews/RIS for each peer and prefix, and mapped the AS path to country level path. We removed the cases where there was a possible peering relationship. Using CAIDA’s AS relationship dataset we removed cases where a detour may not actually occur due to peering relation between detour origin AS and detour return AS. More details on this can be found in our paper.
Also, be sure to check out a tool we developed, Netra, which can be used to monitor the Internet routing system in near real-time and produce alerts. We make the datasets for AS geolocation and detour analysis publicly available with a REST API.
How we validated our measurements
We validated our control plane based methodology by running data plane measurements. To do this, we used RIPE Atlas probes. Every time a detour is detected in control plane, if there was an Atlas probe available in the AS involved in the detour, we launched a traceroute from the probe to the detoured prefix.
We performed two tests on the traceroute. First, geolocate IP hops and verify if the path left the country. Second, look for a magnitude of jump in the RTT. The intuition here is that if the path did cross international boundaries, RTT would increase.
During our 12-hour run on 2 May 2016, we observed the following validation results:
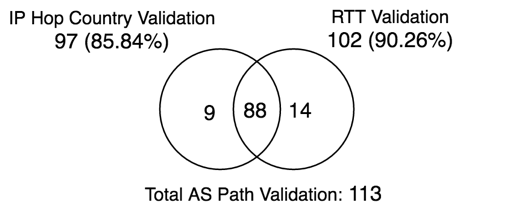
Out of 113 detours, 97 did show IPs belonging to foreign countries in the traceroute and 102 detours showed a magnitude jump in their RTT. The overlap was also significant.
This shows that by using an intuitive control plane approach to detect detours, it is possible to perform a larger scale analysis than data plane only approaches and still achieve 85-90% accuracy.
Which countries see more detours?
All detours, suspicious or not, are interesting in their own right. Our goal at the moment is not to detect if a detour is malicious (a job not supported by data) but to present characteristics at a global scale.
Here, we present our results from analysis of historical data of January 2016 from 416 BGP peers that span more than 30 countries. As shown in the following table, we analyzed more than 14 billion RIB entries. Only 659,000 showed a detour out of which 115,000 had a known peering relationship. Thus, we are left with 544,000 detours out of which only 18,000 are unique (prefix, AS Path tuple).
| No. Total RIB entries | No. Total detours without filtering peered paths | No. Detours with peered paths | No. Analyzed detours | No. Unique detours |
| 14,366,653,046 | 659,569 | 115,085 | 544,484 | 18,995 |
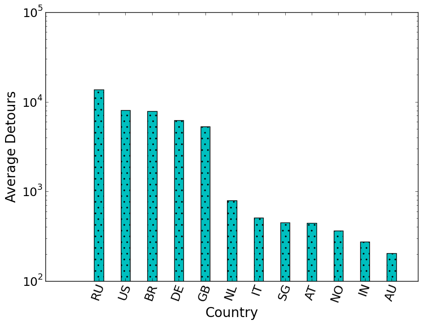
To provide an understanding on number of detours per peer in each country, we normalized the data by dividing the number of detours by the number of peers in the country. The reason to normalize data is simple: RouteViews and RIPE RIS peers are not evenly distributed among different countries. Therefore, it is possible that more detours are seen in countries that have more peers due to more visibility.
An average number of detours per peer per country provides better insight. Out of 30 countries, only 12 countries observed a detour, with Russia showing most number of average detours (Figure 3).
Understanding the total number of detours in different countries is important but it does not reflect if detours seen in different countries have different characteristics.
Characterizing detours
An important characteristic of a detour is its duration. In our analysis of over a month’s worth of data, we found most detours are either short-lived (a couple of days) or persist throughout the month (Figure 4).
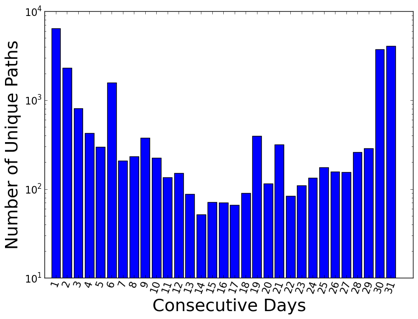
By taking another look at persistence in terms of the number of hours rather than consecutive days, we found that 90% of the detours are transient, that is they last less than 72 hours. It is our expectation that detours that cause this sort of traffic engineering should not show this transience. To further study behaviour of detours, we defined two metrics:
- Flap Rate: Measure of stability of a detour; how many times a detour disappeared and reappeared
- Duty Cycle: Measure of uptime of a detour throughout the month measurement period
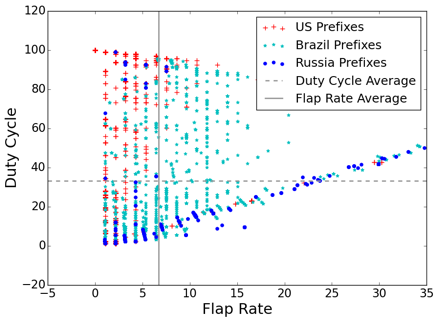
In our dataset of consideration, January 2016, Brazil, Russia and the US accounted for 90% of the detours (Figure 5). We observe that US detours are much more stable than Brazil or Russia. Also, Russian detours tend to have much less duty cycle.
We also studied a similar scatter plot for African detours. In this case, most detours appeared in the second quadrant (like the US) indicating very stable detours which are a result of conscious traffic engineering.
Our analysis has shown that while detours are common in the Internet, their behaviour may differ based on where they occur. Local peering and IXP conditions and stability of networks themselves may contribute to such distinct geographic characteristics.
Which ASs cause the most detours?
In our analysis, we found four ASs cause more than 50% of the transient detours. Similarly, a few prefixes get affected more than others. We observed about 30 prefixes to suffer more than 50% of the detours.
In the following table, we show the top ASs responsible for starting the detour. Next to each AS is the total percentage of detours the AS started. Following the percentage is the AS where the detour visited (foreign AS) most commonly and last is the percent of the detours out of the total that went to this common destination.
| Transient detour origin AS | Total | Frequent detour destination AS | % to frequent destination |
| 9002 (RETN-AS RETN Limited,RU) | 22.64% | 2914 (NTT America) | 99.07% |
| 6939 (Hurrican Electric,IT) | 10.94% | 8551 (Bezeq International) | 100% |
| 1299 (Telianet,IT) | 10.87% | 8708 (RCS-RDS) | 100% |
What’s next?
In the future, we plan to continue to build a system that detects routing events in near-real time. It is apparent that we need to include both control and data plane measurements and study algorithms that take input from both.
Our first goal, is to provide ISPs with a tool to alert when a detour has taken place, followed by information about it. We also plan to study emerging regulatory requirements and provide feedback about the challenges they pose.
Our work has illuminated the difficulties in expanding the scope within the existing measurement infrastructures. One of the main difficulties we encountered is finding measurement points with both control (BGP peers) and data (RIPE probes) monitors to correlate results. This problem cannot be easily solved, as it would take substantial effort to scale the existing infrastructures.
Another important obstacle is a lack of knowledge about peering relationships between ASs. This is also a hard problem to solve since such relationships are not readily disclosed. It is interesting, however, to contemplate the issue if regulatory requirements require such disclosures.
Based on our results, we believe that it will be hard to solve this problem without substantial data plane monitoring deployment to corroborate control plane measurements. ISPs and IXPs may be required to install sophisticated data plane probe infrastructure and geolocation databases may have to become far more accurate for infrastructure IP addresses in order to detect international detours with some certainty. Control plane monitoring is still very important as it provides efficient global monitoring and can immediately flag potential anomalies where data plane monitoring should be directed.
Our work lays the ground for an important conversation about the challenges new regulatory frameworks will pose to researchers, industry and network operators. It provides some answers, but also brings attention to the problem and will hopefully stimulate more work in this area. The gauntlet was thrown and we expect a lot more research in this area.
Anant Shah is a PhD Candidate at Colorado State University.
The views expressed by the authors of this blog are their own and do not necessarily reflect the views of APNIC. Please note a Code of Conduct applies to this blog.
Hi Anant, great work!
I’d add a few comments here because I think that there’s an angel that lends importance to it that really ought to be mentioned here:
1) Detours don’t just take place between country A and B, but can also involve third countries C. For example, packets from Japan to New Zealand often travel via the US mainland, although this is by no means the shortest path (see http://www.submarinecablemap.com). Just as I type this, packets from the University of Tokyo to the University of Auckland travel via Los Angeles. There are also routes via Australia, for example, or (accessible to the NSA if it then must be) Hawaii. Needless to say this can add quite a bit of latency.
2) The extra latency introduced by detours of all sorts is a serious issue: It slows down TCP and erodes the usability of real-time applications, from VoIP (where we really want to keep latency below about 150 ms – and remember this includes jitter buffering!) and videoconferencing to remote control applications. Snooping aside, this is a serious competitive disadvantage for customers of ASs that care only about reachability but not latency. Would you invest in a call centre in India that’s targeting the UK night shift customer base if you couldn’t be assured that today’s latency of, say, 110 ms doesn’t turn into 200-something ms overnight because your ISP now peers with an AS in Hong Kong that considers a route via the US the most feasible option?
Cheers, Ulrich
Hi Ulrich,
Glad you liked the work!
I agree with you, in many cases paths hop into a 3rd country that is just a transit point. In most cases, these are western countries that still play important role in international connectivity (see ‘Nation-state routing: Censorship, wiretapping’ from Rexford and team). Countries in African continent commonly do this. A path from South Africa to Kenya might go via London exchange.
Detecting such paths will not be hard, for example, we currently flag path US-CN-US so we start flagging paths like US-CN-IN. But there will also be legitimate routes like US-GB-IN which takes the shortest path. Unless there is some sort of ground truth available it is extremely hard to differentiate which one is an anomaly ‘US-CN-IN’ or ‘US-GB-IN’ keeping in mind that in some cases, based on congestion, more geographic distance might still have low latency than other paths.
Dear Anant
I work at Hurricane Electric. Thanks for detailed data. It’s interesting to see data along with destinations & network. Since your data suggests that our AS has frequent detours – I would like to mention that most of-of these cases are because of a given network not peering with another network in their home market.
Hurricane Electric follows an open peering policy and that is true across all our PoPs and for all networks regardless of their size. If any of network in a given region does not peer in the home market & peers with us far off in our home market or buys transit from someone else far away from their home region this impact can happen.
Thanks.